
記住我
Fibromyalgia (FM) is a condition with chronic widespread musculoskeletal pain, generalized hyperalgesia, and allodynia.2,50 Fibromyalgia has a prevalence of 2% to 8% in the general population, and it is more common in women.22,35,51 Patients with FM often experience impaired cognitive functions, sleep disturbances, mild to pronounced fatigue, anxiety, and depression.23,28 The quality of life is significantly reduced, and their health care–related and societal costs are high.7 The etiology of FM is not yet determined, and the pathophysiology is presumed to be a complex interplay of peripheral and central sensitization,5,8,38 with a lowered nociceptive threshold.41,47 Neuroinflammation, which implies that immune activation can modulate the excitability of nociceptive pathways, and small fiber neuropathy have been reported to influence and cause peripheral sensitization.42,54 Low-grade inflammation and altered cytokine profiles have been reported in FM.9,17 Significantly altered levels of inflammatory plasma proteins and analgetic and anti-inflammatory endocannabinoid lipid mediators have been detected when comparing patients with chronic pain conditions with healthy controls, suggesting that the differences are related to FM.19,43,52 Altered metabolism and blood flow in muscles, potentially associated with mitochondrial dysfunction, have been found in FM.20 These findings together might reflect an expression of ongoing low-grade inflammation in patients with FM.
Obesity and overweight have a prevalence of 60 to 70% in patients with FM.10,24,31 Pain and obesity are multifactorial conditions with a reciprocal relationship where they seem to influence each other in a negative manner.12,39 Obesity might cause pain through mechanical loading and low-grade chronic inflammation because fat has endocrine functions and secretes proinflammatory cytokines such as IL-6 and TNF-α,29 which have been reported to be elevated in FM.19 Proinflammatory cytokines can give rise to a hyperalgesia state24,29 because they contribute to the generation of mediators such as prostaglandins, histamine, and bradykinin, which interacts with the nervous system to induce pain.29 Conversely, pain could contribute to obesity through a more sedentary lifestyle and pain-associated avoidance behavior as well as through hedonic eating, which leads to temporary analgesic effects and can also constitute a coping mechanism.29 Pain and obesity become part of a vicious circle, which deteriorate the patients' health,12 because both high body mass index (BMI) and FM have been associated with inflammation.37,52 Considering that high BMI up to obesity level (≥30 kg/m2) is prevalent in FM, it is important to elucidate whether the markers of inflammation found in previous studies on patients with FM are in fact related to BMI (partly). Therefore, this study investigates the inflammatory protein profile in patients with FM with and without obesity. The primary aim is to investigate whether there are differences in inflammatory plasma protein profile and pain characteristics. The secondary aim is to investigate correlations between inflammatory plasma proteins with pain characteristic parameters in patients with FM with obesity.
2. Materials and methods 2.1. Study designThis study is part of a larger project that was a case–control design, investigating peripheral biochemical alterations in blood, saliva, and muscle and the correlation with central nervous system alterations in patients with FM and healthy age- and sex-matched control subjects.20,45 In this study, only patients with FM are included.
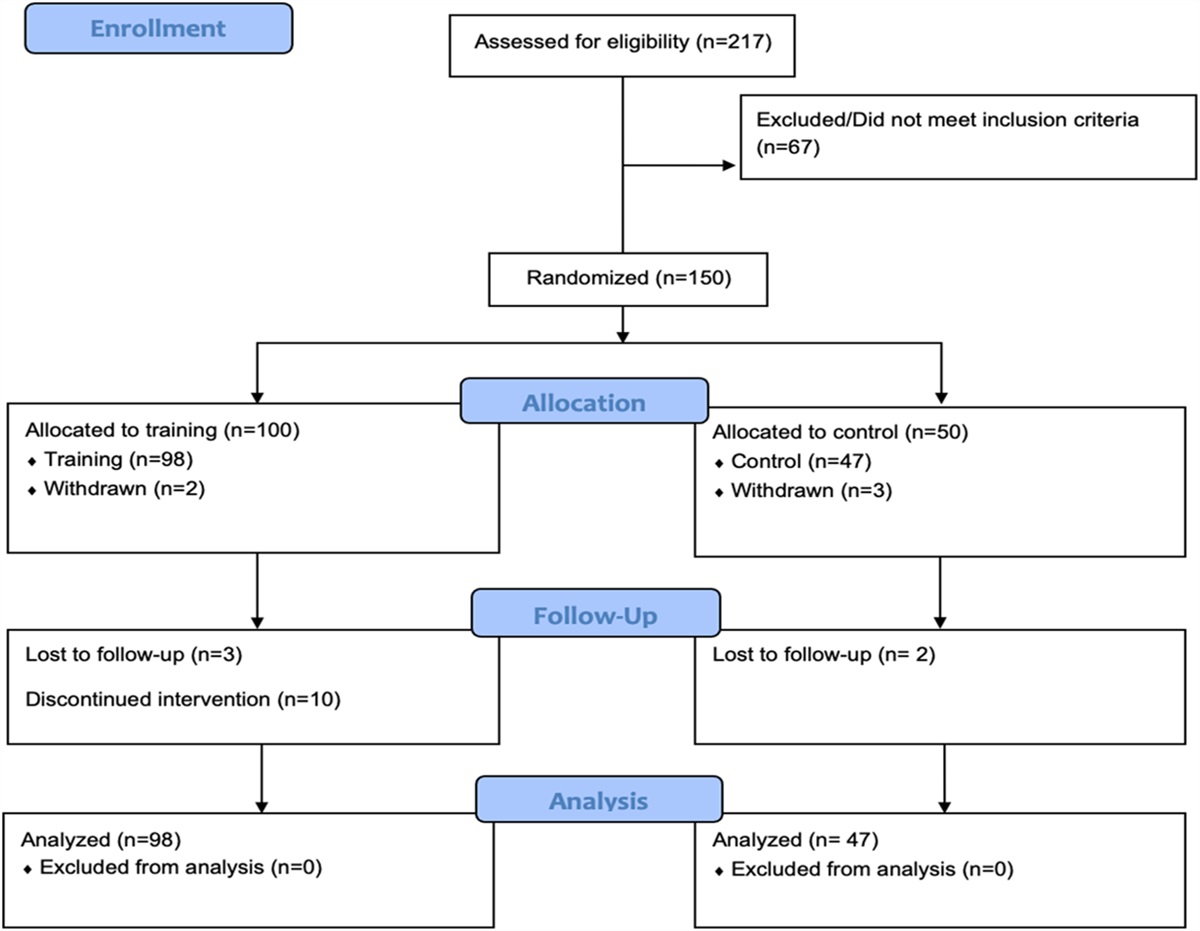
2.2. Study populationA total of 33 female patients with FM were recruited from the Pain and Rehabilitation Centre at the University Hospital in Linköping, Sweden. The inclusion criteria were female, FM diagnosis in accordance with the American College of Rheumatology (ACR) criteria 1990,50 and age in the range of 20 to 65 years. The exclusion criteria were contraindication for magnetic resonance examination, pregnancy, metabolic disease, rheumatoid arthritis, cardiovascular disease, lung disease, neurological disease, malignancy, severe psychiatric condition, and harmful consumption of alcohol, which corresponds to a score ≥6 in the Alcohol Use Disorder Identification Test.3 The inability to follow instruction for the 48-hour medical washout, refrainment from caffeine and nicotine for 12 hours, before sampling were also requirements. The patients were also instructed to avoid any heavy exercise for 48 hours before sampling.
Six participants were excluded because they did not provide blood samples. The remaining subjects (n = 27) were classified according to the World Health Organization (WHO) criteria: 18.5 to 24.9 = normal weight; 25.0 to 29.9 = overweight; 30.0 to 34.9 = mild obesity; and ≥35 = severe obesity (28). For the analyses, because the total number of participants was 27, they were divided into 2 groups regarding their BMI. The first group (labelled nonobese group) consisted of subjects with BMI <30 kg/m2, thus including both normal weight and overweight patients with FM. The second group (labelled obese group) consisted of subjects with BMI ≥30 kg/m2, hence consisting of patients with FM with mild and severe obesity; see Table 1.
Table 1 - Patient-reported outcome measures (PROMs) obtained from health questionnaire. Variables Nonobese patients with FM Obese patients with FM Statistics n Mean ± SD or median (min–max) n Mean ± SD or median (min–max) P Age (y)* 14 38.57 ± 12.62 13 43.85 ± 8.74 0.22 FM duration (y)† 14 3 (2–23) 13 8 (2–23) 0.06 Global pain intensity 7 d (NRS)* 13 5.85 ± 1.34 13 7.54 ± 1.66 0.01‡ HADS-depression* 14 6.86 ± 3.59 13 5.92 ± 3.62 0.51 HADS-anxiety* 14 7 ± 3.46 13 8.92 ± 3.90 0.19 HADS total* 14 13.86 ± 6.68 13 14.85 ± 6.34 0.70 PCS rumination* 14 6.57 ± 3.32 13 6.92 ± 4.54 0.82 PCS magnification* 14 3.71 ± 2.49 13 3.62 ± 2.22 0.91 PCS helplessness* 14 11.29 ± 4.65 13 11.62 ± 5.32 0.87 PCS total* 14 21.57 ± 9.09 13 22.15 ± 11.47 0.88 ISI total* 14 12.64 ± 6.46 13 16.15 ± 4.93 0.13 Sedentary behavior (hours/d)* 13 6.24 ± 2.47 12 5.48 ± 2.14 0.42 Physical activity-walking(days/wk)† 14 7 (0–7) 13 7 (3–7) 0.44 Physical activity-moderately strenuous activity (days/wk)† 14 2 (0–7) 13 1 (0–6) 0.58 Physical activity-very strenuous activity(days/wk)† 14 0 (0–7) 13 0 (0–5) 1.00 Physical capacity 30 min* 13 7.46 ± 3.15 13 5.08 ± 2.66 <0.05‡ PDI total* 14 35.57 ± 6.73 13 38.15 ± 14.58 0.57 LiSat-11 physical health† 14 2 (1–5) 13 2 (1–4) 0.65 LiSat-11 mental health† 14 4 (1–5) 13 3 (1–6) 0.57 LiSat-11 total* 14 41.29 ± 8.77 13 39.23 ± 9.06 0.56 FIQ total* 14 54.10 ± 14.10 13 66.23 ± 13.87 0.03‡‡Statistical significance.
*Normally distributed variables analyzed using the independent-samples t test and presented as mean (±SD).
†Not normally distributed variables analyzed using the Mann–Whitney U test and presented as median (minimum–maximum).
FM, fibromyalgia; n, number of participants; NRS, numeric rating scale; HADS, Hospital Anxiety and Depression Scale; PCS, Pain Catastrophizing Scale; ISI, Insomnia Severity Index; PDI, Pain Disability Index; LiSat-11, Life Satisfaction Questionnaire; FIQ, Fibromyalgia Impact Questionnaire.
All participants received verbal and written information about the study. Informed written consent was obtained, and the study was performed in accordance with the Helsinki Declaration. The study was approved by the Linköping University Ethics Committee (Dnr: 2016/239–31).
2.3. ProcedureThe data were collected during visits at the Pain and Rehabilitation Centre in 2017 to 2018. At the first visit, clinical examinations and physical tests were performed on all participants. Between the first and the second visit, the participants answered a health questionnaire at home, the content of which is described below. At the second visit, microdialysis samples from trapezius muscle and blood samples were collected. The term “pain characteristic parameters” refer to variables obtained from clinical examinations and physical tests (clinical parameters) and variables obtained from the health questionnaire.
2.4. Clinical examinations and physical testsAll participants went through clinical examinations and physical tests. Measurements of height (m), weight (kg), and systolic and diastolic blood pressure (mm Hg) were performed by a research nurse. The aerobic fitness test (Åstrand test), which measures MaxVO2, was performed.55 For a detailed description of all tests, see Supplementary Methods (available at https://links.lww.com/PR9/A175).
2.5. QuestionnairesAll participants answered a health questionnaire covering demographic and background data as well as containing multiple validated questionnaires regarding the psychosocial health. The participants stated their global pain intensity based on the last 7 days on a numeric rating scale (NRS) from 0 to 10, where 0 equaled no pain and 10 equaled worst possible pain. Patients with FM stated the year they were diagnosed with FM, which was converted into the variable FM duration.
2.6. Physical activity and sedentary behaviorThe questionnaire included information about physical activity and sedentary behavior. These questions were taken from the Swedish National Board of Health and Welfare, and the questions were answered in a so-called open mode.38 One question was about the number of hours and minutes of sedentary behavior on an average day based on the last 7 days. Questions about the frequency (number of days per week) of walking as well as of moderately strenuous and vigorous physical activity based on the last 7 days were included. They were only allowed to consider the physical activities that lasted for at least 10 minutes. The participants also stated their self-perceived estimated level of physical capacity that they believed they could maintain for at least 30 minutes (physical capacity 30 minutes), on a scale from 1 to 18, where 1 equaled sitting down and 18 equaled aerobic exercise on elite level for women.
2.7. Sample collection 2.7.1. Blood samplesVenous blood samples were collected in two 8-mL EDTA tubes. The samples were centrifuged at 1000g for 15 minutes, and the separate layers of plasma from the 2 blood samples, approximately 5 to 6 mL in total, were collected into a 12-mL Falcon tube and mixed gently. The plasma aliquoted in small portions and stored in −86°C until analysis.
2.8. Microdialysis samplingMicrodialysis is a well-established sampling technique for small molecules that has contributed to increased knowledge of peripheral nociceptive and metabolic mechanisms in chronic pain.4,25,36,40 The technique is based on a thin catheter with a semipermeable membrane that mimic the function of capillary blood vessel. The catheter is inserted in the trapezius muscle and perfused with a physiological saline solution. The small molecules in the interstitium are collected continuously by diffusion across the membrane along a concentration gradient.44 Microdialysis was conducted on trapezius muscle for 220 minutes. Samples were collected every 20 minutes, and subjects rated their pain (0 = no pain; 10 = worst imaginable pain) before catheter insertion, immediately after and every 20 minutes. The first 120 minutes after catheter insertion (the trauma period) was considered the time for tissue to recover from any trauma-induced changes in the interstitial environment. After this period, a 20-minute baseline period (denoted 140 minutes) followed by a 20-minute period of standardized repetitive low-force exercise on a pegboard (denoted 160 minutes) was performed. The experiment ended with a recovery period of 60 minutes during which participants rested in the armchair. For a detailed description, see Supplementary Methods (available at https://links.lww.com/PR9/A175).
2.9. Biochemical analysisA commercially available panel of 71 proinflammatory and anti-inflammatory proteins (cytokines, chemokines, and growth factors) (U-PLEX, Meso Scale Discovery, Maryland) was used for biochemical analyzes on plasma. For a detailed description, see Supplementary Methods (available at https://links.lww.com/PR9/A175). The names of proteins and their limit of detections are listed in Supplementary Table 1 (available at https://links.lww.com/PR9/A175). The analysis of the pyruvate in microdialysis samples was made according to the methods presented in our earlier articles.25
2.10. Statistical analysesThe statistical program IBM SPSS Statistics (version 27) was used for univariate and bivariate statistics, whereas the program SIMCA (version 17; Sartorius Stedim Biotech, Umeå, Sweden) was used for multivariate data analysis. P-value <0.05 was considered statistically significant.
2.11. Univariate and bivariate statisticsDescriptive statistics were presented as mean values ± 1SD (normally distributed variables) or as median (minimum–maximum) (non-normally distributed variables). The differences between the 2 groups of patients with FM regarding the pain characteristic parameters were investigated using either independent-samples t test or Mann–Whitney U test for normally and non-normally distributed variables, respectively. Proteins that were detected in ≥50% of samples in one of the 2 groups were included in the statistical analyzes. In this case, only 2 of the 71 proteins in the panel were excluded because of this requirement, namely IL1β and TSLP. The levels of the remaining 69 proinflammatory and anti-inflammatory proteins were compared between the groups using the Mann–Whitney U test.
2.12. Multivariate data analysisMultivariate data analysis is an exploratory method for investigating patterns in data. Multivariate data analysis is frequently used when dealing with omics data, such as proteomics19,52 where the number of variables significantly exceeded the number of participants.48 Principal component analysis was performed to evaluate the homogeneity of the data and to identify outliers.53,54 Hotelling's T2, which is a multivariate generalization of a 95% confidence interval, was used to identify strong outliers, and DModX (distance to model X) was used to identify moderate outliers. Orthogonal partial least squares discriminant analysis (OPLS-DA) was used to determine whether the plasma protein levels and the pain characteristic parameters differed between nonobese and obese patients with FM. For a detailed description, see Supplementary 1 (available at https://links.lww.com/PR9/A175).
GraphPad Prism (GraphPad Software LLC, San Diego, version 9.1.0) was used for the construction of graphs for selected proteins, with the highest VIP scores in OPLS-DA. Patients with FM were divided into normal weight, overweight, and obese (x-axis), and the median (range) of the concentration of proteins was displayed on the y-axis.
3. Results 3.1. Differences between nonobese and obese patients with fibromyalgia 3.1.1. QuestionnaireThe participants were between 22 and 56 years of age. The variables from the health questionnaires that differed significantly between the 2 groups were global pain intensity for the last 7 days, FIQ and estimated physical capacity (physical capacity 30 minutes). There were no significant differences between the groups regarding age, FM duration, anxiety, depression, pain catastrophizing, sleep disturbance, physical activity and inactivity, pain disability, or life satisfaction (Table 1). Smoking is a potential confounding factor when working with proinflammatory biomarkers. However, this factor was not considered in the analyzes because smoking was such an infrequent habit in this study population (n = 5). There were 3 obese subjects and 1 nonobese subject who reported smoking every day, and 1 nonobese subject with FM reported smoking less often than every day.
3.2. Clinical examinations and physical testsComparison of the 2 groups of patients with FM through bivariate analyzes showed significant increase in systolic and diastolic blood pressures and pulse, whereas maximal oxygen uptake (E-max VO2max), effort level, 30-second chair stand test (30CST), and the variables of grip strength and PPT did not differ significantly between the groups (Table 2).
Table 2 - Clinical parameters obtained from clinical examinations and physical tests. Variables Nonobese patients with FM Obese patients with FM Statistics n Mean ± SD or median (min–max) n Mean ± SD or median (min–max) P BMI (kg/m2)* 14 24.48 ± 3.12 13 35 ± 3.34 <0.01† Blood pressure systolic (mm Hg)‡ 13 120 (100–140) 13 130 (110–155) 0.02† Blood pressure diastolic (mm Hg)‡ 13 80 (60–80) 13 80 (70–100) 0.04† Pulse (bpm)* 13 84.69 ± 9.66 11 96.91 ± 11.24 0.01† Effort level (Borg scale)‡ 14 7 (6–13) 10 7 (6–15) 0.69 30CST (number of times)‡ 10 13.5 (10–23) 10 13 (6–16) 0.82 Max VO2 (ml O2/kg†min)‡ 13 2.1 (1.5–3.4) 12 1.9 (1.6–2.9) 0.60 Mean grip strength maximal (N)* 14 250.54 ± 70.97 12 229.59 ± 73.07 0.47 Mean grip strength average (N)* 14 171.44 ± 60.14 12 149.47 ± 57.17 0.35 Mean grip strength endurance (N)* 14 145.56 ± 53.31 12 128.66 ± 51.53 0.42 Mean PPT trapezius right (kPa)‡ 14 108 (38.33–281) 13 75.67 (24.33–258.67) 0.24 Mean PPT trapezius left (kPa)* 14 102.55 ± 54.56 13 85.23 ± 74.26 0.49 Mean PPT trapezius (kPa)* 14 117.15 ± 60.85 13 96.01 ± 76.17 0.43*Normally distributed variables analyzed using the independent-samples t test and presented as mean (±SD).
†Statistical significance.
‡Not normally distributed variables analyzed using the Mann–Whitney U test and presented as median (minimum–maximum).
FM, fibromyalgia; n, number of participants; 30CST, 30-s chair stand test; E-Max VO2, maximal oxygen uptake; PPT, pressure pain threshold.
Principal component analysis was performed before the OPLS-DA and OPLS analyzes to detect any outliers in the data. One participant was identified as potential outliers based on Hotelling's T2. Retrospective data quality control revealed no major discrepancies in data, except for higher levels of some proteins in comparison with the other participants. Altogether, the exclusion of this participant from the subsequent analyzes was not justified.
A significant OPLS-DA model (1 predictive and 1 orthogonal component, R2 = 0.67, Q2 = 0.47, CV-ANOVA = 0.0058) containing 1 predictive component and 1 orthogonal component was obtained when comparing nonobese patients with FM with obese patients with FM (Fig. 1). The analysis was performed in 2 steps; in the first step, all variables were included in the analysis, and then in the second step, the variables with VIP ≥1.0 were used in a new OPLS regression. The score plot is colored for obesity (red circle), overweight (blue circle), and normal weight (green circle). The group with normal weight and overweight clustered together as a group of nonobese patients (Fig. 1). There were 14 proteins with VIPpred ≥1 and absolute P(corr) ≥0.3 that were important for group discrimination (Table 3). The proteins were positively associated with the obese group, and hence, all were upregulated in the group in obese patients compared with the nonobese group (ie, normal weight and overweight). To investigate the impact of smoking on inflammatory proteins, we reanalyzed the data excluding those study participants who reported smoking (3 obese and 2 nonobese). Differences remained significant (CV-ANOVA = 0.006, R2 = 0.74, Q2 = 0.55) between the obese and nonobese patients with FM. Only 1 protein GM-CSF (Table 3) showed VIP <1.
 Figure 1.:
 Score plot illustrating the discrimination analysis between obese (red circle) and nonobese (green and blue circle) patients.
Table 3 - Proteins important for group separation according to OPLS-DA sorted in descending order for VIPpred between obese and nonobese patients with fibromyalgia. Variables VIPpred P(corr) Nonobese patients with FM (n = 14) Obese patients with FM (n = 13) P Median (min–max) Median (min–max) MIP1β 1.63 −0.67 26.41 (16.22–47.28) 43.96 (20.99–94.17) 0.01* MCP4 1.53 −0.63 32.14 (24.56–58.80) 43.78 (31.27–95.14) <0.01* IL1RA 1.44 −0.59 112.74 (58.49–457.66) 277.06 (104.04–887.37) <0.01* IL6 1.39 −0.57 0.34 (0.12–1.16) 0.81 (0.44–2.20) <0.01* IP10 1.38 −0.57 122.46 (71.23–557.00) 221.23 (134.30–772.20) 0.01* MIP1α 1.36 −0.56 12.85 (9.47–21.05) 18.20 (7.67–24.16) 0.03* MCP1 1.24 −0.51 87.98 (64.90–162.63) 118.41 (49.21–244.27) 0.11 TARC 1.14 −0.47 21.76 (10.25–58.19) 29.14 (13.93–67.23) 0.24 IFNα2a 1.13 0.47 0.09 (0.00–36.12) 0.19 (0.00–0.66) 0.32 MCSF 1.11 −0.46 4.67 (2.35–10.79) 6.88 (3.00–14.10) 0.01* TNFβ 1.09 0.45 0.12 (0.00–2.63) 0.13 (0.05–0.42) 0.92 MDC 1.09 −0.45 569.68 (231.59–918.04) 754.59 (486.41–1383.49) 0.01* GMCSF 1.03 0.42 0.00 (0.00–0.55) 0.004 (0.00–0.14) 0.71 IL17C 1.01 −0.41 2.48 (0.87–4.98) 3.00 (0.26–12.31) 0.24P-values marked with * refer to statistical significance.
The levels of the 4 plasma proteins with the highest importance in the OPLS-DA, namely macrophage inflammatory protein 1-beta (MIP-1β), monocyte chemotactic protein 4 (MCP4), interleukin-1 receptor antagonist protein (IL1RA), and interleukin 6 (IL6) were compared between patients with normal weight (n = 7), overweight (n = 7), and obesity (n = 13) (Fig. 2). There was an increased protein levels with increased BMI for the selected proteins.
 Figure 2.:
 Plasma protein levels in different classes of BMI. P-values were obtained from the comparison between nonobese (ie, normal weight + overweight) and obese patients with FM through the Mann–Whitney U test. BMI group 1, group 2, and group 3 consist of subjects with normal weight, overweight, and obesity, respectively. The graphs present protein concentrations for the subjects as individual values and median with range. BMI, body mass index.
3.5. Plasma proteins and their correlation to sedentary behavior and impactIn the group with obese patients with FM, significant correlations (P < 0.05) were found between proteins and sedentary behavior and FIQ. The OPLS model (1 predictive component, R2 = 0.70, Q2 = 0.52, CV-ANOVA P-value = 0.037) of physical inactivity showed that 19 proteins (VIP > 1 and absolute P(corr) > 0.3) were multivariately correlated with sedentary behavior in obese patients with FM (Table 4). Of these 19 proteins, 17 were upregulated and 2 were downregulated in the group with obese patients with FM when compared with the group with nonobese (Table 4).
Table 4 - Proteins correlated with sedentary behavior in obese patients with fibromyalgia (left columns). Variables VIP P(corr) Nonobese patients with FM (n = 14) Obese patients with FM (n = 13) P Obese vs Median pg/mL (min–max) Median pg/mL (min–max) Nonobese IL17D 1.672 0.525 6.784 (0–27.779) 7.022 (0–79.767) 0.808 ↑ IL33 1.605 0.473 1.004 (0.548–2.308) 1.280 (0–4.279) 0.884 ↑ MCP2 1.577 0.604 10.684 (7.800–44.228) 16.401 (8.340–29.866) 0.010* ↑ IL3 1.562 0.3077 10.499 (0–36.914) 15.768 (0–83.652) 0.242 ↑ IL17B 1.561 0.303 1.154 (0.267–2.853) 1.173 (0.291–6.150) 0.467 ↑ IL17F 1.557 0.439 1539.862 (774.797–2697.677) 2156.448 (250.921–5153.160) 0.409 ↑ IL17EIL25 1.556 0.358 3.337 (1.835–10.661) 4.746 (0.449–14.321) 0.528 ↑ IL31 1.524 0.3242 15.950 (10.017–26.537) 20.743 (0–41.786) 0.734 ↑ MCP4 1.524 0.576 32.137 (24.560–58.795) 43.781 (31.277–95.143) 0.004* ↑ IP10 1.513 0.5769 122.464 (71.229–557.002) 221.230 (134.299–772.197) 0.007* ↑ IL22 1.494 0.338 1.412 (0.601–4.574) 1.860 (0.354–5.000) 0.771 ↑ IL13 1.475 0.300 6.785 (2.720–13.359) 7.378 (4.254–13.713) 0.884 ↑ TARC 1.474 0.750 21.766 (10.252–58.192) 29.145 (13.934–67.230) 0.244 ↑ MCP1 1.415
留言 (0)