
記住我
Population-based research suggests a higher risk of several pain conditions,16,49,51 including chronic neuropathic pain,10,46 in women compared with men. Chronic neuropathic pain patients are heterogeneous with a multitude of confounding genetic, pathophysiological, and psychosocial elements, all of which are variably expressed in each individual. The influence of sex hormones in neuropathic pain is receiving increased attention because it represents a significant source of pain-related variability.1 The current consensus is that estrogen reduces hyperpolarization postinjury of the peripheral nerve system and acts in a both preventive and hyperalgesic manner, whereas male hormones have antinociceptive effects.27 Attention has been also focused on the action of sex hormones on endogenous pain modulation as a contributor to greater pain sensitivity and higher prevalence of many chronic pain conditions in women.36 For instance, in some studies, male patients expressed more effective descending inhibition quantified by conditioned pain modulation (CPM).7,8,13,34,39 In other studies, no sex differences3,52 or more CPM reproducibility/stability in women with chronic pain were seen.29 This ambiguity may be because of different pain conditions studied and different testing paradigms used.
We have previously demonstrated that CPM cannot be used as a mechanism to differentiate chronic neuropathic pain from neuropathy without pain because the neuropathic pain patients after trauma and surgery had well-functioning CPM, similar to that of patients with the same type of nerve lesions but with no pain.30 In this follow-up study, we hypothesized that sex differences would be reflected in different endogenous inhibitory systems that would confer risk for or protection against persistent pain. Thus, we intended to find (1) whether men and women with painful vs posttraumatic painless neuropathy are similarly sensitive to experimental stimuli and (2) whether they have similar CPM effects. Secondary analysis examined the differences between men and women in (1) pain severity after a standardized stimulus, (2) psychological factors as anxiety and depression, and (3) the degree of pain-related disability. The answers to these questions represent priority areas for understanding and treatment of pain conditions.
2. MethodsThis study has been carried out at the Multidisciplinary Pain Center, Uppsala University Hospital, (UUH), Sweden. The study followed the ethical guidelines from the Declaration of Helsinki and was approved by the Regional Ethics Committee (Project identity: ICONSS, Dnr: 2015/265; registered at www.ClinicalTrials.gov NCT03174665). Informed consent was obtained from all participants.
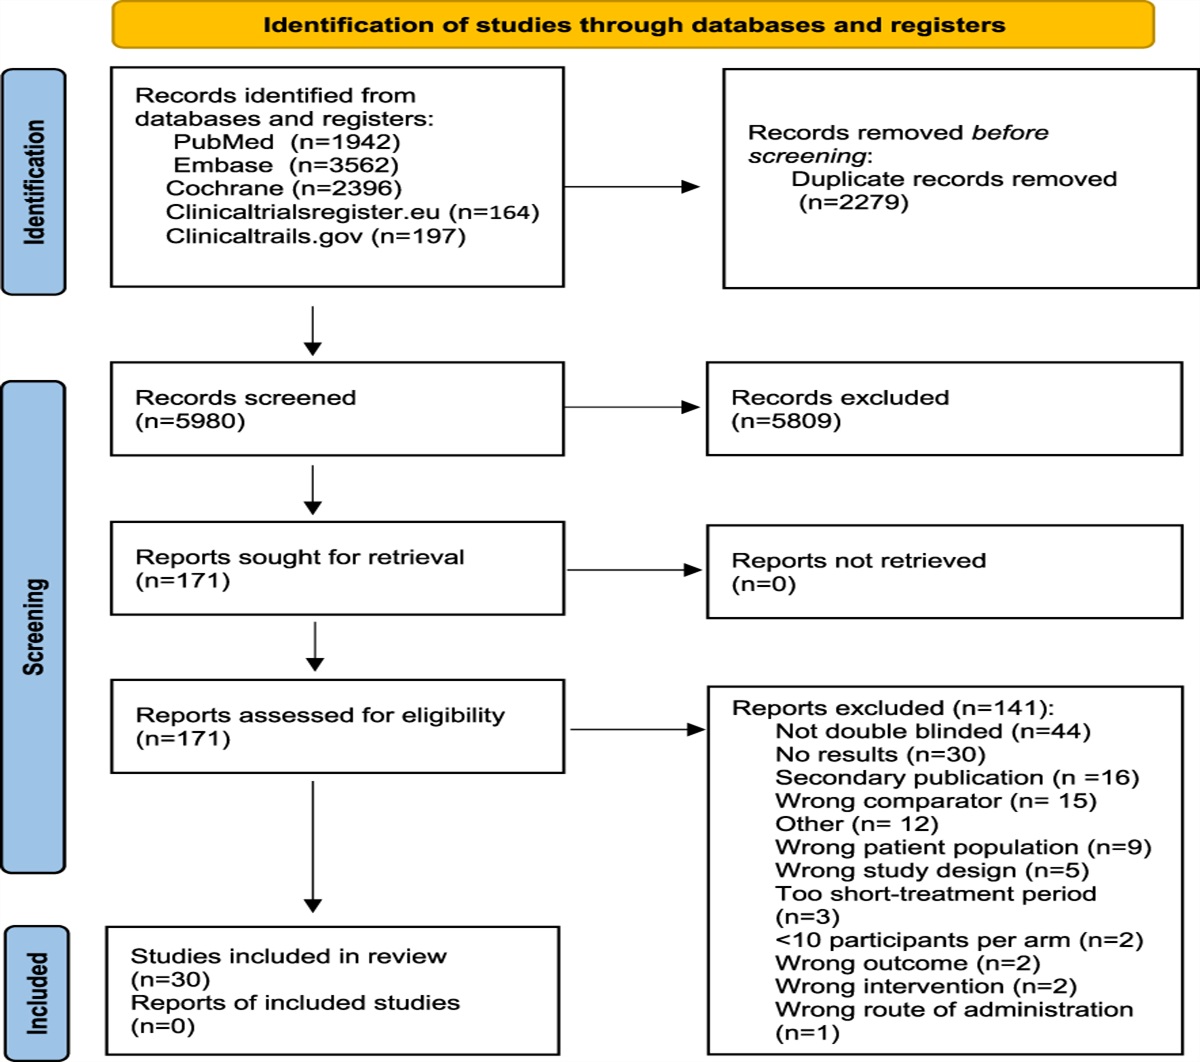
2.1. ParticipantsAll participants of the study were recruited from a larger cohort of more than 1000 patients with traumatic nerve lesion in the hand or lower arm region, admitted (between 2009 and 2015) at the Hand Surgery Clinic, UUH. In January 2016, questionnaires about pain intensity, previous medication, and the Self-Administered Leeds Assessment of Neuropathic Signs and Symptoms (S-LANSS questionnaire) were sent to all the subjects. Of these, 706 patients returned the questionnaire (response rate of 67.1%). Thirty-seven patients without nerve injury (n = 8) or with no indication for surgery (n = 29) were excluded. Of the remaining 669 patients, 50.3% (n = 337; men n = 248, women n = 89) experienced chronic postsurgical pain and 332 patients were pain free (men n = 243, women n = 89).31 Nerve suture (neurorrhaphy) was the most common procedure (79.3%). Among the patients who underwent nerve suture surgery were 271 patients with persistent pain (men n = 199) and 260 patients (women n = 194) without pain. According to their answers to the questionnaires, a group of patients with pain and a group of pain-free controls were invited to participate in a follow-up study.30 The inclusion criteria for the participants were age ≥18 years, a surgical nerve repair after a traumatic nerve lesion in hand and lower arm region, chronic postoperative neuropathic pain with a history of 6 months to 7 years before the screening visit, pain intensity more than 50 mm on a 100-mm visual analogue scale (VAS) for the group of the participants with pain, and intensity of pain <20 mm VAS for the group without pain. The exclusion criteria were evidence or history of any clinically significant neurological disease or other systemic diseases or conditions potentially interfering with study assessments (polyneuropathy, diabetes mellitus, peripheral vascular disease, history of malignant disease, or chronic alcohol consumption).
All the participants were prescreened by the Self-report Leeds Assessment of Neuropathic Signs and Symptoms (S-LANSS questionnaire).30 The participants with pain and S-LANSS ≥12 (indicating predominantly neuropathic pain)5 were recruited for the group with neuropathic pain and those with S-LANSS <12 and sensory impairment were recruited for the group with neuropathy without pain.
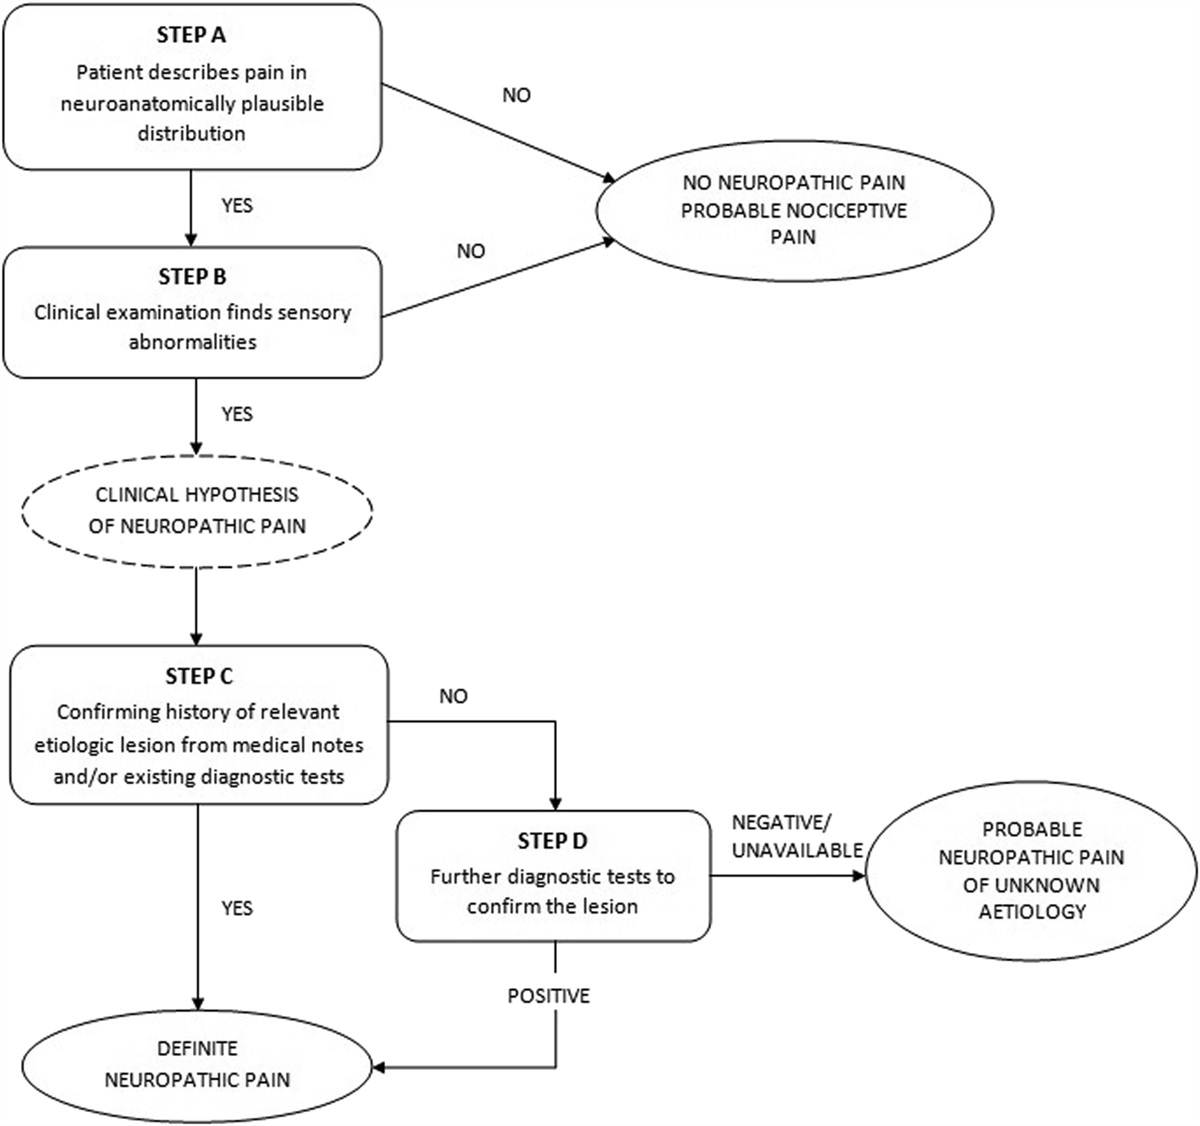
2.2. Eligibility for participantsSeventy-three subjects (34 women and 39 men) with pain and 73 subjects (34 women and 39 men) without pain were examined. Biological sex (male/female) was reported because patients were not asked to self-report. The confirming sensory impairment on examination of the somatosensory system with pain in the innervation territory of a previous intraoperatively verified injured nerve strongly indicated a diagnosis of “definite neuropathic pain” for all the subjects with pain.11,48 All the subjects had a definite traumatic nerve lesion, seen by the surgeon intraoperatively. Eligibility for participants was determined only after completion of a health history questionnaire, interview about pain intensity, and a routine clinical neurological examination. All participants were asked to refrain from any pain medication for at least 12 hours before the experimental session.
2.3. ProceduresAll participants were informed about the test program before (by telephone) and after arrival at the laboratory. Participants attended a single appointment. A standardized case report form was used to collect a detailed pain history that included type of pain, duration and its characteristics, and current and previous pharmacological and nonpharmacological pain management. Sociodemographic data included education level, work status, and family and medical history. Body mass index was calculated using the formula weight/height2 (kg/m2). Baseline brachial resting blood pressure was examined before the experiment was started. All sessions followed the same procedure and were performed by the same trained examiner who read from a standardized instruction protocol when performing CPM.
2.3.1. Pain assessment and clinical examinationAfter clinical evaluation and additional tests (nerve conduction studies before the visit, QST), pain was classified as neuropathic or nonneuropathic using the International Association for the Study of Pain/Neuropathic Pain Special Interest Group grading system.11 Sensory examination testing was for touch with a camel-hair brush (0.5 Somedic, Sweden), pain with a sharp tooth pick, and temperature with warm (40°C) and cold (25°C) rollers (Senselab Rolltemp, Somedic). The contralateral uninjured side served as within subject control. Participants were asked to rate their mean clinical pain over the past week on VAS (0–100).
2.3.2. Conditioned pain modulationThe CPM paradigm that has been described previously involved a tourniquet pressure test stimulus (TS) applied to one leg before and after a thermal conditioning stimulus (CS) by immersion of the uninjured hand in 4°C cold water (Fig. 1).
 Figure 1.:
 Timeline showing CPM stimuli administration. TS, test stimulus (pressure pain); CS, conditioning stimulus (cold water); TS1, pressure pain ratings during the first test stimulus (120 seconds) and return to baseline; TS2, pressure pain ratings during the second test stimulus (120 seconds) and return to baseline; CS, pain ratings during conditioning stimulus (60 seconds) and return to baseline; Time off, time to return to baseline after CS; AUC1, area under the curve calculated from pain rating over time during TS1; AUCCS, area under the curve during CS; AUC2, area under the curve calculated from pain ratings over time during TS2.
2.3.3. Test stimulusThe TS was delivered by a tourniquet applied mid-calf on the leg corresponding to the noninjured arm and inflated from 60 to 100 mm Hg above the systolic blood pressure until the pain intensity (typically 220–250 mm Hg) reported by the subject was over 50 on a 0 to 100 visual analogue scale (VAS). The test stimulus (TS) was applied for a duration of 120 seconds before (TS1) and after (TS2) the conditioning stimulus (CS) at the same pressure.
2.3.4. Conditioning stimulusThe conditioning stimuli was given by having subjects immerse their noninjured hand up to the wrist in a cold-water bath at 4°C cooled by a refrigerated water circulator (Somedic, 2015, Sweden) for a maximum of 1 minute. The CS was applied immediately after the subject became pain free after TS1 and ended when the subject withdrew the hand from the cold-water bath or maximally for one minute. The water level was set at a height of 30 cm and maintained at a constant temperature to keep the stimulated area consistent. Time in the cold-water bath (Time CS) and time until the pain intensity decreased and the subjects became pain free (Time off or time after sensation) after removing the hand from cold water were expressed by the area under the curve (AUCCS, AUCtime off).
Immediately after the subjects became pain free after the conditioning stimulus, an identical test stimulus (TS2) was repeated. The subject was instructed to rate continuously the pain intensity level of both the test stimulus and the conditioning stimulus with the eVAS slider until they became pain free. They could terminate the trial at any time if they could not tolerate the painful pressure (120 seconds) or cold water (60 seconds).
2.3.5. Conditioned pain modulationTo quantify CPM, the deviation of pain ratings from the set point was continuously recorded and summed over time to produce an area under the curve (AUC) value. From the starting point of the first test stimulus forward, this dependent variable (AUC) of the VAS response over time was calculated for both the test stimuli (AUC1 and AUC2) and conditioning stimulus (AUCCS). Thus, CPM was calculated as the difference in area under the curve of pain rating responses between the last test stimulus after CS and the test stimulus before CS (∆AUC = AUC2 − AUC1).
The CPM effect (%CPM) is defined as the percent change of the pain intensity evoked by TS induced before and after CS. The formula used for CPM effect change is as follows: [(TS2 pain − TS1pain)/TS1 pain] × 100. The percentage of CPM (%CPM) = ∆AUC × 100/AUC1. The CPM effect varies from pain inhibition to facilitation. Therefore, negative CPM scores indicate pain inhibition and positive CPM scores indicate pain facilitation. Efficient CPM was defined as the ability of the individuals to inhibit at least 29% of pain.35
2.4. QuestionnairesThe following 3 questionnaires were completed when the participants came to the investigation.
2.4.1. Quality of lifeQuality of life was measured at the start of the study with the 36-Item Short-Form Health Survey (RAND-36), a health survey that consists of 8 concepts investigating physical and mental status.20
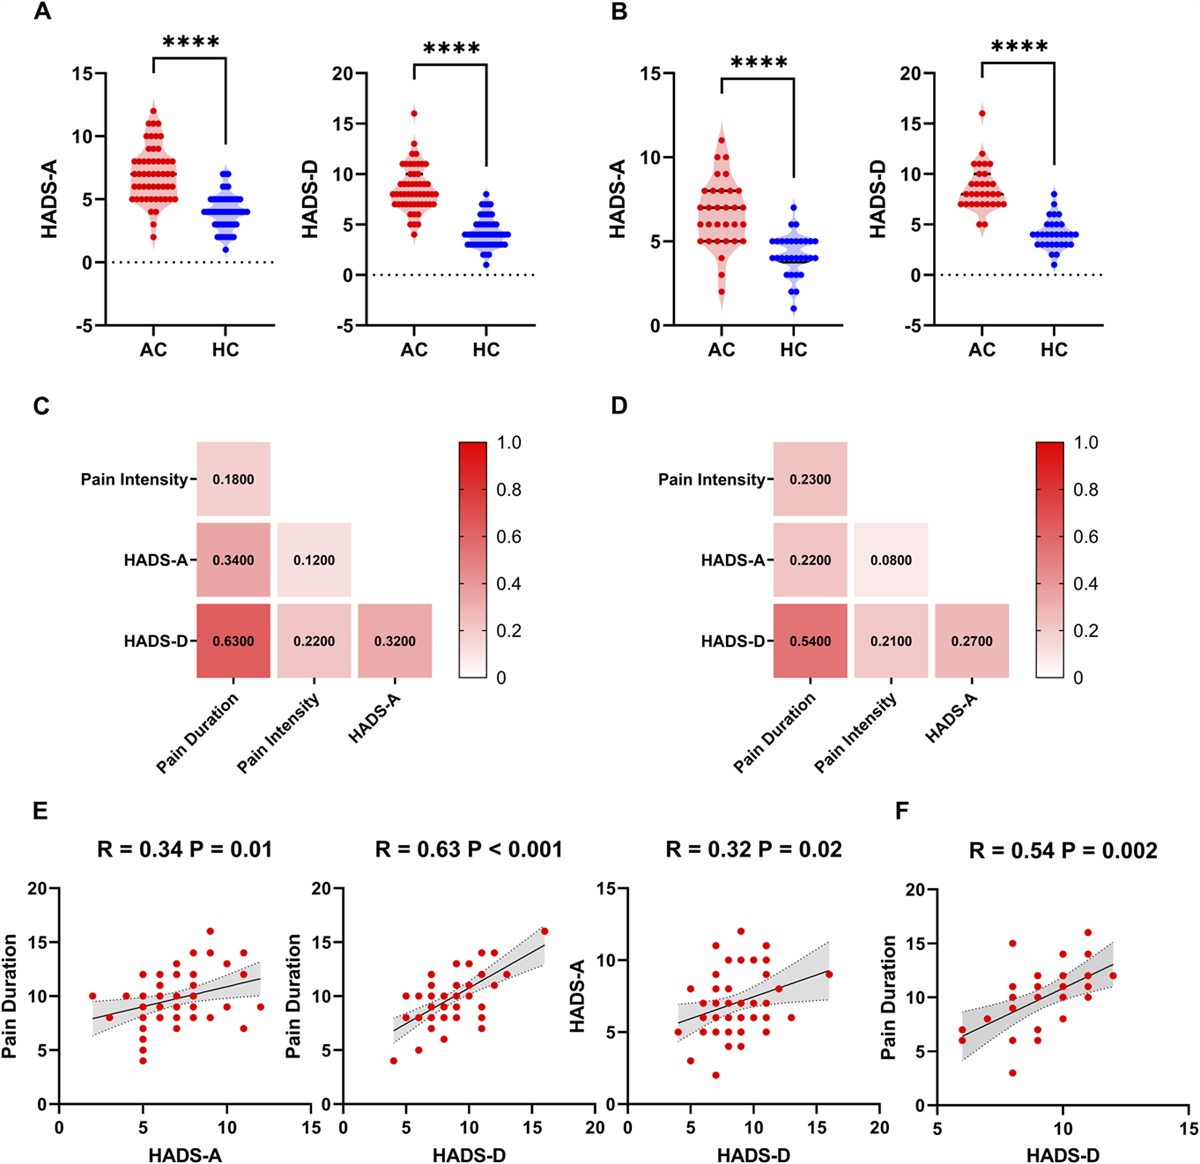
2.4.2. Depression and anxietyThe Hospital Anxiety and Depression Scale is a psychometric questionnaire specifically developed for nonpsychiatric patients to identify the grade of anxiety disorder or depression. It consists of 2 subscales, anxiety and depression. The total score for each subscale was calculated as the sum of the respective 7 items (ranging from 0 to 21), with values being 0–7 for normal cases, 8–10 for borderline cases, and 11–21 for abnormal cases.6
2.4.3. QuickDASH (Disabilities of the Arm, Shoulder, and Hand)QuickDASH is a short, reliable, and valid measure of physical function and symptoms related to upper limb musculoskeletal disorders by shortening the full, 30-item DASH (Disabilities of the Arm, Shoulder, and Hand) Outcome Measure.2
3. StatisticsAll statistical analyses were performed with IBM SPSS Statistic version 19.0.0.1, GraphPad Prism 8 and SAS version 9.4 (SAS Institute, Inc). The level of significance was set at a P-value <0.05. Descriptive data are presented as mean values and SDs or median with interquartile range [IQR 25–75]. Sex differences in pain report and questionnaire measures were compared with the Student t test or Mann–Whitney U test. As this cohort study aimed to recruit the maximum available subjects, no a priori power calculation was performed. To compare CPM between men and women with neuropathic pain and without pain and to compare differences between the subjects in the same group, a two-way analysis of variance (group and side) was performed. A post hoc unpaired t test was performed for between-group comparisons and also a post hoc paired t test for within-group comparisons. For AUCtime off and Time off, we estimated proportional odds models (cumulative probability models using the link function) including the following variables: group (pain, no pain), age, sex, VAS MAX c, and duration in the cold-water bath. To assess correlation between pain adaptability and pain modulation, Spearman rank correlation test (two-tailed) was used.
4. Results 4.1. Demographic details and subjects characteristicsDemographic details and the characteristics for the subjects are presented in Table 1. Fifty-four women (30 with neuropathic pain) and 77 men (39 with neuropathic pain) were recruited between December 2018 and March 2020. There were no age, BMI, or ASA physical status differences between groups. Only 4 subjects with chronic pain used opioids. Both women and men with neuropathic pain had the same types of nerve injuries localized to digital, radial, median, and ulnar nerves and also multiple nerve lesions (P = 0.698). The main mechanisms of injury in both women and men were sharp laceration (70%) followed by avulsion (30%). No differences were observed between the experimental groups of men and women with pain or painless neuropathy at bedside examination. No differences were observed in the physical and mental component of RAND-36 (P > 0.05), arm disability (P < 0.05) measured with QuickDASH, and anxiety or depression scores measured with the Hospital Anxiety and Depression Scale questionnaire (Table 1).
Table 1 - Sociodemographic and clinical characteristics of the subjects included in study. Female Male Group diff (F, M) NP (F) NP (M) Sex diff (NP) nP (F) nP (M) Sex diff (nP) Age (y) Median [IQR] 48 [24–63] 46 [25–67] 0.401 48 [20–60] 48 [22–64] 0.671 50 [25–60] 45 [24–54] 0.190 Gender Female/male (N, % from all subjects) 54 (41%) 77 (58%) 30 (22%) 39 (29%) 24 (18%) 38 (29%) Pain duration (y) Mean ± SD 4.3 ± 2.5 3.9 ± 2.7 0.327 3.2 ± 2.1 4.2 ± 2.7 0.136 4.5 ± 2.1 4.6 ± 2.2 0.135 BMI (kg/m2) Median [IQR] 26.1 [23–26] 27.3 [23–29] 0.397 25.2 [21–30] 25.5 [23–27] 0.816 25.3 [22–25] 27.1 [24–29] ASA (N, % from all subjects, %NP, % nP) 0.542 0.736 0.564 I 35 (26%) 45 (34%) 20 (28%) 22 (31%) 15 (24%) 23 (37%) II 15 (11%) 27 20%) 7 (10%) 15 (21%) 8 (12%) 12 (19%) III 4 (3%) 5 (3%) 3 (4%) 2 (2%) 1 (1%) 3 (4%) Pain medication (N, % from all subjects, %NP, %nP) 0.431 0.613 0.754 Opioids 2 (1%) 2 (1%) 2 (2%) 2 (2%) 0 0 Tricyclics/duloxetine 4 (3%) 2 (1%) 4 (5%) 1 (1%) 0 1 (1%) Gabapentinoids 4 (3%) 3 (2%) 4 (5%) 3 (4%) 0 0 Paracetamol 4 (3%) 4 (3%) 1 (1%) 3 (4%) 3 (4%) 1 (1%) COX inhibitors 5 (3%) 5 (3%) 2 (2%) 3 (4%) 3 (4%) 2 (3%) Employment (n) (N, % from all subjects, %NP, %nP) 0.854 0.746 0.467 Employed 46 (35%) 53 (40%) 19 (27%) 25 (36%) 17 (27%) 28 (45%) Retired 10 (7%) 14 (10%) 5 (7%) 6 (8%) 5 (8%) 8 (12%) Unable to work 7 (5%) 8 (6%) 6 (8%) 7 (10%) 1 (1%) 1 (1%) Other 1 (0.7%) 2 (1%) 1 (1%) 1 (1%) 0 1 (1%) Nerve injury (n) (N, % from all subjects, %NP, %nP) 0.662 0.608 0.440 Digital nerves (total, %from all subjects) injured digit site (ulnar, radial) 31 (23%) (14, 17) 42 (32%) (20,22) 0.092 17 (24%) (7,10) 20 (28%) (8, 12) 0.609 14 (22%) (10, 4) 22 (35%) (12, 10) 0.333 Median 9 (6%) 12 (9%) 5 (7%) 4 (5%) 4 (6%) 8 (12%) Ulnar 6 (4%) 5 (3%) 4 (5%) 3 (4%) 2 (3%) 2 (3%) Radial 3 (2%) 5 (3%) 1 (1%) 2 (2%) 2 (3%) 3 (4%) Multiple nerves 5 (3%) 13 (9%) 3 (4%) 13 (18%) 2 (3%) 0 Mechanism of injury Sharp laceration
留言 (0)