


記住我
Conceptualisation, G.P. and J.L.; methodology, G.P. and C.F.; software; validation, J.L. and A.W.K.Y.; formal analysis, J.L.; investigation, M.F.; data curation, G.P. and A.W.K.Y.; writing—original draft preparation, G.P. and J.L.; writing—review and editing, A.A.; visualisation, M.F.; supervision, G.P. All authors have read and agreed to the published version of the manuscript.
Figure 1. (A) Case example with a complete set of clinical periodontal record, periapical radiograph, and CBCT DICOM files as viewed on Romexis Viewer (Planmeca). (B) The CBCT viewer axis was first aligned along the long axis of the tooth at the sagittal section and coronal section. At the axial section, the sagittal and coronal planes were adjusted to intersect the canal orifices of the two roots bounding the concerned furcation involvement.
Figure 1. (A) Case example with a complete set of clinical periodontal record, periapical radiograph, and CBCT DICOM files as viewed on Romexis Viewer (Planmeca). (B) The CBCT viewer axis was first aligned along the long axis of the tooth at the sagittal section and coronal section. At the axial section, the sagittal and coronal planes were adjusted to intersect the canal orifices of the two roots bounding the concerned furcation involvement.
Figure 2. (A) Measurement of vertical depth of furcation and root length on Romexis (Planmeca). (B) By toggling the CBCT along the adjusted axis, the maximal vertical distance from the furcation fornix to the base of the defect and the length of the shorter root bounding the furcation were measured.
Figure 2. (A) Measurement of vertical depth of furcation and root length on Romexis (Planmeca). (B) By toggling the CBCT along the adjusted axis, the maximal vertical distance from the furcation fornix to the base of the defect and the length of the shorter root bounding the furcation were measured.
Figure 3. Measurement of vertical depth of furcation (A) and root length (B) on periapical radiograph using the measuring tool of Romexis (Planmeca).
Figure 3. Measurement of vertical depth of furcation (A) and root length (B) on periapical radiograph using the measuring tool of Romexis (Planmeca).
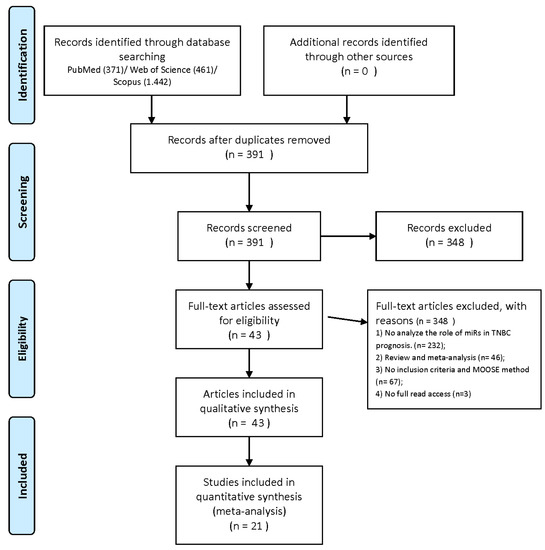
Table 1. Intraclass correlation coefficient (ICC) for vertical depth of furcation involvement measured by conventional modality against CBCT.
Table 1. Intraclass correlation coefficient (ICC) for vertical depth of furcation involvement measured by conventional modality against CBCT.
Level 1 Examiner12345All TeethTable 2. Linear weighted kappa for vertical furcation subclassification determined by conventional modality against CBCT.
Table 2. Linear weighted kappa for vertical furcation subclassification determined by conventional modality against CBCT.
Level 1 Examiner12345All TeethTable 3. Intraclass correlation coefficient (ICC) for assessment of reliability among the 15 examiners using the conventional modality in measuring vertical depth of furcation.
Table 3. Intraclass correlation coefficient (ICC) for assessment of reliability among the 15 examiners using the conventional modality in measuring vertical depth of furcation.
All TeethTable 4. The relationship between bias in vertical depth of furcation involvement measurement with tooth position, furcation involvement distribution, and examiner experience in the linear mixed model (unadjusted).
Table 4. The relationship between bias in vertical depth of furcation involvement measurement with tooth position, furcation involvement distribution, and examiner experience in the linear mixed model (unadjusted).
Parameter: Tooth PositionEstimate95% Confidence Intervalp-Value Lower BoundUpper BoundPairwiseTable 5. Descriptive statistics and one-way ANOVA comparing the vertical depth of furcation involvement in different furcation involvement distribution subgroups as measured on CBCT.
Table 5. Descriptive statistics and one-way ANOVA comparing the vertical depth of furcation involvement in different furcation involvement distribution subgroups as measured on CBCT.
NMean (mm)Std. DeviationMinimumMaximump-ValueFurcation Distribution <0.001Isolated maxillary buccal class II furcation involvement 44.54751.268003.066.10 Isolated maxillary mesial/distal class II furcation involvement82.56750.827941.583.81 At least two maxillary class II furcation involvements or class III furcation involvement83.64631.422691.616.19 Isolated mandibular buccal/lingual class II furcation involvement101.92500.571611.243.00 Mandibular buccal and lingual class II furcation involvement or class III furcation involvement103.14800.613872.084.13 Total402.96581.201151.246.19Table 6. The relationship between bias in vertical depth of furcation involvement measurement, furcation involvement distribution, and examiner experience level in the linear mixed model (adjusted for gold standard vertical depth of furcation involvement).
Table 6. The relationship between bias in vertical depth of furcation involvement measurement, furcation involvement distribution, and examiner experience level in the linear mixed model (adjusted for gold standard vertical depth of furcation involvement).
ParameterEstimate95% Confidence Interval Bonferroni Multiple ComparisonsLower
留言 (0)