


記住我
Conceptualisation, M.M.K.S. and F.A.; Data curation, M.M.K.S. and F.A.; Formal analysis, M.M.K.S. and F.A.; Investigation, M.M.K.S., F.A. and V.K.S.; Methodology, M.M.K.S., F.A. and V.K.S.; Literature review, M.A., V.K.S. and M.M.K.S.; Project administration, M.M.K.S., F.A. and V.K.S.; Resources, M.M.K.S. and E.E.; Software, M.M.K.S., F.A. and V.K.S.; Supervision, M.M.K.S., F.A., V.K.S. and E.E.; Validation, M.M.K.S. and F.A.; Visualisation, M.M.K.S., F.A. and V.K.S.; Writing—original draft, M.M.K.S., F.A., M.A., V.K.S. and R.Y.; Writing—review and editing, M.M.K.S., F.A., M.A., V.K.S. and R.Y. All authors have read and agreed to the published version of the manuscript.
Figure 1. Illustration of H&E-stained breast tumour patch examples extracted from the different magnifications of whole slide image (WSI). Note that (a) benign and (b) malignant correspond to the BN and ML, respectively. It contains four histological subtypes of benign breast tumours: adenosis (A), fibroadenoma (F), phyllodes tumour (PT), and tubular adenona (TA); and four malignant tumours (breast cancer): carcinoma (DC), lobular carcinoma (LC), mucinous carcinoma (MC), and papillary carcinoma (PC). These sub-categorized breast tumours are distinct in their visual, textural patterns and color features.
Figure 1. Illustration of H&E-stained breast tumour patch examples extracted from the different magnifications of whole slide image (WSI). Note that (a) benign and (b) malignant correspond to the BN and ML, respectively. It contains four histological subtypes of benign breast tumours: adenosis (A), fibroadenoma (F), phyllodes tumour (PT), and tubular adenona (TA); and four malignant tumours (breast cancer): carcinoma (DC), lobular carcinoma (LC), mucinous carcinoma (MC), and papillary carcinoma (PC). These sub-categorized breast tumours are distinct in their visual, textural patterns and color features.
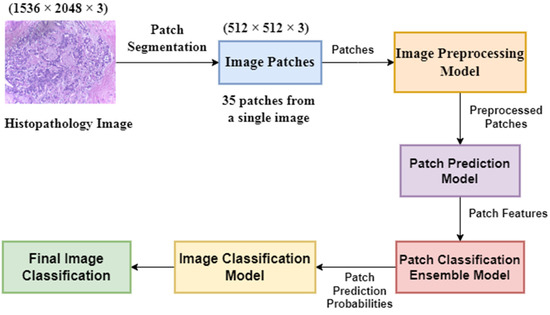
Figure 2. Overview of the proposed classification model.
Figure 2. Overview of the proposed classification model.
Figure 3. Illustration of the binary class classification performance achieved by the proposed model compared to the EfficientNetV2 network under multiple magnification settings.
Figure 3. Illustration of the binary class classification performance achieved by the proposed model compared to the EfficientNetV2 network under multiple magnification settings.
Figure 4. Illustration of the binary class confusion matrix obtained through the proposed model on the test set. Note that (a–d) refer to the 40×, 100×, 200×, and 400× magnifications, respectively.
Figure 4. Illustration of the binary class confusion matrix obtained through the proposed model on the test set. Note that (a–d) refer to the 40×, 100×, 200×, and 400× magnifications, respectively.
Figure 5. Illustration of the ROC curve obtained through the proposed model on the test set. Note that (a–d) refer to the 40×, 100×, 200×, and 400× magnifications, respectively.
Figure 5. Illustration of the ROC curve obtained through the proposed model on the test set. Note that (a–d) refer to the 40×, 100×, 200×, and 400× magnifications, respectively.
Figure 6. Illustration of the proposed model multi-class classification performance improvement respective to EfficientNetV2.
Figure 6. Illustration of the proposed model multi-class classification performance improvement respective to EfficientNetV2.
Figure 7. Illustration of multi-class confusion matrix obtained through the proposed model on the test set. Note that (a–d) refer to the 40×, 100×, 200×, and 400× magnifications, respectively.
Figure 7. Illustration of multi-class confusion matrix obtained through the proposed model on the test set. Note that (a–d) refer to the 40×, 100×, 200×, and 400× magnifications, respectively.
Figure 8. Illustration of the ROC curve of eight classes obtained through the proposed model on the test set. Note that (a–d) refer to the 40×, 100×, 200×, and 400× magnifications, respectively.
Figure 8. Illustration of the ROC curve of eight classes obtained through the proposed model on the test set. Note that (a–d) refer to the 40×, 100×, 200×, and 400× magnifications, respectively.
Figure 9. GradCam visualisation of the proposed model for H&E-stained breast tumour patch examples of benign (a,b) and malignant (c,d) classes.
Figure 9. GradCam visualisation of the proposed model for H&E-stained breast tumour patch examples of benign (a,b) and malignant (c,d) classes.
Table 1. A breakdown of the publicly available breast cancer classification BreakHis dataset. This dataset contains multiple image magnifications defined for benign and malignant categories.
Table 1. A breakdown of the publicly available breast cancer classification BreakHis dataset. This dataset contains multiple image magnifications defined for benign and malignant categories.
DatasetMagnificationBenignMalignantTotalBreakHis [12]40×65213701995100×64414372081200×62313902031400×58812321820Total of Images248054297909Table 2. Classification performance of the proposed model compared with three state-of-the-art diagnoses of breast cancer benign and malignant types in histopathology images. Note that ‘PR’ stands for ‘Precision’, ‘RE’ stands for ‘Recall’, and ‘F1’ represents the ‘F1-score’. The best significant result is highlighted in bold.
Table 2. Classification performance of the proposed model compared with three state-of-the-art diagnoses of breast cancer benign and malignant types in histopathology images. Note that ‘PR’ stands for ‘Precision’, ‘RE’ stands for ‘Recall’, and ‘F1’ represents the ‘F1-score’. The best significant result is highlighted in bold.
ModelsPerformance MetricsMagnifications40×100×200×400×PRREF1PRREF1PRREF1PRREF1ResNet1010.87610.83950.85430.83890.8360.83740.90520.91210.90850.84670.8370.8415InceptionResnetV20.97320.98110.9770.95610.96730.96140.98080.98490.98280.93290.9290.9309EfficientNetV20.98470.98050.98250.94020.93650.93830.99640.99210.99420.95140.96290.9568Proposed (EfficientNetV2 + DSE)0.98580.96830.97640.97400.97000.97200.99650.99210.99430.9960.99150.9937Table 3. Classification performance of the proposed model compared with three state-of-the-art models to diagnose eight types of benign and malignant breast cancer in histopathology images. The most significant results are highlighted in bold.
Table 3. Classification performance of the proposed model compared with three state-of-the-art models to diagnose eight types of benign and malignant breast cancer in histopathology images. The most significant results are highlighted in bold.
ModelsPerformance MetricsMagnifications40×100×200×400×PRREF1PRREF1PRREF1PRREF1ResNet1010.77430.78080.76980.74860.74630.73880.72550.68950.70520.79370.76650.7712InceptionResnetV20.86840.83360.84850.83850.83240.83190.77670.75820.76090.78350.69560.7229EfficientNetV20.89180.87270.8810.81760.84370.82910.79920.76910.78090.79370.76650.7712Proposed (EfficientNetV2 + DSE)0.96160.95820.95990.9440.94870.94590.89650.81330.84750.92750.92020.919
留言 (0)