IJERPH, Vol. 20, Pages 486: Association between Neighbourhood Deprivation Trajectories and Self-Perceived Health: Analysis of a Linked Survey and Health Administrative Data

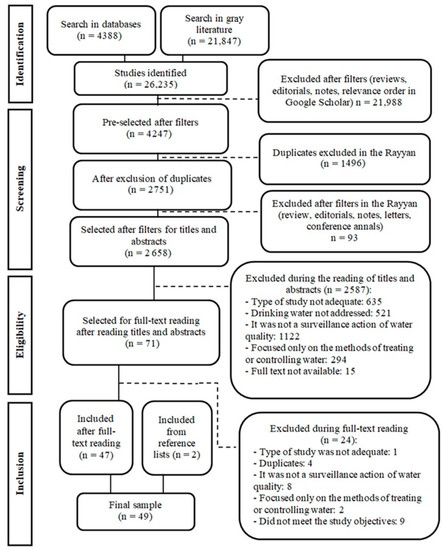
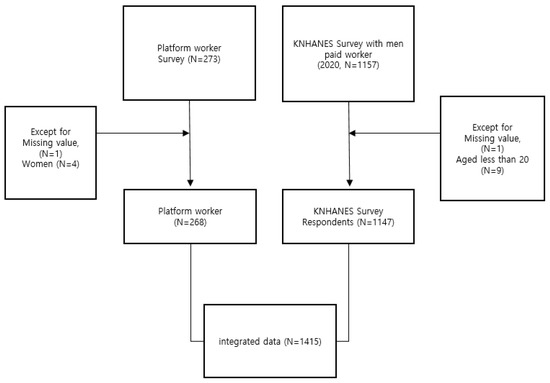
Figure 1. Exclusion flow chart of analytic sample.

Ijerph 20 00486 g001

Figure 2. Theoretical sequences of neighborhood deprivation trajectories based on the tercile of annual deprivation. Notes: Privileged (P), Medium (M), Deprived (D).

Ijerph 20 00486 g002

Figure 3. Predicted probability of poor SPH over neighbourhood deprivation trajectories (NDT) by age group (a) under 40 years, (b) 40–64 years, (c) over 65 years. Notes: predicted probability of SPH is shown on the y-axis and deprivation trajectories group is shown on the x-axis. Error bars on graphs indicate 95% confidence intervals. Privileged Stable (PS), Medium Upward (MU), Privileged Downward (PD), Deprived Upward Extreme (DUE), Privileged Downward Extreme (PDE), Medium Stable (MS), Deprived Upward (DU), Medium Downward (MD), Deprived Stable (DS).

Figure 3. Predicted probability of poor SPH over neighbourhood deprivation trajectories (NDT) by age group (a) under 40 years, (b) 40–64 years, (c) over 65 years. Notes: predicted probability of SPH is shown on the y-axis and deprivation trajectories group is shown on the x-axis. Error bars on graphs indicate 95% confidence intervals. Privileged Stable (PS), Medium Upward (MU), Privileged Downward (PD), Deprived Upward Extreme (DUE), Privileged Downward Extreme (PDE), Medium Stable (MS), Deprived Upward (DU), Medium Downward (MD), Deprived Stable (DS).

Ijerph 20 00486 g003aIjerph 20 00486 g003b

Table 1. Demographic characteristics of study sample (n = 45,990).

Table 1. Demographic characteristics of study sample (n = 45,990).

CharacteristicsFrequency (%) *Sex    Women51.1   Men48.9Age group, years    18–3933.1   40–6448,1   65+18.8Education level    No high school diploma18.9   High school diploma13.5   Post-secondary diploma48.6   University diploma18.9Household income quintile    Q1 (Low SES)9.3   Q220.9   Q320.0   Q416.9   Q5 (High SES)33.0Marital status    Married–Couple62.6   Widow–Separated–Divorced14.3   Single23.0Immigration status    Immigrant8.0   Non-immigrant92.0Survey cycle    2007–200833.3   2009–201033.7   2011–201233.0Life stress    None/low stress73.0   High stress27.0Comorbidity    090.5   ≥19.5Have a regular doctor    Yes77.8   No22.2Trajectory of neighbourhood deprivation    Privileged stable21.7   Medium upward10.4   Privileged downward12.1   Deprived upward extreme2.8   Privileged downward extreme2.6   Medium stable14.8   Deprived upward8.9   Medium downward11.2   Deprived stable15.5

Table 2. Bivariate associations between poor self-perceived health and independent variables.

Table 2. Bivariate associations between poor self-perceived health and independent variables.

VariablesPoor SPH *
(%)Unadjusted OR
(95% CI)p-ValueExposure Trajectory of neighbourhood deprivation    Privileged stable6.4 (5.7–7.2)1<0.001   Medium upward7.2 (6.2–8.3)1.13 (0.92–1.37)    Privileged downward9.1 (8.0–10.5)1.47 (1.22–1.76)    Deprived upward extreme7.8 (6.1–9.9)1.23 (0.92–1.64)    Privileged downward extreme11.6 (9.0–14.9)1.91 (1.37–2.67)    Medium stable9.9 (8.7–11.2)1.60 (1.34–1.91)    Deprived upward12.1 (10.8–13.6)2.01 (1.68–2.41)    Medium downward13.3 (11.9–14.8)2.24 (1.88–2.66)    Deprived stable16.4 (15.0–17.8)2.85 (2.44–3.34) Potential confounding Sex 0.58   Women10.5 (9.9–11.1)1    Men10.2 (9.6–10.9)0.97 (0.88–1.07) Age group, years <0.001   18–394.0 (3.6–4.6)1    40–6410.3 (9.6–11.0)2.71 (2.31–3.22)    65+21.6 (20.5–22.7)6.53 (5.67–7.50) Education level <0.001   No high school diploma22.7 (21.5–24.0)6.04 (4.95–7.38)    High school diploma10.4 (9.1–11.8)2.38 (1.90–2.99)    Post-secondary diploma7.7 (7.2–8.3)1.72 (1.41–2.10)    University diploma4.6 (3.9–5.5)1 Household income distribution quintile <0.001   Q1 (Low SES)26.3 (24.7–28.0)7.50 (6.24–9.00)    Q216.8 (15.7–18.1)4.25 (3.56–5.08)    Q39.2 (8.3–10.2)2.14 (1.78–2.58)    Q46.0 (5.3–6.9)1.35 (1.08–1.67)    Q5 (High SES)4.5 (3.9–5.3)1 Marital status <0.001   Married–Couple9.2 (8.7–9.8)1    Widow–Separated–Divorced18.8 (17.4–20.4)2.29 (2.03–2.57)    Single8.1 (7.4–8.9)0.87 (0.77–0.98) Immigration status <0.001   Immigrant9.9 (9.5–10.3)1.67 (1.37–2.02)    Non-immigrant15.5 (13.2–18.1)1 Survey cycle 0.58   2007–200810.4 (9.7–11.1)1    2009–201010.1 (9.4–10.7)0.97 (087–1.07    2011–201210.6 (9.8–11.4)1.02 (0.92–1.14) Life stress <0.001   None/low stress9.8 (9.3–10.4)1    High stress11.7 (10.8–12.6)1.21 (1.10–1.34) Comorbidity <0.001   07.9 (7.5–8.3)1    ≥133.6 (31.5–35.8)5.93 (5.31–6.61) Have a regular doctor <0.001   Yes11.8 (11.2–12.3)2.37 (2.04–2.76)    No5.3 (4.7–6.1)1

Table 3. Associations between long-term NDT and poor self-perceived health.

Table 3. Associations between long-term NDT and poor self-perceived health.

VariablesAdjusted OR
(95% CI)p-ValueExposure Trajectory of neighbourhood deprivation <0.001   Privileged stable1    Medium upward1.11 (0.89–1.37)    Privileged downward1.33 (1.09–1.63)    Deprived upward extreme1.27 (0.92–1.74)    Privileged downward extreme1.63 (1.14–2.32)    Medium stable1.24 (1.00–1.53)    Deprived upward1.50 (1.22–1.83)    Medium downward1.64 (1.35–2.00)    Deprived stable1.80 (1.50–2.16) Potential confounding Age group, years <0.001   18–391    40–642.25 (1.90–2.65)    65+2.93 (2.46–3.50) Education level <0.001   No high school diploma2.68 (2.14–3.36)    High school diploma1.71(1.33–2.20)    Post-secondary diploma1.39 (1.13–1.71)    University diploma1 Household income distribution quintile <0.001   Q1 (Low SES)3.61 (2.85–4.58)    Q22.27 (1.83–2.81)    Q31.56 (1.26–1.92)    Q41.12 (0.89–1.41)    Q5 (High SES)1 Marital status 0.15   Married–Couple1    Widow–Separated–Divorced1.08 (0.93–1.25)    Single1.15 (1.00–1.34) Immigration status <0.001   Immigrant1.52 (1.23–1.87)    Non-immigrant1 Life stress <0.001   None/low stress1    High stress2.07 (1.82–2.34) Comorbidity <0.001   01    ≥13.92 (3.45–4.46) Have a regular doctor <0.001   Yes1.54 (1.30–1.81)    No1

留言 (0)

沒有登入
gif