


記住我
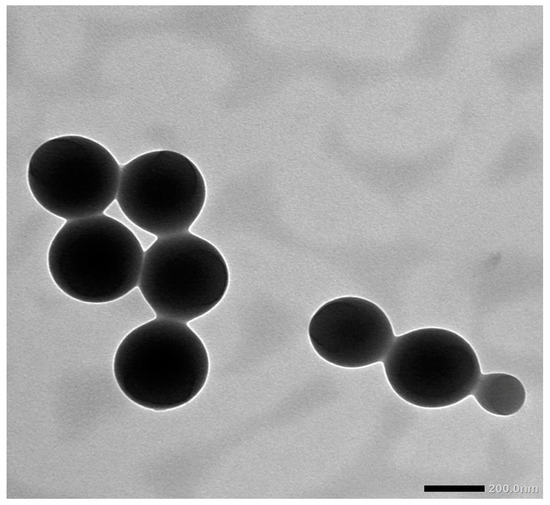
Figure 1. Transmission electron microscopy image of CAPE-PEG–PLGA NPs showing their particle size.
Figure 1. Transmission electron microscopy image of CAPE-PEG–PLGA NPs showing their particle size.
Figure 2. In vitro release of CAPE from CAPE-PEG–PLGA in phosphate-buffered saline (PBS) at 37 °C, pH 6.8 containing Tween 80 (0.5%) as a solubilizer.
Figure 2. In vitro release of CAPE from CAPE-PEG–PLGA in phosphate-buffered saline (PBS) at 37 °C, pH 6.8 containing Tween 80 (0.5%) as a solubilizer.
Figure 3. (A) Effects of CAPE-NPs on wound healing and % wound contraction on days 0,3,7,10, and 14. (B) Graphic presentation of wound contraction at day 14.Data are expressed as mean (n = 6) ± SD. (a) Significantly different from untreated control at p < 0.05, (b) significantly different from vehicle-treated control at p < 0.05, (c) significantly different from CAPE-raw at p < 0.05, and (d) significantly different from CAPE-NP at p < 0.05.
Figure 3. (A) Effects of CAPE-NPs on wound healing and % wound contraction on days 0,3,7,10, and 14. (B) Graphic presentation of wound contraction at day 14.Data are expressed as mean (n = 6) ± SD. (a) Significantly different from untreated control at p < 0.05, (b) significantly different from vehicle-treated control at p < 0.05, (c) significantly different from CAPE-raw at p < 0.05, and (d) significantly different from CAPE-NP at p < 0.05.
Figure 4. Effects of CAPE-NPs on skin histological changes. (A) H&E staining and (B) MT staining.
Figure 4. Effects of CAPE-NPs on skin histological changes. (A) H&E staining and (B) MT staining.
Figure 5. Effects of CAPE-NPs on oxidative status markers (A) MDA, (B) SOD, and (C) CAT. Data are expressed as mean (n = 6) ± SD. (a) Significantly different from untreated control at p < 0.05, (b) significantly different from vehicle-treated control at p < 0.05, (c) significantly different from CAPE-raw at p < 0 .05, and (d) significantly different from CAPE-NP at p < 0.05.
Figure 5. Effects of CAPE-NPs on oxidative status markers (A) MDA, (B) SOD, and (C) CAT. Data are expressed as mean (n = 6) ± SD. (a) Significantly different from untreated control at p < 0.05, (b) significantly different from vehicle-treated control at p < 0.05, (c) significantly different from CAPE-raw at p < 0 .05, and (d) significantly different from CAPE-NP at p < 0.05.
Figure 6. Effects of CAPE-NPs on the expression of (A) IL-6 and (B) TNF-α. Data are expressed as mean (n = 6) ± SD. (a) Significantly different from untreated control at p < 0.05, (b) significantly different from vehicle-treated control at p < 0.05, and (c) significantly different from CAPE-raw at p < 0 .05.
Figure 6. Effects of CAPE-NPs on the expression of (A) IL-6 and (B) TNF-α. Data are expressed as mean (n = 6) ± SD. (a) Significantly different from untreated control at p < 0.05, (b) significantly different from vehicle-treated control at p < 0.05, and (c) significantly different from CAPE-raw at p < 0 .05.
Figure 7. Effect of CAPE-NPs on skin content of hydroxyproline (A) and mRNA expression of Col 1A1 (B) in diabetic rat wounds on day 14. Data are expressed as mean (n = 6) ± SD. (a) Significantly different from untreated control at p < 0 .05, (b) significantly different from vehicle-treated control at p < 0.05, (c) significantly different from CAPE-raw at p < 0.05, and (d) significantly different from CAPE-NP at p < 0 .05.
Figure 7. Effect of CAPE-NPs on skin content of hydroxyproline (A) and mRNA expression of Col 1A1 (B) in diabetic rat wounds on day 14. Data are expressed as mean (n = 6) ± SD. (a) Significantly different from untreated control at p < 0 .05, (b) significantly different from vehicle-treated control at p < 0.05, (c) significantly different from CAPE-raw at p < 0.05, and (d) significantly different from CAPE-NP at p < 0 .05.
Figure 8. Effect of CAPE-NPs on TGF-β (upper row), and PDGF-B (lower row) expression in diabetic rat skin wounds on day 14. Data are expressed as mean (n = 6) ± SD. (a) Significantly different from untreated control at p < 0.05, (b) significantly different from vehicle-treated control at p < 0 .05, (c) significantly different from CAPE-raw at p < 0 .05, and (d) significantly different from CAPE-NP at p < 0 .05.
Figure 8. Effect of CAPE-NPs on TGF-β (upper row), and PDGF-B (lower row) expression in diabetic rat skin wounds on day 14. Data are expressed as mean (n = 6) ± SD. (a) Significantly different from untreated control at p < 0.05, (b) significantly different from vehicle-treated control at p < 0 .05, (c) significantly different from CAPE-raw at p < 0 .05, and (d) significantly different from CAPE-NP at p < 0 .05.
Table 1. The list of primers used for RT-qPCR.
Table 1. The list of primers used for RT-qPCR.
ForwardReverseAccession NumberCol1A1ATCAGCCCAAACCCCAAGGAGACGCAGGAAGGTCAGCTGGATAGNM_053304.1GAPDHCCATTCTTCCACCTTTGATGCTTGTTGCTGTAGCCATATTCATTGTNM_017008.4
留言 (0)