


記住我
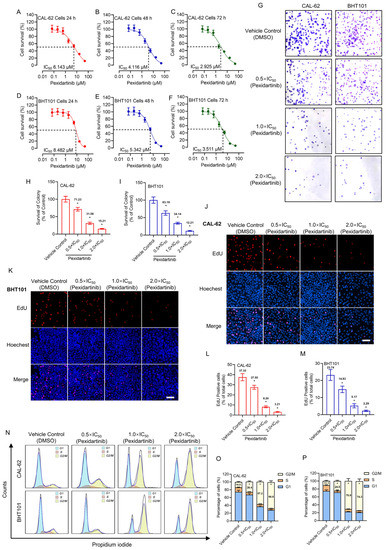
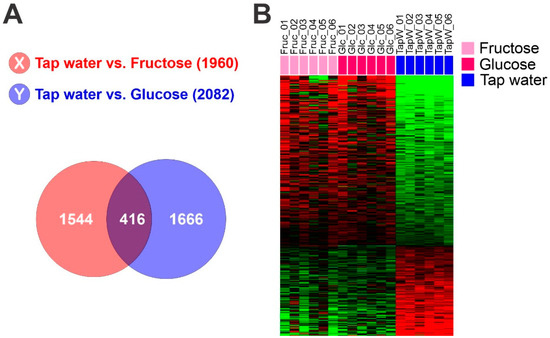
Figure 1. Hepatic glycolytic gene expression signature from mouse liver. (A) Venn diagram of genes selected by a two-sample t test. The red circle (gene list X) represents genes differentially expressed between liver tissues from mice fed with tap water and those fed with fructose water. The blue circle (gene list Y) represents genes differentially expressed between liver tissues of mice fed with tap water and those fed with glucose water. We applied a cut-off p-value of less than 0.01 to retain genes whose expression is significantly different between the two groups of tissues. (B) Expression patterns of selected genes in the Venn diagram. Gene expression data from livers of mice fed with fructose, glucose or control tap water were selected from 416 overlapping genes.
Figure 1. Hepatic glycolytic gene expression signature from mouse liver. (A) Venn diagram of genes selected by a two-sample t test. The red circle (gene list X) represents genes differentially expressed between liver tissues from mice fed with tap water and those fed with fructose water. The blue circle (gene list Y) represents genes differentially expressed between liver tissues of mice fed with tap water and those fed with glucose water. We applied a cut-off p-value of less than 0.01 to retain genes whose expression is significantly different between the two groups of tissues. (B) Expression patterns of selected genes in the Venn diagram. Gene expression data from livers of mice fed with fructose, glucose or control tap water were selected from 416 overlapping genes.
Figure 2. Clinical association of metabolic activity in hepatocellular carcinoma (HCC). (A) Schematic diagram of the prediction model. (B) Heatmap of glycolysis metabolic (GM) gene expression signature in patients from the Fudan cohort. (C) Kaplan–Meier plots of overall survival (OS) of HCC patients in the Fudan cohort stratified by GM subtype. TCGA, The Cancer Genome Atlas.
Figure 2. Clinical association of metabolic activity in hepatocellular carcinoma (HCC). (A) Schematic diagram of the prediction model. (B) Heatmap of glycolysis metabolic (GM) gene expression signature in patients from the Fudan cohort. (C) Kaplan–Meier plots of overall survival (OS) of HCC patients in the Fudan cohort stratified by GM subtype. TCGA, The Cancer Genome Atlas.
Figure 3. Validation of clinical association of low, middle, and high glycolysis metabolic subtypes in hepatocellular carcinoma. Kaplan–Meier plots of overall survival (OS) in patients in the validation cohorts. Zhongshan cohort (n = 159), Korea cohort (n = 188), The Cancer Genome Atlas (TCGA) cohort (n = 371), Modena cohort (n = 78), and pool of five cohorts (n = 1038).
Figure 3. Validation of clinical association of low, middle, and high glycolysis metabolic subtypes in hepatocellular carcinoma. Kaplan–Meier plots of overall survival (OS) in patients in the validation cohorts. Zhongshan cohort (n = 159), Korea cohort (n = 188), The Cancer Genome Atlas (TCGA) cohort (n = 371), Modena cohort (n = 78), and pool of five cohorts (n = 1038).
Figure 4. Genomic alterations in the glycolysis metabolic (GM) subtypes. (A) Bee swarm box plots for number of nonsynonymous mutations in GM subtypes (n = 367). No significant difference is observed among the GM subtypes. In the box plots, the boundary of the box indicates the 25th to 75th percentile, and the black line within the box marks the mean. Whiskers above and below the box indicate the 10th and 90th percentiles. Circles represent the number of mutations in each tumor. (B) The fraction of the genome altered by copy number gain and loss was estimated by GISTIC2 analysis in each tumor (n = 367). The high GM subtype has significantly higher alterations than the other two subtypes (all p < 0.05 by Student t test). (C) Somatic mutations associated with GM subtypes in TCGA cohort. Mutation rates of each gene are presented as fraction within subtypes. Red, light blue, and dark blue represent the high, middle, and low GM subtypes, respectively.
Figure 4. Genomic alterations in the glycolysis metabolic (GM) subtypes. (A) Bee swarm box plots for number of nonsynonymous mutations in GM subtypes (n = 367). No significant difference is observed among the GM subtypes. In the box plots, the boundary of the box indicates the 25th to 75th percentile, and the black line within the box marks the mean. Whiskers above and below the box indicate the 10th and 90th percentiles. Circles represent the number of mutations in each tumor. (B) The fraction of the genome altered by copy number gain and loss was estimated by GISTIC2 analysis in each tumor (n = 367). The high GM subtype has significantly higher alterations than the other two subtypes (all p < 0.05 by Student t test). (C) Somatic mutations associated with GM subtypes in TCGA cohort. Mutation rates of each gene are presented as fraction within subtypes. Red, light blue, and dark blue represent the high, middle, and low GM subtypes, respectively.
Figure 5. Immune characteristics of the glycolysis metabolic (GM) subtypes. (A) Waterfall plots for the response rates to immunotherapy predicted by the tumor immune dysfunction and exclusion (TIDE) algorithm in The Cancer Genome Atlas Liver Hepatocellular Carcinoma (TCGA-LIHC) cohort (n = 371). Numbers below waterfall plots represent the fraction of responders in the patients with each GM subtype. (B) Scatter plot for the correlation between TIDE score and GM probability in the TCGA cohort (n = 371). Blue line indicates locally weighted scatterplot smoothing (lowess) regression. (C) The pattern of infiltrations of 22 immune subsets according to GM subtype from fetal liver signatures predicted by the CIBERSORT algorithm in the TCGA cohort. (D,E) Box and scatter plots of fraction of regulatory T cells (Tregs) (D) and M0 macrophages (E) in GM subtypes. Relative fraction of each immune-subset was normalized by mean and standard deviation across the samples. In the scatter plots, blue line indicates locally weighted scatterplot smoothing (lowess) regression. In the box plots, the boundary of the box indicates the 25th to 75th percentile, and the black line within the box marks the mean. Whiskers above and below the box indicate the 10th and 90th percentiles. Each circle represents the fraction of indicated immune cells in each tumor. * p < 0.001 by Student t test.
Figure 5. Immune characteristics of the glycolysis metabolic (GM) subtypes. (A) Waterfall plots for the response rates to immunotherapy predicted by the tumor immune dysfunction and exclusion (TIDE) algorithm in The Cancer Genome Atlas Liver Hepatocellular Carcinoma (TCGA-LIHC) cohort (n = 371). Numbers below waterfall plots represent the fraction of responders in the patients with each GM subtype. (B) Scatter plot for the correlation between TIDE score and GM probability in the TCGA cohort (n = 371). Blue line indicates locally weighted scatterplot smoothing (lowess) regression. (C) The pattern of infiltrations of 22 immune subsets according to GM subtype from fetal liver signatures predicted by the CIBERSORT algorithm in the TCGA cohort. (D,E) Box and scatter plots of fraction of regulatory T cells (Tregs) (D) and M0 macrophages (E) in GM subtypes. Relative fraction of each immune-subset was normalized by mean and standard deviation across the samples. In the scatter plots, blue line indicates locally weighted scatterplot smoothing (lowess) regression. In the box plots, the boundary of the box indicates the 25th to 75th percentile, and the black line within the box marks the mean. Whiskers above and below the box indicate the 10th and 90th percentiles. Each circle represents the fraction of indicated immune cells in each tumor. * p < 0.001 by Student t test.
Figure 6. Stem cell characteristics of glycolysis metabolic (GM) subtypes. (A) Hepatic stem cell probability of hepatocellular carcinoma tumors in GM subtypes in The Cancer Genome Atlas (TCGA) cohort. In the box plots, the boundary of the box indicates the 25th to 75th percentile, and the black line within the box marks the mean. Whiskers above and below the box indicate the 10th and 90th percentiles. Each circle represents the fraction of the indicated immune cells in each tumor. Student t test. (B) Scatter plot for the correlation between hepatic stem cell probability and GM probability in the TCGA cohort (n = 371). (C) Heatmap for expression of major stem-cell markers according GM subtype in the TCGA cohort. (D) Box plots of expression of stem cell markers according to GM subtype in the TCGA cohort. * p < 0.001 by Student t test.
Figure 6. Stem cell characteristics of glycolysis metabolic (GM) subtypes. (A) Hepatic stem cell probability of hepatocellular carcinoma tumors in GM subtypes in The Cancer Genome Atlas (TCGA) cohort. In the box plots, the boundary of the box indicates the 25th to 75th percentile, and the black line within the box marks the mean. Whiskers above and below the box indicate the 10th and 90th percentiles. Each circle represents the fraction of the indicated immune cells in each tumor. Student t test. (B) Scatter plot for the correlation between hepatic stem cell probability and GM probability in the TCGA cohort (n = 371). (C) Heatmap for expression of major stem-cell markers according GM subtype in the TCGA cohort. (D) Box plots of expression of stem cell markers according to GM subtype in the TCGA cohort. * p < 0.001 by Student t test.
Table 1. Univariate and multivariate Cox regression analyses of overall survival in Zhongshan cohort.
Table 1. Univariate and multivariate Cox regression analyses of overall survival in Zhongshan cohort.
CharacteristicUnivariateMultivariateHazard Ratio (95% CI)p ValueHazard Ratio (95% CI)p ValuePatient sex (M or F)0.75 (0.4–1.41)0.381 Age (>60 years or not)0.8 (0.44–1.45)0.47 AFP (>300 ng/mL or not)3.12 (1.83–5.34)<0.0012.75 (1.53–4.91)<0.001Cirrhosis (yes or no)1.28 (0.69–2.35)0.42 Tumor size (>6 cm or not)3.53 (1.97–6.32)<0.0015.26 (1.86–14.8)0.001BCLC stage (B/C/D or 0/A)2.77 (1.51–5.09)0.0010.57 (0.23–1.4)0.23GM signature (high or mid/low)2.97 (1.72–5.12)<0.0011.84 (1.04–3.25)0.033
留言 (0)