JPM, Vol. 13, Pages 63: Early Hypocalcemia in Severe Trauma: An Independent Risk Factor for Coagulopathy and Massive Transfusion

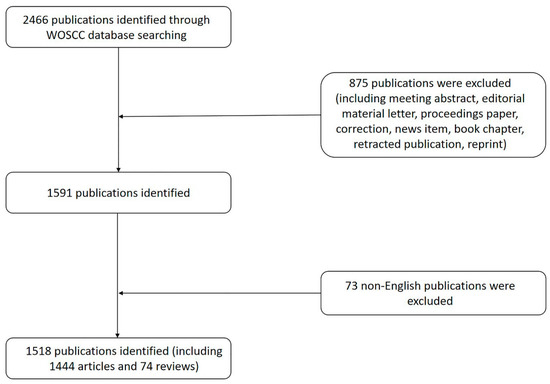
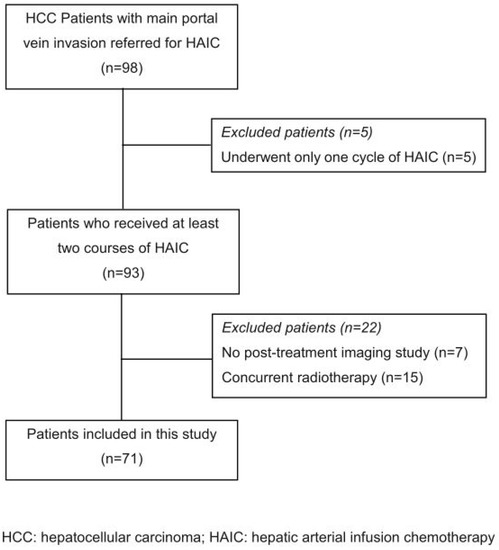
Figure 1. Patient enrollment.

Jpm 13 00063 g001

Figure 2. Linear regression: crystalloids infusions vs. ionized calcium. (R = 0.25, R2 = 0.065, p < 0.001).

Jpm 13 00063 g002

Figure 3. Kaplan–Meier Survival Rates. Hypocalcemic vs. Normocalcemic patients.

Jpm 13 00063 g003

Table 1. Clinical characteristics of the included patients. (n: number of patients, * p < 0.01, ** p < 0.001, bold: significant).

Table 1. Clinical characteristics of the included patients. (n: number of patients, * p < 0.01, ** p < 0.001, bold: significant).

Normocalcemia
n = 669Hypocalcemia
n = 129Total
n = 798Characteristics Age, yrs, mean +/− SD47 ± 2046 ± 2047 ± 20Male, n (%)502 (75)91 (71)593 (74)Female, n (%)167 (25)37 (29)204 (26)Blunt trauma, n (%)669 (100)128 (100)797 (100)Penetrating trauma, n (%)0 (0)0 (0)0 (0)Crush trauma, n (%)8 (1)0 (0) *8 (1)Isolated Head
or Spine trauma, n (%)152 (23)22 (17)174 (22)Alcohol intake, n (%)62 (15)
n = 40922 (27) **
n= 8087 (18)
n = 489Anticoagulant/
antiplatelet use, n(%)13 (2)
n = 6251 (1)
n = 12014 (2)
n = 745ISS, median (95% CI)26 (20–33)38 (28–50) *26 (21–36)Prehospital phase SAP, mmHg, mean ± SD127 ± 29
n = 661105 ± 36 *
n = 122123 ± 31
n = 783HR, beats/min, mean ± SD92 ± 25
n = 665100 ± 29 *
n = 12793 ± 26
n = 792SI, mean ± SD0.8 ± 0.3
n = 6611.1 ± 0.6 *
n = 1220.8 ± 0.4
n = 783Glasgow Coma Scale, median (95%CI)15 (12–15)
n = 66413 (6–15) *15 (11–15)
n = 792Cristalloids, mL, mean ± SD710 ± 456
n = 204985 ± 509 *
n = 56578 ± 450Colloids, mL, mean ± SD7 ± 66
n = 66247 ± 156 *
n = 12613 ± 88
n = 788Trauma center admission Hospital SAP, mmHg,
mean ± SD133 ± 28
n = 668114 ± 29 *
n = 124130 ± 29
n = 792Hospital HR, beats/min,
mean ± SD90 ± 23103 ± 26 *
n = 12592 ± 24Prehospital time, mins,
mean ± SD71 ± 23
n = 12977 ± 24
n = 2172 ± 23
n = 150Outcome Massive tansfusion, n (%)22 (3.3)33 (25.8) *55 (6.9)Multiple transfusions, n (%)83 (12.4)66 (51.6) *149 (18.7)pRBC, units, mean ± SD1.5 ± 3.37.5 ± 9.2*2.5 ± 5.4Observed death, n (%)18 (2.7)
n = 65916 (12.9) *
n = 12434 (4.3)
n = 783

Table 2. Biological characteristics of the 798 patients (n number of patients, * p < 0.01, bold: significant).

Table 2. Biological characteristics of the 798 patients (n number of patients, * p < 0.01, bold: significant).

Normocalcemia
n = 669Hypocalcemia
n = 129Ionized calcium, mmol/L, mean ± SD1.17 ± 0.05
n = 6671.03 ± 0.09 *Prothrombin time INR, mean ± SD1.12 ± 0.21
n = 5761.41 ± 0.4 *
n = 103aPTT ratio, mean ± SD0.88 ± 0.22
n = 5731.20 ± 0.63 *
n = 102Base Excess, mmol/L, mean ± SD−3.5 ± 3.9
n = 621−8.6 ± 9.8 *
n = 125Lactates, mmol/L, mean ± SD2.6 ± 1.6
n = 6634.3 ± 3.3 *
n = 127

Table 3. Independent association with massive transfusion (logistic multivariate analysis) (bold: significant).

Table 3. Independent association with massive transfusion (logistic multivariate analysis) (bold: significant).

OR (95% CI)p-ValueISS1.07 (1.04–1.10)<0.0001Lactates, mmol/L1.29 (1.13–1.48)<0.001Cristalloids, mL1.00 (1.00–1.00)0.003Hypocalcemia (Ionized calcium < 1.1 mmol/L)2.42 (1.13–5.16)0.02

Table 4. Independent association with hypocalcemia (logistic multivariate analysis) (bold: significant).

Table 4. Independent association with hypocalcemia (logistic multivariate analysis) (bold: significant).

OR (95% CI)p-ValueAlcohol intake2.32 (1.13–4.74)0.02INR > 1.59.47 (2.89–31.0)0.0002Cristalloids, mL1.00 (1.00–1.00)0.01ISS1.03 (1.00–1.06)0.03

留言 (0)

沒有登入
gif