


記住我
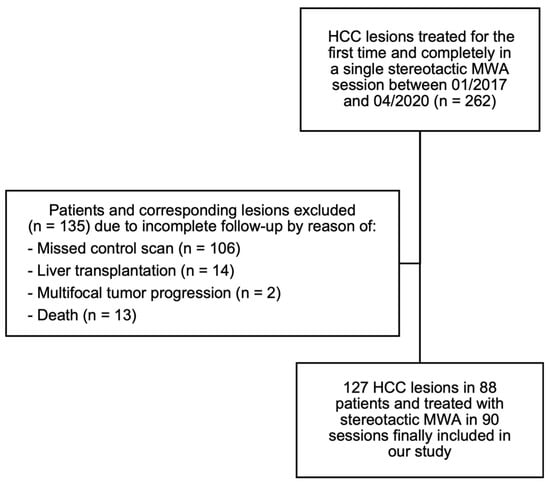


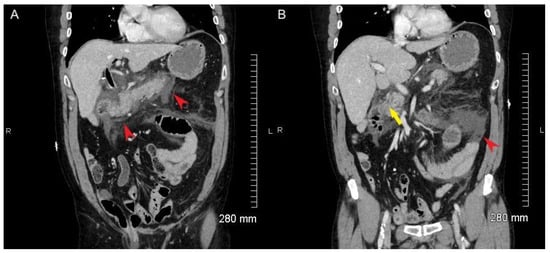


Figure 1. Flowchart of HCC lesion identification using in-/exclusion criteria for the final analysis of minimal ablative margin and maximum tumor diameter.
Figure 2. Example of minimal ablative margin assessment in MRI/CT scans of a 67-year-old man with HCC: (a) hepatic contrast-enhanced MRI (left: arterial phase, right: hepatobiliary phase) before MWA treatment; (b) contrast-enhanced planning CT scan (arterial phase) with pre-interventional measurements as performed in our study; (c) contrast-enhanced control CT scan (portal venous phase) after complete tumor ablation with postinterventional measurements; (d) contrast-enhanced follow-up MRI (left: arterial phase; right: hepatobiliary phase) 6 months after MWA with no evidence for local tumor progression.
Figure 3. Kaplan–Meier curves for visualizing the probability of LTP free survival (a) and OS over time (b).
Table 1. Characteristics of 88 patients with a total of 127 HCC lesions treated with stereotactic MWA.
Table 1. Characteristics of 88 patients with a total of 127 HCC lesions treated with stereotactic MWA.
CharacteristicsValuePatients (n in total)88Female, n (%) 6 (6.7)Male, n (%)84 (93.3)Age in years (range)65 (9.3 (43–95)Child-Pugh score, n (%) Child A67 (76.1)Child B21 (23.9)BCLC-Classification, n (%) BCLC 0 and A55 (62.5)BCLC B29 (33.0)BCLC C4 (4.5)Table 2. Characteristics of 127 HCC lesions ablated with stereotactic MWA in 88 patients and 90 sessions.
Table 2. Characteristics of 127 HCC lesions ablated with stereotactic MWA in 88 patients and 90 sessions.
CharacteristicsValueHCC lesions ablated per patient, n (%) 161 (67.8)221 (23.3)38 (8.9)Mean maximum tumor diameter in mm (range)19.9 ± 10.3 (6–53)Complications Minor (Grade 1 and 2)11 (12.2)Major (Grade 3 to 6)1 (1.1)Tumor size subdivisions, n (%) <30 mm 104 (81.9)30–50 mm 22 (17.3)>50 mm1 (0.8)Mean MAM in mm (range)4.2 ± 4.2 (0–24)Mean follow-up period in months25.8 ± 11.6Mean time to LTP in months12.6 ± 11.4Mean LTP rate (%) Per session41.1Per ablated HCC31.0OS rates (%) 1 st year 98.42 nd year943 rd year90.8
留言 (0)