

記住我
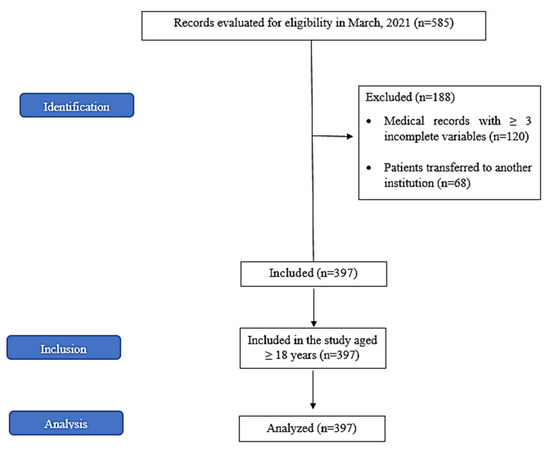
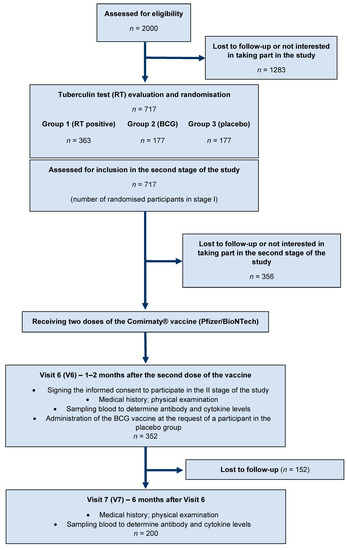
Figure 1. Flow chart of the study design.
Table 1. Baseline characteristics of cases and controls.
Table 1. Baseline characteristics of cases and controls.
ParameterTotalControlsCasesp-Value(n = 782)(n = 714)(n = 68)n%n%n%Age, years0.0218–≤4011515112163441–<6544857400564871≥6521928202281725Mean ± SD57 ± 1557 ± 1562 ± 14Gender0.36Male50164454644769Female28136260362131Race0.22Asian68187625885682Non-Asian1011389121218Duration of dialysis0.03<1 year21427203281116≥1 year56873511725784Comorbidities Hypertension771997059966970.39Diabetes518664716647690.60Cerebrovascular disease72962910150.10Malignancy354294690.07COPD365335340.94Liver disease395345570.36Number of comorbidities0.651–294128712710≥368888627886190Vaccination status<0.0001Pfizer (BNT162b2)64082607853349mRNA-1273 (Moderna)759711046Not vaccinated6793653146Symptomatic<0.0001Yes18524148213754No59776566793146Table 2. Vaccine effectiveness against infection in hemodialysis patients.
Table 2. Vaccine effectiveness against infection in hemodialysis patients.
Vaccine TypeCasesControlsAdjusted(95% CI)(n = 68)(n = 714)VE *, %One DoseModerna22<0(<0–92.1)Pfizer11391.1(32.7–99.8)Overall31576.8(5.5–96.0)<14 Days after the Second DoseModerna11<0(<0–98.9)Pfizer31<0(<0–99.5)Overall42<0(<0–96.3)>14 Days after the Second DoseModerna16898.2(88.6–99.9)Pfizer2959394.3(89.0–97.0)Overall3066194.7(89.9–97.2)Unvaccinated65223ReferenceReference
留言 (0)