
記住我


Alzheimer disease and related dementia (ADRD) is considered one of the most expensive health conditions, with total payments estimated at $305 billion in 2020 and projected costs estimated to reach $1.1 trillion in 2050.1 More than 5.5 million Americans suffer from ADRD. This number is expected to reach 14 million Americans by 2060. Black older adults (65 years and older) are about twice as likely, and Hispanic older adults are about 1.5 times as likely to have dementia than White older adults.2–4 Conditions such as cardiovascular disease and diabetes, which increase the risk of developing ADRD, contribute to the high prevalence of ADRD among racial and ethnic minority groups.5,6
Evidence suggests that racial and ethnic minority groups are more likely to have later-stage diagnoses, experience delays in timely primary care, and lack access to coordinated care.7 Among Medicare beneficiaries with ADRD, Black patients had the highest Medicare payments, with a total average annual payment of $29,934 per person; Hispanic patients averaged a total annual payment of $23,725 per person and White patients averaged a total annual payment of $22,135 per person in 2020.8 Understanding these cost disparities is a critical step to achieving the Triple Aim of Health Care (ie, improving care and health while lowering cost), and finding approaches that address these cost disparities are important for equity research.
Care coordination strategies can improve the quality of care and quality of life for patients with ADRD.9–11 Care coordination can be successfully achieved by leveraging health information technology (HIT) systems that encompass efficient electronic data sharing,12–15 health information exchanges (HIEs),16,17 and automatic notifications regarding care transitions.18–20 For example, evidence has suggested that automatic notifications of ED visits, inpatient admissions, and discharges to primary care providers could reduce the risk of readmissions among Medicare fee-for-service (FFS) beneficiaries and encourage timely follow-ups.20 A recent study suggested that patients with ADRD treated in hospitals that utilized HIT care coordination and patient engagement services reported lower rates of preventable ED visits.21
While HIT can improve efficiency, Black and Hispanic patients with ADRD have less access to HIT-integrated health care systems compared with their Non-Hispanic White counterparts.22,23 A recent study delineated a conceptual framework for racial and ethnic disparities in ADRD care and discussed how the HIT-supported care coordination model could reduce structural racism and discrimination (eg, racial residential segregation and structural barriers in health care) for patients with ADRD.24 Building on that model, this present study provided empirical evidence on the association between the HIT infrastructure and racial and ethnic disparities in health care costs among patients with ADRD.
In particular, the study examined the association between hospital-based HIT infrastructure with Medicare payments among patients with ADRD by race and ethnicity. We hypothesized that HIT infrastructures promoting care coordination might reduce Medicare payment, especially for Black and Hispanic patients with ADRD. For instance, improved HIT-supported services can improve care coordination, identify patient needs and cultural preferences, and thus reduce overall costs for racial and ethnic minority groups. We expect that results can be helpful for future evaluations of telehealth capacity-building efforts that aim to improve HIT investment and designs for racial and ethnic minority aging populations.
METHODS DataWe used the linked data sets of the 2017 Centers for Medicare and Medicaid Services (CMS) Medicare 100% inpatient claims data and Medicare Beneficiary Summary File. These data were further linked with the American Hospital Association (AHA) Annual Survey to obtain the hospital characteristics and hospital-based HIT measures.25 Finally, we linked the American Community Survey and the Area Health Resource File to capture zip-code and county-level measures that were commonly used in the literature.
Our study focused on community-dwelling Medicare FFS beneficiaries with a diagnosis of ADRD aged 65 and older and who had at least 1 hospital visit in 2017. Elderly patients with Medicare Advantage or Medicare and Medicaid dual-eligible patients were not included. We used the definition of ADRD reported by the CMS chronic conditions data warehouse codes.26 We focused on non-Hispanic White (White), Black, and Hispanic patients with ADRD.
Outcome MeasuresTo be consistent with the literature, we employed the Medicare payment measures used in the 2021 Medicare payment Alzheimer disease facts and figures special report, Race, Ethnicity, and Alzheimer in America.8 Outcome measures were obtained from the Medicare Beneficiary Summary Cost and Use file. We used the “acute inpatient Medicare payments” to estimate its variation and association with hospital-based HIT. We created a “total Medicare payments per person per year” variable as the summation of Medicare payments on major services, including acute inpatient, other inpatient hospital, skilled nursing facility, hospice, home health, hospital outpatient, ambulatory surgery center, anesthesia, Part B drug, evaluation and management, Part B physician, other procedure, imaging, test, other Part B carrier, and Part D Medicare payments.
Key Independent VariablesHospital-based HIT measures were obtained in the Facilities and Services section of the AHA Annual Survey. Seven measures were included: telehealth consultation and office visits; eICU; telehealth stroke care; telehealth psychiatric and addiction treatment; telehealth remote patient monitoring postdischarge, and telehealth remote patient monitoring ongoing chronic care management. Hospital-based HIT was grouped into 2 categories: (1) the telehealth-postdischarge group, which included the services of the remote patient monitoring postdischarge, or the remote patient monitoring ongoing chronic care management; (2) the telehealth-treatment group, which included services that supported telehealth consultation and office visits, eICU, stroke care, or psychiatric and addiction treatment.
In the sensitivity analysis, we tested different measures of telehealth indices. In the appendix, we presented results using: (1) the total number of telehealth services adopted by the hospital, (2) any telehealth services adopted, and (3) the cross-tabulation of telehealth-postdischarge and telehealth-treatment services. Results were similar (Appendix 1, Supplemental Digital Content 1, https://links.lww.com/MLR/C547).
Other Independent VariablesOther independent variables at the beneficiary level included race/ethnicity, age, sex, and health. We used the Research Triangle Institute Race Code for Non-Hispanic White, Non-Hispanic Black, and Hispanic. Health indicators included were those considered as common co-existing chronic conditions of ADRD8: acute myocardial infarction; asthma; atrial fibrillation; heart failure; chronic obstructive pulmonary disease (COPD); depression; diabetes; hyperlipidemia; and hypertension. Diagnoses of these diseases were also obtained from the CMS chronic conditions data warehouse codes.26 Covariates at the hospital level included teaching status, type of controls, and bed size. Area-level variables included rurality indices indicating 3 categories: rural, micropolitan, and metropolitan area. In addition, we included high school education; poverty as the percentage of people at the poverty level by the zip code; the proportion of Black people (divided by the total population) in that zip code using the ACS 5-year (2011–2015) average data; and rates of physicians per 1,000 residents at the county-level.
In the sensitivity analysis, we tested the model with different geographic specifications. We used the Area Deprivation Index (ADI), which allowed for “rankings of neighborhoods by socioeconomic disadvantage in a region of interest” (eg, at the state or national level). ADI is a composite measure that includes population-level factors across the domains of income, education, employment, and housing quality which can be used to inform health delivery and policy, especially for the most “disadvantaged neighborhoods.”27 We categorized beneficiaries’ resident areas into 3 groups: ADI below the 25th percentile (the best), the 25th–75th percentile, and the 75th percentile (the most disadvantaged areas). Results were similar (see Appendix 2, Supplemental Digital Content 1, https://links.lww.com/MLR/C547).
AnalysisOur unit of analysis was at the beneficiary-hospital level. Approximately 70% of beneficiaries visited the same hospital, 22% were admitted in 2 hospitals, 6% were admitted in 3 hospitals, and 2% were admitted in more than 3 hospitals. We created beneficiary-hospital level data to account for situations when beneficiaries visited multiple hospitals, and we adjusted for the number of visits in the regression analyses.
We first presented the likelihood of being treated in hospitals with telehealth-postdischarge and telehealth-treatment services for patients with ADRD by race and ethnicity. We then presented and compared beneficiary, hospital, and geographic characteristics. Given the skewed distributions of the payments, generalized linear models with log link and gamma distributions were used to estimate the association between telehealth measures and Medicare payments.28–30 Interaction terms between race and ethnicity (Blacks and Hispanics) and telehealth-postdischarge and telehealth-treatment services were included in the regressions to test the different associations by race and ethnicity. We then reported the marginal effects of telehealth-postdischarge and telehealth-treatment services for each race and ethnicity group. Medicare reimbursement models vary by state policies (eg, the State of Maryland uses the global budget review model, now called the total cost of care model, for hospital reimbursement). Hence, state-fixed effects were applied to all the regressions. In the sensitivity analysis, we also presented the results of clustered standard errors to help account for heterogeneity. Results were similar (see Appendix 3, Supplemental Digital Content 1, https://links.lww.com/MLR/C547).
RESULTSCompared with non-Hispanic White patients, Black patients with ADRD were less likely to be treated in hospitals with telehealth-postdischarge services but were more likely to be treated in hospitals with telehealth-treatment services (Fig. 1). Hispanic patients with ADRD were more likely to be treated in hospitals with telehealth-treatment services, and the likelihood of being treated in hospitals with telehealth-postdischarge services was similar to that of White patients.
 FIGURE 1:
 Probability of being served in hospitals with telehealth infrastructure among Medicare fee-for-service beneficiaries with Alzheimer disease and related dementia by race and ethnicity. This study focused on community-dwelling Medicare fee-for-service beneficiaries who had a diagnosis of Alzheimer disease and related dementias (ADRD) that were aged 65 and older and had at least one hospital visit in 2017. Elderly with Medicare Advantage or dual eligibilities were not included. ADRD was defined using the Centers for Medicare and Medicaid Services (CMS) chronic conditions data warehouse codes. Non-Hispanic White (White), Black, and Hispanic patients with ADRD are reported where non-Hispanic Whites were used as the reference group.
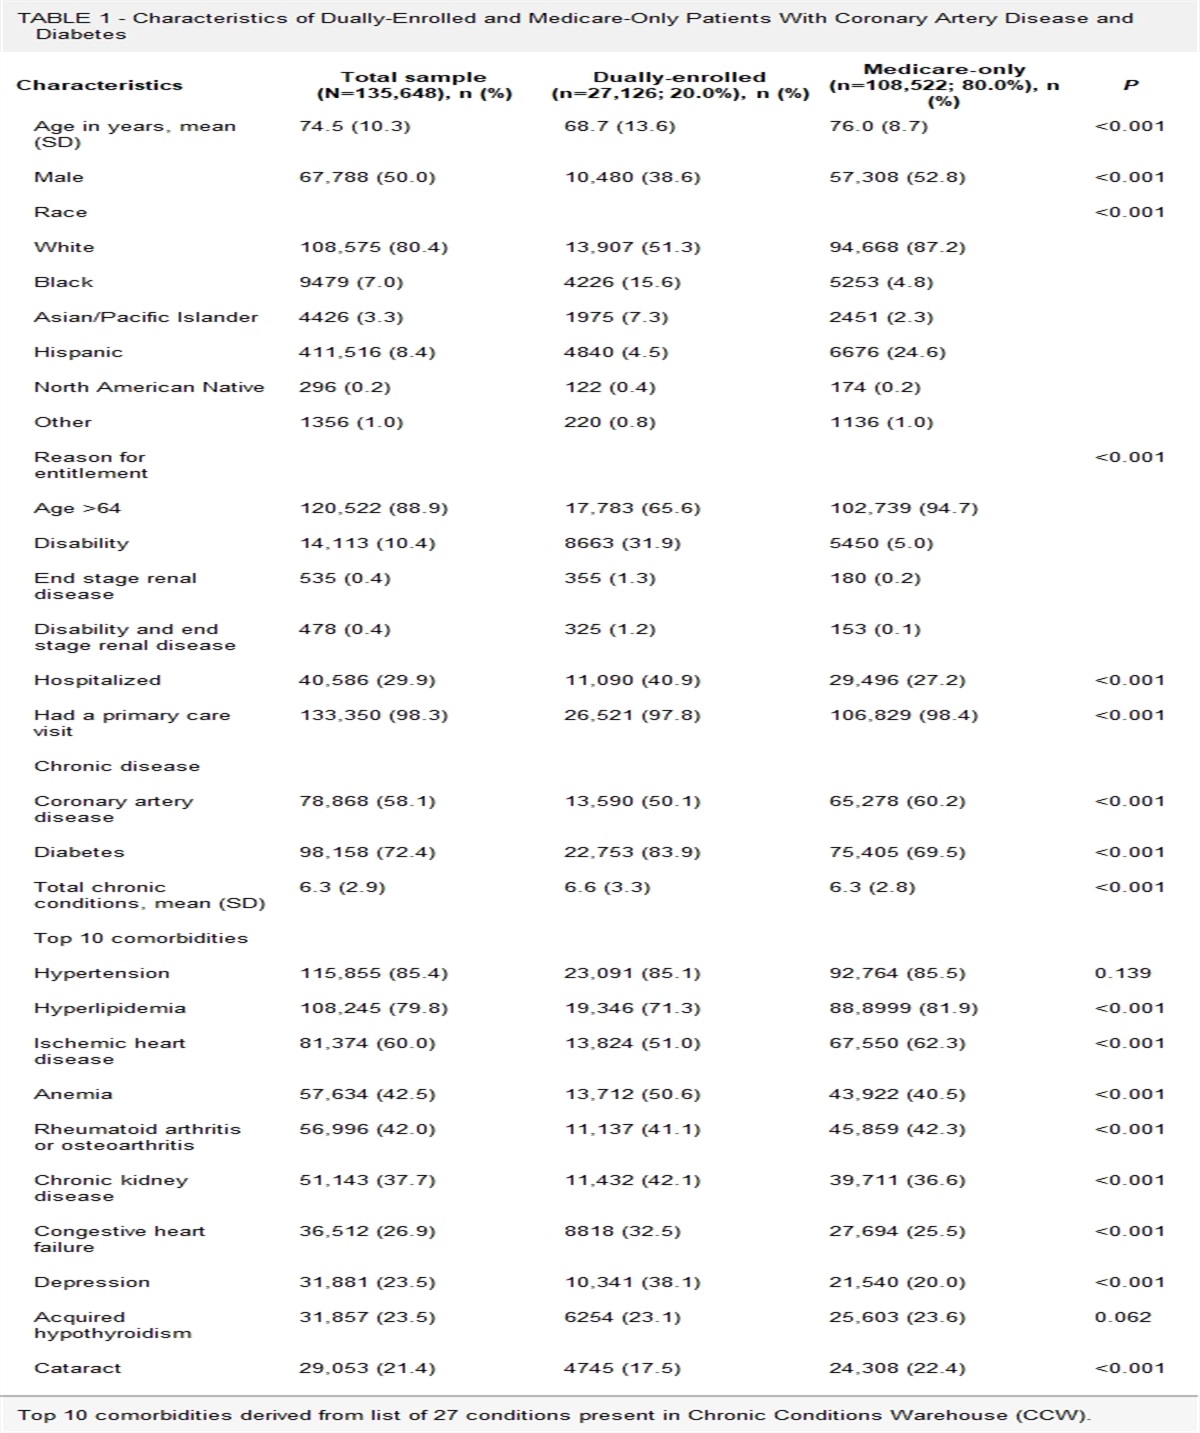
Table 1 presents the total Medicare and acute inpatient Medicare payment per person per year by race and ethnicity according to whether hospitals had HIT infrastructures. Results showed that the payments were significantly higher among White patients with ADRD who were treated in hospitals with telehealth-postdischarge or telehealth-treatment services. However, the total Medicare payment was significantly lower among Black patients with ADRD who were treated in hospitals with telehealth postdischarge or telehealth-treatment services. Acute inpatient Medicare payments were slightly higher among Black patients with ADRD who were treated in hospitals with telehealth-treatment services and Hispanic patients with ADRD who were treated in hospitals with telehealth postdischarge services.
TABLE 1 - Medicare Payments by Race and Ethnicity and Hospital Provision of Telehealth-Postdischarge and Telehealth-Treatment Services Telehealth-Postdischarge Services YES NO WHITE N=33,507 N=263,434 Mean 95% CI Mean 95% CI P Total Medicare payment per person per year $38,417.06 $37,978.86 $38,855.26 $36,416.49 $36,276.78 $36,556.19 <0.001 Acute inpatient Medicare payment $18,231.74 $17,950.77 $18,512.70 $15,552.21 $15,469.62 $15,634.81 <0.001 BLACK N=2,642 N=25,034 Mean 95% CI Mean 95% CI P Total Medicare payment per person per year $38,321.18 $36,610.24 $40,032.12 $40,944.06 $40,395.67 $41,492.46 <0.001 Acute inpatient Medicare payment $18,700.76 $17,524.88 $19,876.63 $18,030.08 $17,696.51 $18,363.65 0.23 HISPANIC N=1,308 N= 10,470 Mean 95% CI Mean 95% CI P Total Medicare payment per person per year $41,570.97 $39,072.50 $44,069.44 $42,696.93 $41,857.53 $43,536.33 0.38 Acute inpatient Medicare payment $20,555.89 $18,828.87 $22,282.91 $18,413.68 $17,932.72 $18,894.65 <0.001 Telehealth-Treatment Services YES NO WHITE N=14,109 N=282,832 Mean 95% CI Mean 95% CI P Total Medicare payment per person per year $38,752.57 $38,061.25 $39,443.90 $36,536.96 $36,401.16 $36,672.75 <0.001 Acute inpatient Medicare payment $18,609.10 $18,153.64 $19,064.57 $15,717.17 $15,636.46 $15,797.89 <0.001 BLACK N=1,411 N=26,265 Mean 95% CI Mean 95% CI P Total Medicare payment per person per year $37,735.00 $35,193.67 $40,276.33 $40,852.62 $40,319.51 $41,385.74 <0.001 Acute inpatient Medicare payment $19,485.57 $17,519.80 $21,451.34 $18,019.35 $17,696.99 $18,341.72 0.05 HISPANIC N=658 N=11,120 Mean 95% CI Mean 95% CI P Total Medicare payment per person per year $38,708.45 $35,481.88 $41,935.02 $42,800.50 $41,979.38 $43,621.62 0.38 Acute inpatient Medicare payment $19,029.72 $16,611.01 $21,448.43 $18,629.25 $18,153.83 $19,104.67 0.70Our study focused on community-dwelling Medicare fee-for-service beneficiaries who had a diagnosis of Alzheimer disease and related dementias (ADRD) aged 65 and older and who had at least 1 hospital visit in 2017. Elderly with Medicare Advantage or dual eligibilities were not included. We used the definition of ADRD reported by the Centers for Medicare and Medicaid Services (CMS) chronic conditions data warehouse codes. We focused on Non-Hispanic White (White), Black, and Hispanic patients with ADRD. Whites were used as the reference group.
Summaries of beneficiary, hospital, and community-level characteristics are presented in Table 2. Compared with White patients, Black and Hispanic patients with ADRD had significantly higher acute inpatient Medicare payments and total Medicare payments per person per year. Black and Hispanic patients, on average, were younger. Rates of co-existing ADRD comorbidities varied by race and ethnicity. Compared with White patients, Black patients were more likely to have asthma, heart failure, diabetes, hyperlipidemia, and hypertension, and less likely to have depression and COPD; Hispanic patients were also more likely to have diabetes and hypertension. Compared with White patients, Black and Hispanic patients with ADRD were more likely to live in areas with high poverty rates and low education levels.
TABLE 2 - Characteristics of Medicare Fee-For-Service Beneficiaries With Alzheimer Disease and Related Dementias Aged 65 and Older White Black Hispanic N=296,941 N=27,676 N=11,778 Mean SD Mean SD P Mean SD P Total Medicare payment per person per year ($) 36,642.23 37,105.35 40,693.68 44,329.79 <0.001 42,571.89 44,071.37 <0.001 Acute inpatient Medicare payment ($) 15,854.6 22,212.38 18,094.12 27,319.92 <0.001 18,651.63 25,945.82 <0.001 Age (100%) Age 65–74 year 0.22 0.41 0.31 0.46 <0.001 0.28 0.45 <0.001 Age 75–84 year 0.39 0.49 0.39 0.49 0.71 0.39 0.49 0.78 Age 85 y and over 0.40 0.49 0.31 0.46 <0.001 0.33 0.47 <0.001 Female (100%) 0.56 0.50 0.56 0.50 0.18 0.53 0.50 <0.001 Co-comorbidities (100%) Depression 0.42 0.49 0.29 0.45 <0.001 0.40 0.49 <0.001 Acute myocardial infarction 0.05 0.22 0.05 0.22 0.82 0.05 0.23 0.44 Asthma 0.09 0.29 0.11 0.31 <0.001 0.11 0.31 <0.001 Heart failure 0.44 0.50 0.48 0.50 <0.001 0.44 0.50 0.81 Chronic obstructive pulmonary disease 0.31 0.46 0.27 0.44 <0.001 0.25 0.43 <0.001 Diabetes 0.38 0.48 0.57 0.50 <0.001 0.57 0.49 <0.001 Hyperlipidemia 0.74 0.44 0.73 0.44 0.013 074 0.44 0.31 Hypertension 0.91 0.29 0.96 0.19 <0.001 0.93 0.26 <0.001 Teaching hospital 0.18 0.38 0.28 0.45 <0.001 0.19 0.39 0.05 Hospital control (100%) For-profit hospitals 0.12 0.33 0.13 0.34 <0.001 0.25 0.43 <0.001 Non-profit hospitals 0.77 0.42 0.75 0.43 <0.001 0.65 0.48 <0.001 Government hospitals 0.10 0.30 0.11 0.32 <0.001 0.11 0.31 0.37 Bed size (100%) Bed size<200 0.31 0.46 0.21 0.41 <0.001 0.25 0.57 <0.001 Bed size ≥200 0.69 0.46 0.79 0.41 <0.001 0.75 0.43 <0.001 Urban/rural location (100%) Rural area 0.03 0.18 0.02 0.13 <0.001 0.01 0.10 <0.001 Micropolitan area 0.17 0.38 0.08 0.28 <0.001 0.09 0.29 <0.001 Metropolitan area 0.79 0.40 0.90 0.30 <0.001 0.90 0.30 <0.001 100% Black population in the community above 50% of the population median 0.46 0.50 0.94 0.25 <0.001 0.49 0.50 <0.001 100% Population with high school degrees in the community above 50% of the population median 0.53 0.50 0.26 0.44 <0.001 0.29 0.45 <0.001 100% Population living in poverty in the community above 50% of the population median 0.48 0.50 0.76 0.43 <0.001 0.67 0.47 <0.001 100% Physicians per 1,000 residents in the community above 50% of the population median 0.49 0.50 0.54 0.50 <0.001 0.50 0.50 0.25Data source: the linked data sets of 2017 Centers for Medicare and Medicaid Services (CMS) Medicare 100% inpatient claims data, Medicare Beneficiary Summary File, American Hospital Annual Survey, American Community Survey, and the Area Health Resource File.
This study focused on community-dwelling Medicare fee-for-service beneficiaries who had a diagnosis of Alzheimer disease and related dementias (ADRD) that were aged 65 and older and had at least one hospital visit in 2017. Elderly with Medicare Advantage or dual eligibilities were not included. ADRD was defined using the CMS chronic conditions data warehouse codes. Non-Hispanic White (White), Black, and Hispanic patients with ADRD are reported where non-Hispanic Whites were used as the reference group.
Percentages are commonly rounded; as a result, the sum of the values may not always add to 100%.
After controlling for beneficiary, hospital, and area-level characteristics, results showed that telehealth postdischarge services were significantly associated with higher total Medicare payment (coefficient=0.034, P value<0.001) and acute inpatient Medicare payment (coefficient=0.048, P value<0.001) (Table 3). Telehealth-treatment services were associated with higher total Medicare payments (coefficient=0.007, P value=0.34) and acute inpatient Medicare payments (coefficient=0.01, P value=0.24), but these findings were not statistically significant. Black and Hispanic patients with ADRD had higher total Medicare payments and acute inpatient Medicare payments compared with Whites.
TABLE 3 - Associations Between Telehealth-Postdischarge and Telehealth-Treatment Services With Total Medicare Payments and Acute Inpatient Medicare Payments Total Medicare Payment Acute Inpatient Medicare Payment Coefficient 95% CI P Coefficient 95% CI P Telehealth-postdischarge services 0.034 0.024 0.045 <0.001 0.048 0.035 0.061 <0.001 Telehealth-treatment services 0.007 −0.008 0.023 0.343 0.011 −0.007 0.029 0.242 Black 0.036 0.024 0.048
留言 (0)