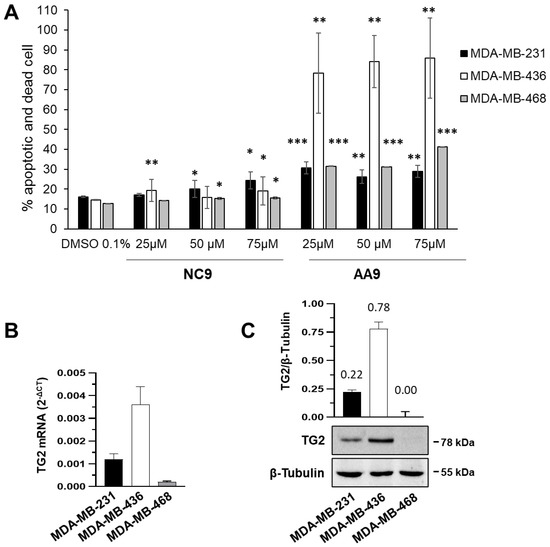
Figure 3.
Technologies of ctDNA mutation based on enzyme and nanomaterial. (
A–
G) Technology based on CRISPR-Cas system. (
A) method combining traditional PCR and CRISPR-Cas9 proposed by Wang [
71]. (
Aa) the introduced method mainly includes four steps: Preparation of templates, digestion of WT fragments by the Cas9 enzyme, PCR amplification, and Sanger sequencing or next-generation sequencing. (
Ab) the PCR results of various template ratios (1/10, 1/100, 1/1000, and 1/10,000), respectively, after enrichment. The templates were mixed using mutant type DNA harboring a 15-bp deletion (c.2235_2249del) and wild-type DNA at various ratios. (
Ac,
Ad) the result for EGFR-exon19 15-bp deletion mutant (c.2235_2249del) and the wild-type at different ratios using Cas9/sgRNA digestion plus PCR amplification or without Cas9/sgRNA digestion and the fold increase. (
B): CUT-PCR [
72]. (
Ba) schematic of the CUT-PCR enrichment process. (
Bb) for the KRAS (c.35G4T) mutation, targeted deep sequencing after CUT-PCR was treated (red bars) or not (gray bars) were conducted for the plasmid mixtures in which mutant plasmids were originally mixed with wild-type plasmids at a ratio of from 100% to 0.01%. (
C): Entropy-driven strand displacement reaction [
73]. (
Ca,
Cb) schematic of the principle of the CRISPR/Cas9-triggered ESDR based on a 3D GR/AuPtPd nanoflower biosensor. (
Cc) gel electrophoresis of the synthesized sgRNA (left) and DNA samples (right) after Cas9/sgRNA cleavage. (
Cd) reproducibility of the electrochemical biosensor in different target concentrations (
D): The combination method of graphene oxide screen printed electrode (GPHOXE) and dCas9 proteins and sgRNA [
74]. (
Da) schematic of CRISPR-dCas9 powered impedimetric biosensor. (
Db) calibration curve, x-axis represents the ctDNA concentration, y-axis represents the impedance results (ohm). (
E): A biosensor that was composed of a triple helix molecular switch (THMS) for recognition, ribonuclease HII, signal transduction probe (STP), capture probe fixed on the electrode, and deoxynucleotidyl transferase [
76]. (
Ea) schematic illustration of the dual enzyme assisted multiple amplification electrochemical biosensor. (
Eb) (
EbA) DPV responses for the detection of target ctDNA at concentrations of 0, 0.01 fM, 0.1 fM, 1 fM, 0.01 pM, 0.1 pM, and 1 pM (from a to g) with dual enzyme assisted multiple amplification, (
EbB) Linear relationship between IMB and logarithm of target ctDNA with dual enzyme assisted multiple amplification, (
EbC) DPV curves for the detection of ctDNA at concentrations of 0, 1 fM, 0.01 pM, 0.1 pM, 1 pM, and 0.01 nM (from a to f) without RNase HII-assisted target recycling amplification, (
EbD) Linear relationship between IMB and logarithm of target ctDNA without RNase HII-assisted target recycling amplification. Error bars represent standard deviations of three parallel experiments. (
F): A specific nucleic acid microfluidic capture device based on DNA nanomaterials [
81]. Model for the flow simulation in the P-mesh microfluidic capture device. (
Fa) Velocity. (
Fb) Pressure. (
Fc) MFI percentage of Cy5-labeled padlock probe attached on the PVDF membrane. MFI percentage of 1 μM Cy5-labeled ssDNA captured by the P-mesh microfluidic capture device after storage over 6 months. MFI percentage of 1pM Cy5-labeled ssDNA captured by the P-mesh microfluidic capture device after storage over 6 months. Differences between the two groups of samples were tested by t test. The level of significance was ***
G): A ctDNA ultrasensitive detection method dependent on the targeted recognition of the modified DNA probe on the gold-coated nanomaterials and the target fragment [
82]. (
Ga) Schematic illustration of DNA-mediated reduction of potassium ferricyanide (K3[Fe(CN)6]) by methylene blue (MB). (
Gb) hybridization-induced change in the SWVs after exposing the sensor to different concentrations of complementary ctDNA target (101 nucleotides) wherein the probe DNA hybridized to the 3′ end (red data points) and the middle (black data points) of the ctDNA. (
Gc) effect of hybridization time after exposing the sensor to 20 nM complementary ctDNA target (101 nucleotides) on the SWV current change. (
H): A multiplexed ligation ctDNA single nucleotide nanopore detection method [
83]. (
Ha,
Hb). the mutated sample exhibited clearly distinguishable optical spikes both in the red and green channels corresponding to passages of the target DNA molecules through the nanopore.

留言 (0)