


記住我
Conceptualization, P.-E.C., Z.F. and L.-W.C.; methodology, P.-E.C., Z.F. and L.-W.C.; software, P.-E.C. and G.-W.J.; validation, P.-E.C., G.-W.J. and L.-W.C.; formal analysis, P.-E.C. and G.-W.J.; investigation, P.-E.C. and G.-W.J.; resources, Z.F., J.S. and L.-W.C.; data curation, P.-E.C., G.-W.J. and T.-M.L.; writing—original draft preparation, P.-E.C. and J.S.; writing—review and editing, Z.F. and L.-W.C.; visualization, L.-W.C. and T.-M.L.; supervision, L.-W.C. and T.-M.L.; project administration, P.-E.C., Z.F. and L.-W.C.; funding acquisition, Z.F., J.S. and L.-W.C. All authors have read and agreed to the published version of the manuscript.
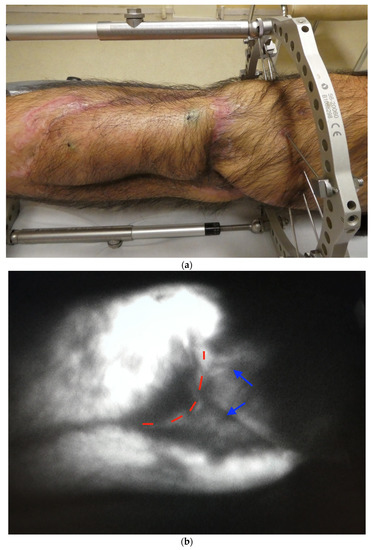
Figure 1. Illustration of the operations of Fu’s subcutaneous needling. FSN was performed as described in the Materials and Methods. (a) FSN needle. (b) Insertion point of FSN insertion. (c) Starting a swaying movement. (d) Dorsiflexion of the foot and resistance towards the practitioner in the reperfusion approach. (e) Knee extension and physician’s resistance in the reperfusion approach.
Figure 1. Illustration of the operations of Fu’s subcutaneous needling. FSN was performed as described in the Materials and Methods. (a) FSN needle. (b) Insertion point of FSN insertion. (c) Starting a swaying movement. (d) Dorsiflexion of the foot and resistance towards the practitioner in the reperfusion approach. (e) Knee extension and physician’s resistance in the reperfusion approach.
Figure 2. Illustration of the transcutaneous electrical nerve stimulation (TENS). (a) TENS. (b) TENS pads were attached at ST34, GB34, SP10, and SP9.
Figure 2. Illustration of the transcutaneous electrical nerve stimulation (TENS). (a) TENS. (b) TENS pads were attached at ST34, GB34, SP10, and SP9.
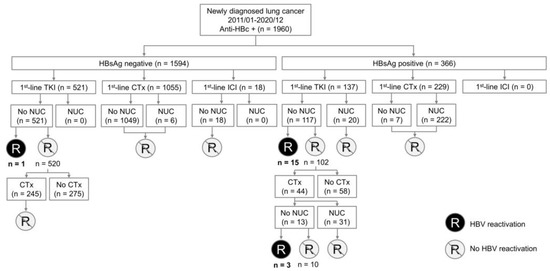
Figure 3. Flow chart of the adaptive study design with an interim analysis.
Figure 3. Flow chart of the adaptive study design with an interim analysis.
Figure 4. Flow chart summarizing follow-up on clinical outcomes and treatment preferences.
Figure 4. Flow chart summarizing follow-up on clinical outcomes and treatment preferences.
Figure 6. Comparison of the PPT of the quadriceps muscle (a), pes anserinus (b), and gastrocnemius muscle (c) between the two groups after each treatment. * represents the FSN group p < 0.05; # represents the TENS group p < 0.05. PPT: pressure pain threshold; FSN: Fu’s subcutaneous needling; TENS: transcutaneous electrical nerve stimulation.
Figure 6. Comparison of the PPT of the quadriceps muscle (a), pes anserinus (b), and gastrocnemius muscle (c) between the two groups after each treatment. * represents the FSN group p < 0.05; # represents the TENS group p < 0.05. PPT: pressure pain threshold; FSN: Fu’s subcutaneous needling; TENS: transcutaneous electrical nerve stimulation.
Figure 7. Comparison of TH in the quadriceps muscle (a), pes anserinus (b), and gastrocnemius muscle (c) between the two groups after each treatment. # represents the TENS group p < 0.05. TH: tissue hardness of muscle; FSN: Fu’s subcutaneous needling; TENS: transcutaneous electrical nerve stimulation.
Figure 7. Comparison of TH in the quadriceps muscle (a), pes anserinus (b), and gastrocnemius muscle (c) between the two groups after each treatment. # represents the TENS group p < 0.05. TH: tissue hardness of muscle; FSN: Fu’s subcutaneous needling; TENS: transcutaneous electrical nerve stimulation.
Figure 8. Comparison of WOMAC (a) and Lequesne index scores (b) between the two groups after each treatment. * represents the FSN group p < 0.05; # represents the TENS group p < 0.05. WOMAC: Western Ontario and McMaster Universities Osteoarthritis Index; FSN: Fu’s subcutaneous needling; TENS: transcutaneous electrical nerve stimulation.
Figure 8. Comparison of WOMAC (a) and Lequesne index scores (b) between the two groups after each treatment. * represents the FSN group p < 0.05; # represents the TENS group p < 0.05. WOMAC: Western Ontario and McMaster Universities Osteoarthritis Index; FSN: Fu’s subcutaneous needling; TENS: transcutaneous electrical nerve stimulation.
Figure 9. Improvement process for MTrPs.
Figure 9. Improvement process for MTrPs.
Table 1. Baseline characteristics and clinical evaluation indicators of participants.
Table 1. Baseline characteristics and clinical evaluation indicators of participants.
CharacteristicsFSN (N = 15)TENS (N = 16)p-ValueAge (years old)65.73 ± 6.79 (54–77)62.81 ± 5.72 (54–72)0.24Sex (M/F)4/116/100.70Affected side (Left/Right)9/68/80.58Height (cm)161.00 ± 6.11158.69 ± 6.250.34Weight (kg)69.00 ± 13.1759.50 ± 9.570.14VAS (0–10)5.80 ± 1.425.81 ± 0.910.98WOMAC-Total (0–96)27.80 ± 12.1226.44 ± 12.540.61Lequesne index (0–24)10.13 ± 3.278.75 ± 2.350.26PPT (N/cm2) Quadriceps muscle74.73 ± 28.6386.56 ± 24.350.41Pes anserinus66.53 ± 34.0663.38 ± 17.760.84Gastrocnemius muscle88.47 ± 34.0582.13 ± 24.970.89TH (N) Quadriceps muscle47.79 ± 10.0445.39 ± 9.510.83Pes anserinus41.44 ± 9.9437.80 ± 4.400.14Gastrocnemius muscle36.79 ± 6.3035.15 ± 6.970.68ROM (degrees) Active ROM103.87 ± 11.17112.63 ± 16.310.07Passive ROM125.80 ± 15.33135.69 ± 16.800.06Walking speed (cm/s)32.80 ± 6.6035.96 ± 3.200.11Table 4. WOMAC and Lequesne indices compared between the FSN and TENS groups.
Table 4. WOMAC and Lequesne indices compared between the FSN and TENS groups.
Day 1Day 8Day 15Pre-tx1-Week Follow-Upp-Value2-Week Follow-Upp-ValueWOMAC FSN group27.80 ± 12.1221.87 ± 10.50<0.05 *22.00 ± 11.06<0.05 *TENS group26.44 ± 12.5418.31 ± 15.02<0.05 *19.13 ± 16.64<0.05 *Lequesne index FSN group10.13 ± 3.278.20 ± 3.12<0.05 *7.27 ± 2.95<0.05 *TENS group8.75 ± 2.257.50 ± 2.57<0.05 *8.25 ± 3.050.44
留言 (0)