


記住我


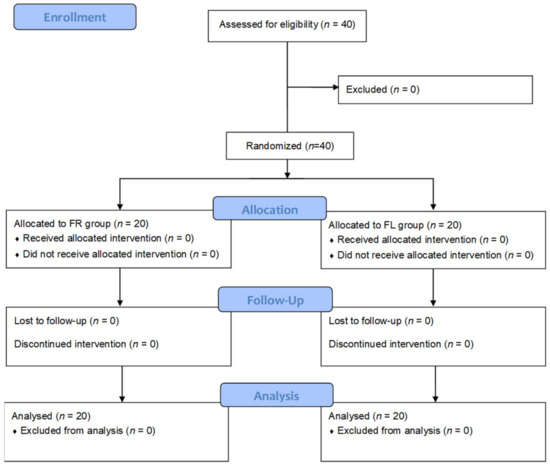

Figure 1. Flow diagram of the participants.
Figure 1. Flow diagram of the participants.
Figure 2. Functional parameters in old individuals before and after a six-months intervention. (a) Number of frailty criteria fulfilled by the participants before and after the Real-Life and the Clinical Trial interventions. (b) Performance in the basic activities of daily living using the Barthel Scale. (c) Performance in the instrumental activities of daily living using the Lawton & Brody Scale. Real-Life Intervention n = 50, Clinical Trial Intervention n = 51, Clinical Trial Control n = 49. Bars represent mean ± SD. Statistical analysis was performed with the Student’s t test for paired samples and the Wilcoxon test for non-parametric samples.
Figure 2. Functional parameters in old individuals before and after a six-months intervention. (a) Number of frailty criteria fulfilled by the participants before and after the Real-Life and the Clinical Trial interventions. (b) Performance in the basic activities of daily living using the Barthel Scale. (c) Performance in the instrumental activities of daily living using the Lawton & Brody Scale. Real-Life Intervention n = 50, Clinical Trial Intervention n = 51, Clinical Trial Control n = 49. Bars represent mean ± SD. Statistical analysis was performed with the Student’s t test for paired samples and the Wilcoxon test for non-parametric samples.
Figure 3. Nutritional status assessed with the Short-MNA Scale. Real-Life Intervention n = 50, Clinical Trial Intervention n = 51, Clinical Trial Control n = 49. Bars represent mean ± SD. Statistical analysis was performed with the Student’s t test for paired samples and the Wilcoxon test for non-parametric samples.
Figure 3. Nutritional status assessed with the Short-MNA Scale. Real-Life Intervention n = 50, Clinical Trial Intervention n = 51, Clinical Trial Control n = 49. Bars represent mean ± SD. Statistical analysis was performed with the Student’s t test for paired samples and the Wilcoxon test for non-parametric samples.
Figure 4. Fall risk, number of falls and fear of falling assessed in old individuals before and after a six-month intervention. (a) Assessment of the Tinetti scale. (b) Number of falls before and after the Real-Life and the Clinical Trial interventions. (c) Fear of falling before and after the Real-Life and the Clinical Trial intervention. Real-Life Intervention n = 50, Clinical Trial Intervention n = 51, Clinical Trial Control n = 49. Bars represent mean ± SD. Statistical analysis was performed with the Student’s t test for paired samples and the Wilcoxon test for non-parametric samples.
Figure 4. Fall risk, number of falls and fear of falling assessed in old individuals before and after a six-month intervention. (a) Assessment of the Tinetti scale. (b) Number of falls before and after the Real-Life and the Clinical Trial interventions. (c) Fear of falling before and after the Real-Life and the Clinical Trial intervention. Real-Life Intervention n = 50, Clinical Trial Intervention n = 51, Clinical Trial Control n = 49. Bars represent mean ± SD. Statistical analysis was performed with the Student’s t test for paired samples and the Wilcoxon test for non-parametric samples.
Figure 5. Self-rated emotional and social assessments before and after the interventions in old individuals. (a) Evaluation of the quality-of-life by using the EuroQol scale. (b) Results on the Duke Scale questionnaire for the social support perceived by the patient. (c) Results on the geriatric depression scale of Yesavage. Real-Life Intervention n = 50, Clinical Trial Intervention n = 51, Clinical Trial Control n = 49. Bars represent mean ± SD. Statistical analysis was performed with the Student’s t test for paired samples and the Wilcoxon test for non-parametric samples.
Figure 5. Self-rated emotional and social assessments before and after the interventions in old individuals. (a) Evaluation of the quality-of-life by using the EuroQol scale. (b) Results on the Duke Scale questionnaire for the social support perceived by the patient. (c) Results on the geriatric depression scale of Yesavage. Real-Life Intervention n = 50, Clinical Trial Intervention n = 51, Clinical Trial Control n = 49. Bars represent mean ± SD. Statistical analysis was performed with the Student’s t test for paired samples and the Wilcoxon test for non-parametric samples.
Figure 6. Hospital visits in the previous and later six months of the interventions in the study participants. (a) Number of visits to the primary care centres before and after the interventions. (b) Number of emergency visits before and after the interventions. Real-Life Intervention n = 50, Clinical Trial Intervention n = 51, Clinical Trial Control n = 49. Bars represent mean ± SD. Statistical analysis was performed with the Student’s t test for paired samples and the Wilcoxon test for non-parametric samples.
Figure 6. Hospital visits in the previous and later six months of the interventions in the study participants. (a) Number of visits to the primary care centres before and after the interventions. (b) Number of emergency visits before and after the interventions. Real-Life Intervention n = 50, Clinical Trial Intervention n = 51, Clinical Trial Control n = 49. Bars represent mean ± SD. Statistical analysis was performed with the Student’s t test for paired samples and the Wilcoxon test for non-parametric samples.
Table 1. Changes in the main outcomes analyzed in our study before and after the interventions, Real-life and CT.
Table 1. Changes in the main outcomes analyzed in our study before and after the interventions, Real-life and CT.
Real-Life
留言 (0)