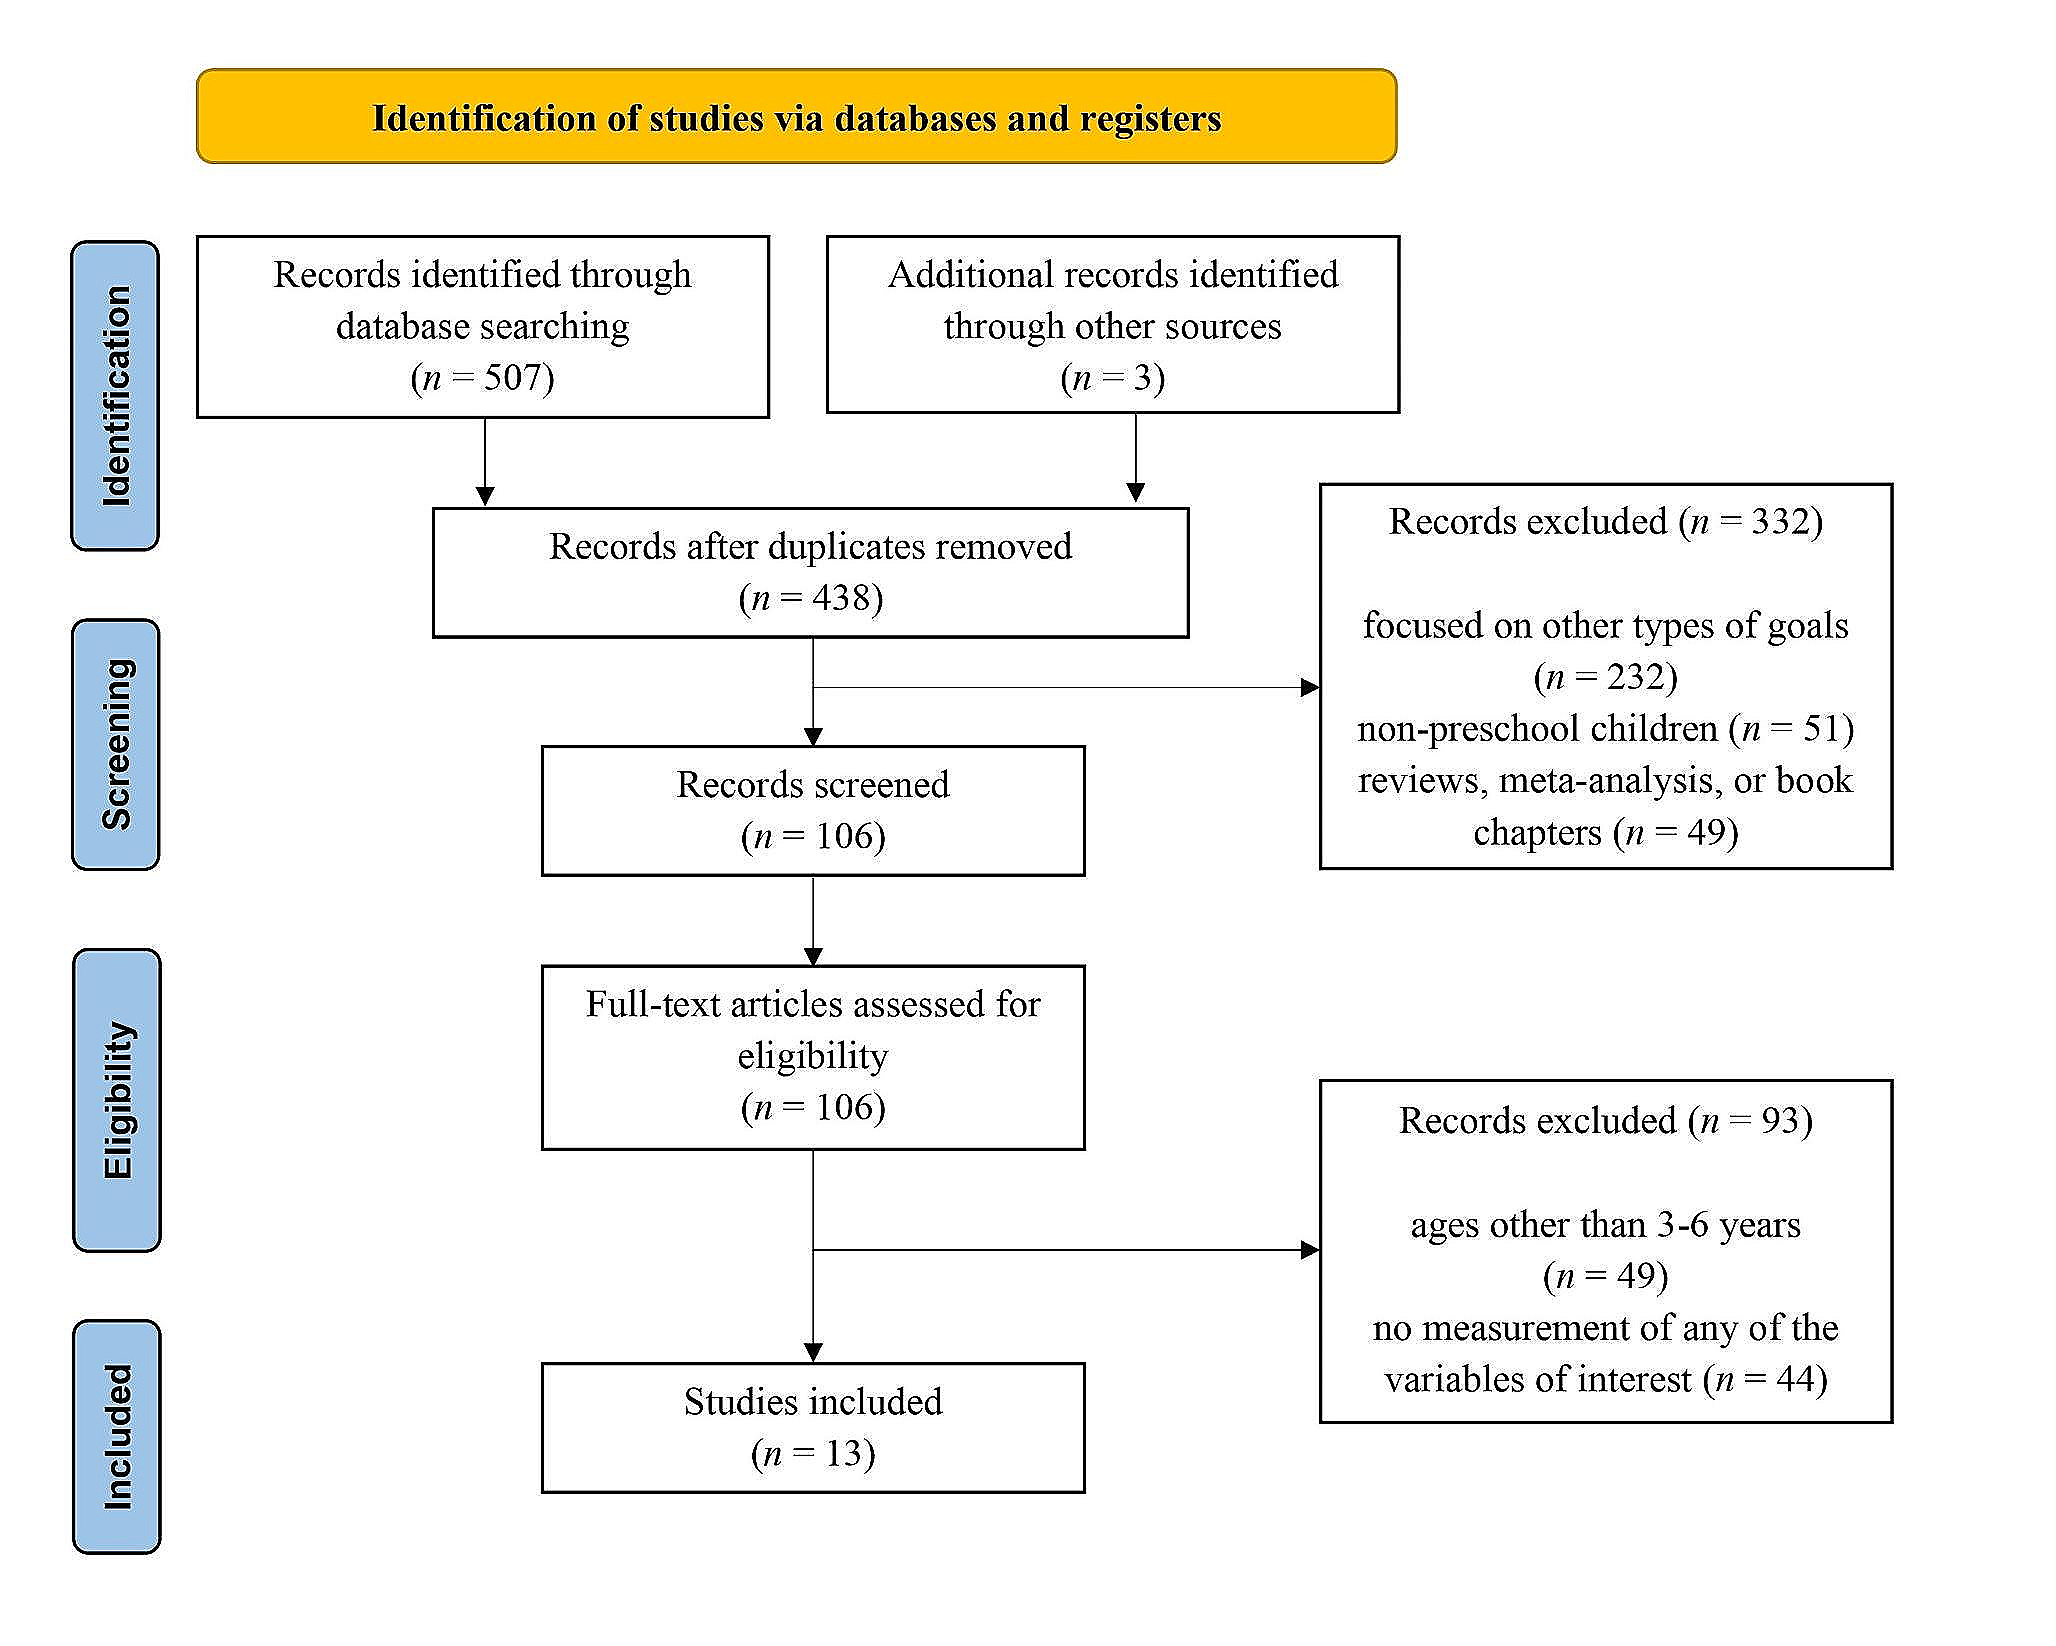
Subjects
Sixty-two adolescents with TS ranging from 13 to 18 years old were recruited through the Reference Center for Tourette Syndrome at the Pitié-Salpêtrière Hospital in Paris without any criteria of social or cultural origin. All patients at the age of majority (≥ 18 years) and all parents and patients under the age of majority (< 18 years) gave their written consent to participate in the study. The exclusion criteria were a lack of capacity or unwillingness to give consent for the study, evidence of either present or prior substance addiction, a past or present history of psychosis, and neurological disorder other than TS. This project was approved by the national ethics committee (2019.06.05 bis _19.04.26.51955).
All patients were assessed for tic severity using the Yale Global Tic Severity Scale (YGTSS [16]), OCD using the Yale-Brown Obsessive Compulsive Scale (Y-BOCS [17, 18]) and ADHD using the ADHD Self-Report Scale (ASRS; [19]). Additional self-reported assessments were performed by the patients for depression (Beck Depression Inventory [BDI] [20]), impulsivity (child version of the Urgency, Premeditation, Perseverance, Sensation Seeking, Impulsive Behavior Scale [UPPS] [21]), or their parents for executive functioning (Behavior Rating Inventory of Executive Function [BRIEF] [22]). All descriptive data and statistics are available in supplementary material.
Data acquisition
The 62 individuals with TS participated in a short recorded interview (less than 15 min) which was performed in a quiet room with a minimum number of individuals (i.e., the patient, the interviewer, and eventually one additional person from the research team). Before the interview, patients were invited to develop their responses as much as possible and were encouraged to talk about different topics. The interviewer—a neuropsychologist (CAC)—remained the same for all patients. Particular attention was given to always formulate the question in the same manner and to take part as little as possible in the discussion to avoid interviewer bias.
The interview was built to discuss the following points: (i) the daily life of patients in school, at home, and with strangers; (ii) the aspect of TS which had the worst consequences on their daily functioning; (iii) their thoughts regarding their future daily life as adults. The questions were asked in a pseudo-randomized order. The patients were also invited to add any information they wanted to share.
Data pre-processing
The interviews were first manually transcribed by four different members of the team (i.e., MD, EL, LP, and EW) and then divided by question, leading to the composition of five corpora. Before the corpora were statistically analyzed, a final reading was performed by CAC to homogenize several terms (to avoid the analyses considering two synonyms to be unrelated) and to add terms in the case of implicit reference.
Then, the corpora were loaded in the IRAMUTEQ software (R Interface for Multidimensional Analysis of Texts and Questionnaires, version 0.7–alpha 2), a text mining dedicated tool based on both R and Python languages [23]. IRAMUTEQ applies text pre-processing in three steps. First, it divides each text of the corpus into smaller units on the criteria of size and punctuation, called “text segments”. This segmentation has the advantage of decreasing the units’ granularity and increasing the precision of the analyses. Then, a lemmatization of the corpus was performed, grouping together the inflected forms of a word to their simplest form to analyze them as a single item (e.g., “ate” and “eaten” were changed for “eat”). Finally, words were categorized into two subcategories: “full words” (e.g., verbs, nouns, and adjectives) and “tool words” (e.g., pronouns and determents) to only consider full words in the analyses.
Data analyses
We analyzed the five corpora separately. For each, we performed a factorial correspondence analysis (FCA) on each full word with a frequency ≥ 5, to measure the relationships between words of the corpus. This analysis was applied by building a binary table with all text segments as rows and all full words as columns, with the code “0” if the word is not present in the segment and “1” if the word is present. In other words, FCA is used to determine the proximity between words based on their frequencies. Furthermore, FCA identified a small number of independent dimensions (so-called “factors”) based on an analysis of inertia decomposition, which corresponds to the variance of our data (i.e., the full words). FCA is applied by first calculating the total variance of the data (called total inertia), then decomposing the whole data by finding the factor which explains the higher part of the variance (i.e., the factor (1), and then the second factor which explains another part of the variance (i.e., the factor (2) until the whole variance has been explained. This process is called inertia decomposition. The generated dimensions allow for a reduction of the variance of the raw data (i.e., the whole corpus) by simultaneously minimizing the distance between the profiles and axes and maximizing the amount of explained inertia. For example, the first factor of an FCA is the one which captures the largest part of variance of the corpus, followed by the second factor, etc. In other words, this analysis generates several factors, for which all full words will have a specific position, a specific correlation with the factor, and a specific contribution to the factor. As this approach allows for the reduction of a corpus’ complexity, we decided to consider only the two first factors (i.e., the most meaningful), and for these, we considered all words with a contribution higher than random to be significant (i.e., the contribution of specific words should be higher than the number of words implicated in the analysis divided by 100, e.g., if 100 words were involved in the analysis, the contribution should be higher than 1%). This selection allowed us, for each factor, to build a gradient from words significantly negatively correlated to the factor to words significantly positively correlated with the factor. To increase the readability of our results, we named each side of the two considered factors on the basis of the significant words as well as the most relevant text segments. Finally, for illustrative purpose, we reported, for each side of each factor, one phrase from the most typical individual with TS (i.e., from the patients with the lowest and the highest correlations with each factor). The supplementary Fig. 1 illustrates the FCA process.
Then, we extracted the correlation of each individual with TS with the two considered factors. These positions were used (1) to determine if most of the patients were more oriented toward the negative or the positive position of this factor using χ2 test. To do this, we built a contingency table with two columns to obtain the number of participants who had a negative or a positive score with regards to the factor. (2) To correlate them with demographic and clinical data. The variables considered were as follows: demographic data (i.e., gender and age), tic severity (i.e., YGTSS subscales), medication status, severity of comorbidities as assessed during the study (i.e., Y-BOCS and ASRS), impulsivity (i.e., UPPS), and depression (i.e., BDI) as perceived by the patients and executive functioning as perceived by the parents (i.e., BRIEF). For all analyses, the threshold for significance was set at p ≤ 0.05.

留言 (0)