
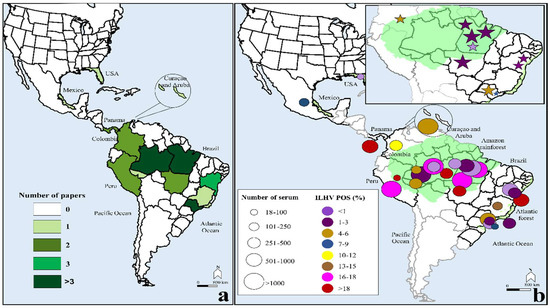
 Figure 2.
Low energy model of 2 bound in the HP, predicted by Schrodinger docking [
Figure 2.
Low energy model of 2 bound in the HP, predicted by Schrodinger docking [


記住我
Conceptualization, M.G.; methodology, L.H., G.Z., V.S., N.N., E.G., K.H.L. and M.G.; validation, M.G., L.H. and G.Z.; formal analysis, L.H. and M.G.; resources, M.G. and K.H.L.; data curation, L.H. and M.G.; writing—original draft preparation, M.G..; writing—review and editing, M.G., L.H., G.Z. and K.H.L.; supervision, M.G. and L.H.; project administration, M.G.; funding acquisition, M.G. All authors have read and agreed to the published version of the manuscript.
FundingThis research was funded by grant AI140904 from the National Institutes of Health. Additional support was provided by Touro University California College of Osteopathic Medicine. K.H.L. was supported by the Dr Miriam and Sheldon G. Adelson Medical Research Foundation. Work by M.G. at the Molecular Foundry, Lawrence Berkeley National Laboratory, was supported by the Office of Science, Office of Basic Energy Sciences, of the U.S. Department of Energy under Contract No. DE-AC02-05CH11231. Molecular Graphics images were made using the Schrodinger Maestro program, provided free to academic users, or using UCSF Chimera, developed by the Resource for Biocomputing, Visualization, and Informatics at the University of California, San Francisco, with support from NIH P41-GM103311.
Figure 1. Structures of gp41 inhibitors and their corresponding sulfotetrafluorophenyl (STP) esters.
Figure 1. Structures of gp41 inhibitors and their corresponding sulfotetrafluorophenyl (STP) esters.
Figure 3. Fluorescence experiments measuring affinity of compounds by competitive inhibition. Binding curves, fit to a standard IC50 equation, are shown for the acid (closed circles) and ester (open circles) forms of (A). 1, (B). 2 and (C). 3. Additionally, shown in A are binding curves (in blue) to a receptor in which the pocket Lys574 had been replaced with norleucine. The fractional fluorescence was calculated relative to that of free probe peptide in the presence of compound. Data was measured repeatedly over the course of 3 h and shown at 30 min for (A) and 45 min for (B) and (C). Error bars show the standard deviation.
Figure 3. Fluorescence experiments measuring affinity of compounds by competitive inhibition. Binding curves, fit to a standard IC50 equation, are shown for the acid (closed circles) and ester (open circles) forms of (A). 1, (B). 2 and (C). 3. Additionally, shown in A are binding curves (in blue) to a receptor in which the pocket Lys574 had been replaced with norleucine. The fractional fluorescence was calculated relative to that of free probe peptide in the presence of compound. Data was measured repeatedly over the course of 3 h and shown at 30 min for (A) and 45 min for (B) and (C). Error bars show the standard deviation.
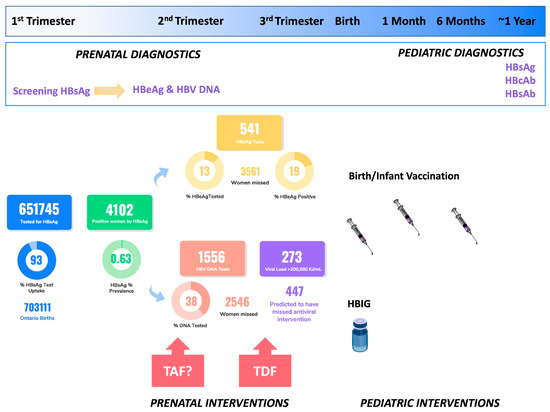
Figure 4. Schematic representation of the gp41 ectodomain and the hairpin construct developed to expose the hydrophobic pocket. The 705 residue ectodomain consists of the fusion peptide, fusion peptide proximal region, N-heptad repeat (N50), a loop, C-heptad repeat (C39) and membrane proximal external region (MPER). The NHR domain is shown in red and the CHR domain in green. In the hairpin construct C22(L4)N50, the 50 residue NHR is intact but the CHR is truncated by 17 residues. This, plus the placement of the CHR ahead of the NHR in the sequence, exposes the HP. Only one of the three strands of the homotrimeric structure is shown.
Figure 4. Schematic representation of the gp41 ectodomain and the hairpin construct developed to expose the hydrophobic pocket. The 705 residue ectodomain consists of the fusion peptide, fusion peptide proximal region, N-heptad repeat (N50), a loop, C-heptad repeat (C39) and membrane proximal external region (MPER). The NHR domain is shown in red and the CHR domain in green. In the hairpin construct C22(L4)N50, the 50 residue NHR is intact but the CHR is truncated by 17 residues. This, plus the placement of the CHR ahead of the NHR in the sequence, exposes the HP. Only one of the three strands of the homotrimeric structure is shown.
Figure 5. Dose response curves in antiviral infectivity and cell–cell fusion assays. Both pseudotyped virus and effector cells expressed HXB2 Env. The acid and STP ester dose response curves are overlaid in the same figure for (A). 1 and 1-STP, (B). 2 and 2-STP and (C). 3 and 3-STP, using solid symbols for the acid and open symbols for the ester. Viability is shown in green and fusion in black. The fractional signal was normalized relative to positive and negative controls and is luminescence for the fusion readout and fluorescence for the viability readout. A fractional value of 1 indicates maximum fusion or viability. Error bars show the standard deviation.
Figure 5. Dose response curves in antiviral infectivity and cell–cell fusion assays. Both pseudotyped virus and effector cells expressed HXB2 Env. The acid and STP ester dose response curves are overlaid in the same figure for (A). 1 and 1-STP, (B). 2 and 2-STP and (C). 3 and 3-STP, using solid symbols for the acid and open symbols for the ester. Viability is shown in green and fusion in black. The fractional signal was normalized relative to positive and negative controls and is luminescence for the fusion readout and fluorescence for the viability readout. A fractional value of 1 indicates maximum fusion or viability. Error bars show the standard deviation.
Figure 6. Dose response curves for compounds 2-STP and 3-STP against HXB2-Env (solid circles), JRFL-Env (solid squares) and Ampho-MLV Env (solid diamonds). Fractional cell viability compared to controls with no compound is also shown (green, open symbols). Experiment repeated in triplicate, error bars show the standard deviation. Data are fit to standard IC50 curves.
Figure 6. Dose response curves for compounds 2-STP and 3-STP against HXB2-Env (solid circles), JRFL-Env (solid squares) and Ampho-MLV Env (solid diamonds). Fractional cell viability compared to controls with no compound is also shown (green, open symbols). Experiment repeated in triplicate, error bars show the standard deviation. Data are fit to standard IC50 curves.
Figure 7. Docked pose of 3 (light green) in the HP with the carboxylate group pointing towards K574 and a previously found C-terminal pocket binding fragment (dark green).
Figure 7. Docked pose of 3 (light green) in the HP with the carboxylate group pointing towards K574 and a previously found C-terminal pocket binding fragment (dark green).
Table 1. Properties of HP equilibrium binders.
Table 1. Properties of HP equilibrium binders.
CompoundMWtLog P †KIaIC50 HXB2 a,bIC50 (CCF) a,c1 * 514.577.381 ± 0.530.42400.414.0425 ± 535≥503276.241.10177 ± 12>100>100Table 2. Antiviral and cell–cell fusion assay results *.
Table 2. Antiviral and cell–cell fusion assay results *.
Antiviral ActivityInhibition of Cell–Cell FusionCompoundEC50EC90 †CC50 ‡EC50EC90 †CC50 ‡13.2 ± 1.617 ± 1322 ± 30.4 ± 0.212 ± 6>>10235 ± 7800 ± 190≥35678 ± 24 a110 ± 19 a≥1133>100n/a>100>100n/a>1001-STP0.3 ± 0.22.9 ± 1.620 ± 30.23 ± 0.164.3 ± 2.8>>102-STP5 ± 459 ± 22≥10012 ± 338 ± 11≥2003-STP9 ± 244 ± 15>>40>40n/a>>40
留言 (0)