JCM, Vol. 11, Pages 7148: Impact of Traditional and Non-Traditional Lipid Parameters on Outcomes after Intravenous Thrombolysis in Acute Ischemic Stroke

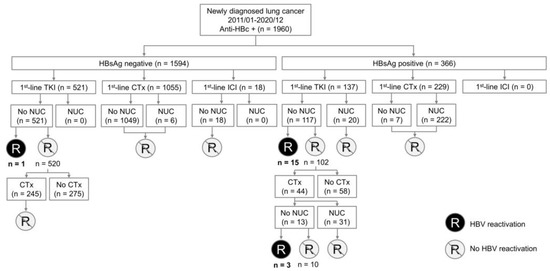
Figure 1. Flow Diagram Illustrating Only Patients with Valid Lipid Parameters were Analysed.

Jcm 11 07148 g001

Figure 2. (A) Restricted Cubic Spline Curves relating Lipid Parameters with Poor Functional Outcome (B) Restricted Cubic Spline Curves relating Lipid Parameters with SICH (C) Restricted Cubic Spline Curves relating Lipid Parameters with Mortality.Abbreviations: LDL low-density lipoprotein cholesterol, HDL high-density lipoprotein cholesterol, LDL/HDL low-density lipoprotein cholesterol/high-density lipoprotein cholesterol ratio, SICH symptomatic intracranial hemorrhage.

Figure 2. (A) Restricted Cubic Spline Curves relating Lipid Parameters with Poor Functional Outcome (B) Restricted Cubic Spline Curves relating Lipid Parameters with SICH (C) Restricted Cubic Spline Curves relating Lipid Parameters with Mortality.Abbreviations: LDL low-density lipoprotein cholesterol, HDL high-density lipoprotein cholesterol, LDL/HDL low-density lipoprotein cholesterol/high-density lipoprotein cholesterol ratio, SICH symptomatic intracranial hemorrhage.

Jcm 11 07148 g002aJcm 11 07148 g002b

Table 1. Baseline Characteristics of Study Population.

Table 1. Baseline Characteristics of Study Population.

Total (n = 1004)Age (years)66 [56,77]Gender (male)589/986 (59.7)RaceChinese
Malay
Indian
Others586/883 (66.4)
188/883 (21.3)
62/883 (7.0)
47/883 (5.3)Lipid parametersLDL-C (mmol/L)2.86 [2.18, 3.50]Non-HDL-C (mmol/L)3.43 [2.70, 4.19]HDL-C (mmol/L)1.12 [0.95, 1.32]TC (mmol/L)4.62 [3.86, 5.36]LDL-C/HDL-C Ratio2.49 [1.84, 3.30]Stroke parametersAdmitting NIHSS15 [8,21] Admitting SBP (mmHg)152 [136,168]Admitting DBP (mmHg)82 [72,92]Large vessel occlusion596/916 (65.1)ComorbiditiesSmoker148 (14.7)Hypertension657 (65.4)Hyperlipidemia 526 (52.4)Diabetes mellitus 306 (30.5)Atrial fibrillation190 (18.9)Stroke Subtype (TOAST)LAA
CE
SVO
Stroke of other determined etiology
Cryptogenic322/975 (33.0)
341/975 (35.0)
168/975 (17.2)
10/975 (1.0)
134/975 (13.7)Glucose levelFasting glucose (mmol/L)5.90 [5.20, 7.30]HbA1C (%)6.00 [5.60, 6.90]

Table 2. Lipid Parameters and Associations with LAA.

Table 2. Lipid Parameters and Associations with LAA.

LAAUnivariate AnalysisMultivariate AnalysisOR (95% CI)p-ValueOR (95% CI)p-ValueLDL-C:
      Q1
      Q2
      Q3
      Q4
1.0
1.28 (0.87–1.88)
1.03 (0.69–1.51)
1.64 (1.13–2.40)
-
0.209
0.898
0.010
1.0
1.42 (0.90–2.25)
1.27 (0.79–2.05)
1.69 (1.07–2.69)
-
0.130
0.323
0.024Non-HDL-C:
      Q1
      Q2
      Q3
      Q4
1.0
1.39 (0.95–2.04)
1.09 (0.74–1.62)
1.62 (1.11–2.37)
-
0.093
0.657
0.013
1.0
1.64 (1.04–2.60)
1.25 (0.78–2.01)
1.75 (1.10–2.80)
-
0.035
0.355
0.018TC:
      Q1
      Q2
      Q3
      Q4
1.03 (0.70–1.52)
1.0
1.11 (0.76–1.62)
1.30 (0.89–1.90)
0.874
-
0.603
0.170
0.93 (0.59–1.47)
1.0
1.11 (0.71–1.74)
1.28 (0.82–1.99)
0.767
-
0.645
0.277HDL-C
      Q1
      Q2
      Q3
      Q4
1.44 (0.98–2.13)
1.30 (0.88–1.93)
1.76 (1.19–2.60)
1.0
0.067
0.183
0.005
-
1.27 (0.79–2.04)
1.30 (0.81–2.08)
1.84 (1.16–2.95)
1.0
0.320
0.276
0.010
-LDL-C/HDL-C:
      Q1
      Q2
      Q3
      Q4
1.0
1.10 (0.74–1.63)
1.67 (1.14–2.46)
1.69 (1.16–2.49)
-
0.646
0.009
0.007
1.0
1.26 (0.79–2.02)
1.88 (1.18–3.00)
1.71 (1.07–2.77)
-
0.333
0.008
0.027

Table 3. Stroke Outcomes.

Table 3. Stroke Outcomes.

Stroke OutcomesTotal (n = 1004)Poor functional outcome (90-day mRS 3–6)479/995 (48.1)SICH48/1003 (4.8)90-day mortality117/990 (11.8)

Table 4. Association of Lipid Parameters with Poor Functional Outcome, SICH and Mortality.

Table 4. Association of Lipid Parameters with Poor Functional Outcome, SICH and Mortality.

Poor Functional Outcome (mRS 3–6)Univariate AnalysisMultivariate AnalysisOR95% CIp-ValueOR95% CIp-ValueLDL-C:
      Q1
      Q2
      Q3
      Q4
2.18
1.19
1.00
1.0
1.52–3.12
0.83–1.70
0.70–1.43
-
<0.001
0.339
0.997
-
1.33
1.0
1.11
1.12
0.87–2.03
-
0.72–1.70
0.73–1.71
0.196
-
0.647
0.607Non-HDL-C:
      Q1
      Q2
      Q3
      Q4
2.56
1.51
1.0
1.16
1.79–3.68
1.06–2.15
-
0.81–1.66
<0.001
0.024
-
0.421
1.30
1.05
1.0
1.19
0.84–2.03
0.69–1.62
-
0.78–1.83

0.241
0.809
-
0.416TC:
      Q1
      Q2
      Q3
      Q4
2.38
1.37
1.0
1.08
1.66–3.42
0.96–1.95
-
0.76–1.54
<0.001
0.082
-
0.672
1.38
1.05
1.0
1.10
0.90–2.14
0.69–1.62
-
0.72–1.68
0.141
0.810
-
0.651HDL-C:
      Q1
      Q2
      Q3
      Q4
1.09
1.09
1.0
1.04
0.77–1.56
0.76–1.54
-
0.72–1.49
0.626
0.646
-
0.839
1.66
1.63
1.56
1.0
1.06–2.60
1.05–2.53
1.01–2.44
-
0.028
0.027
0.048
-LDL-C/HDL-C Ratio:
      Q1
      Q2
      Q3
      Q4

2.31
2.00
1.0
1.39

1.61–3.32
1.40–2.87
-
0.98–2.00

<0.001
<0.001
-
0.069

1.27
1.56
1.0
1.78

0.81–1.97
1.02–2.41
-
1.16–2.76

0.294
0.043
-
0.009

Symptomatic Intracranial Hemorrhage (SICH)Univariate AnalysisMultivariate AnalysisOR95% CIp-valueOR95% CIp-valueLDL-C:
      Q1
      Q2
      Q3
      Q4
2.37
1.62
1.0
2.10
0.99–6.27
0.63–4.48
-
0.86–5.63
0.062
0.324
-
0.115
1.84
1.41
1.0
2.22
0.71–5.37
0.52–4.21
-
0.85–6.47
0.227
0.514
-
0.117Non-HDL-C:
      Q1
      Q2
      Q3
      Q4
3.59
3.88
1.0
3.93
1.27–12.80
1.38–13.75
-
1.40–13.93
0.026
0.017
-
0.016
3.19
4.28
1.0
5.17
0.99–14.30
1.36–18.90
-
1.64–22.81
0.078
0.025
-
0.011TC:
      Q1
      Q2
      Q3
      Q4
4.92
5.28
1.0
5.68
1.58–21.55
1.71–22.98
-
1.86–24.62
0.013
0.009
-
0.006
3.58
4.46
1.0
5.29
1.12–15.96
1.43–19.59
-
1.69–23.33
0.052
0.021
-
0.010HDL-C:
      Q1
      Q2
      Q3
      Q4
1.0
2.82
1.82
2.68
-
1.15–7.93
0.67–5.43
1.07–7.63
-
0.032
0.253
0.045
1.0
3.07
2.08
2.26
-
1.23–8.75
0.74–6.34
0.85–6.74
-
0.022
0.173
0.116LDL-C/HDL-C Ratio:
      Q1
      Q2
      Q3
      Q4

2.23
1.40
1.0
1.54

0.97–5.54
0.56–3.67
-
0.62–3.99

0.068
0.479
-
0.355

1.49
1.07
1.0
1.55

0.63–3.83
0.41–2.89
-
0.61–4.14

0.378
0.897
-
0.367

Mortality Univariate AnalysisMultivariate AnalysisOR95% CIp-valueOR95% CIp-valueLDL-C:
      Q1
      Q2
      Q3
      Q4
3.43
2.19
1.0
1.46
1.93–6.42
1.18–4.19
-
0.75–2.89
<0.001
0.015
-
0.272
2.57
2.28
1.0
1.96
1.27–5.57
1.10–5.02
-
0.89–4.49
0.011
0.032
-
0.101Non-HDL-C:
      Q1
      Q2
      Q3
      Q4
2.25
1.94
1.0
1.01
1.29–4.03
1.10–3.51
-
0.53–1.94
0.005
0.025
-
0.968
1.06
1.55
1.0
1.10
0.54–2.14
0.79–3.14
-
0.53–2.34
0.669
0.204
-
0.744TC:
      Q1
      Q2
      Q3
      Q4
2.60
1.65
1.0
1.08
1.50–4.63
0.92–3.02
-
0.57–2.05
<0.001
0.097
-
0.818
1.44
1.16
1.0
1.04
0.77–2.76
0.60–2.30
-
0.51–2.15
0.266
0.657
-
0.904HDL-C:
      Q1
      Q2
      Q3
      Q4
1.19
1.36
1.0
1.16
0.67–2.11
0.78–2.38
-
0.65–2.07
0.553
0.280
-
0.623
1.16
1.38
1.10
1.0
0.62–2.21
0.75–2.55
0.57–2.10
-
0.639
0.296
0.784
-LDL-C/HDL-C Ratio:
      Q1
      Q2
      Q3
      Q4

2.28
2.27
1.0
1.06

1.29–4.15
1.29–4.13
-
0.55–2.06

0.005
0.006
-
0.857

1.55
2.51
1.0
1.46

0.80–3.14
1.30–5.05
-
0.68–3.17

0.204
0.008
-
0.338

留言 (0)

沒有登入
gif