
記住我


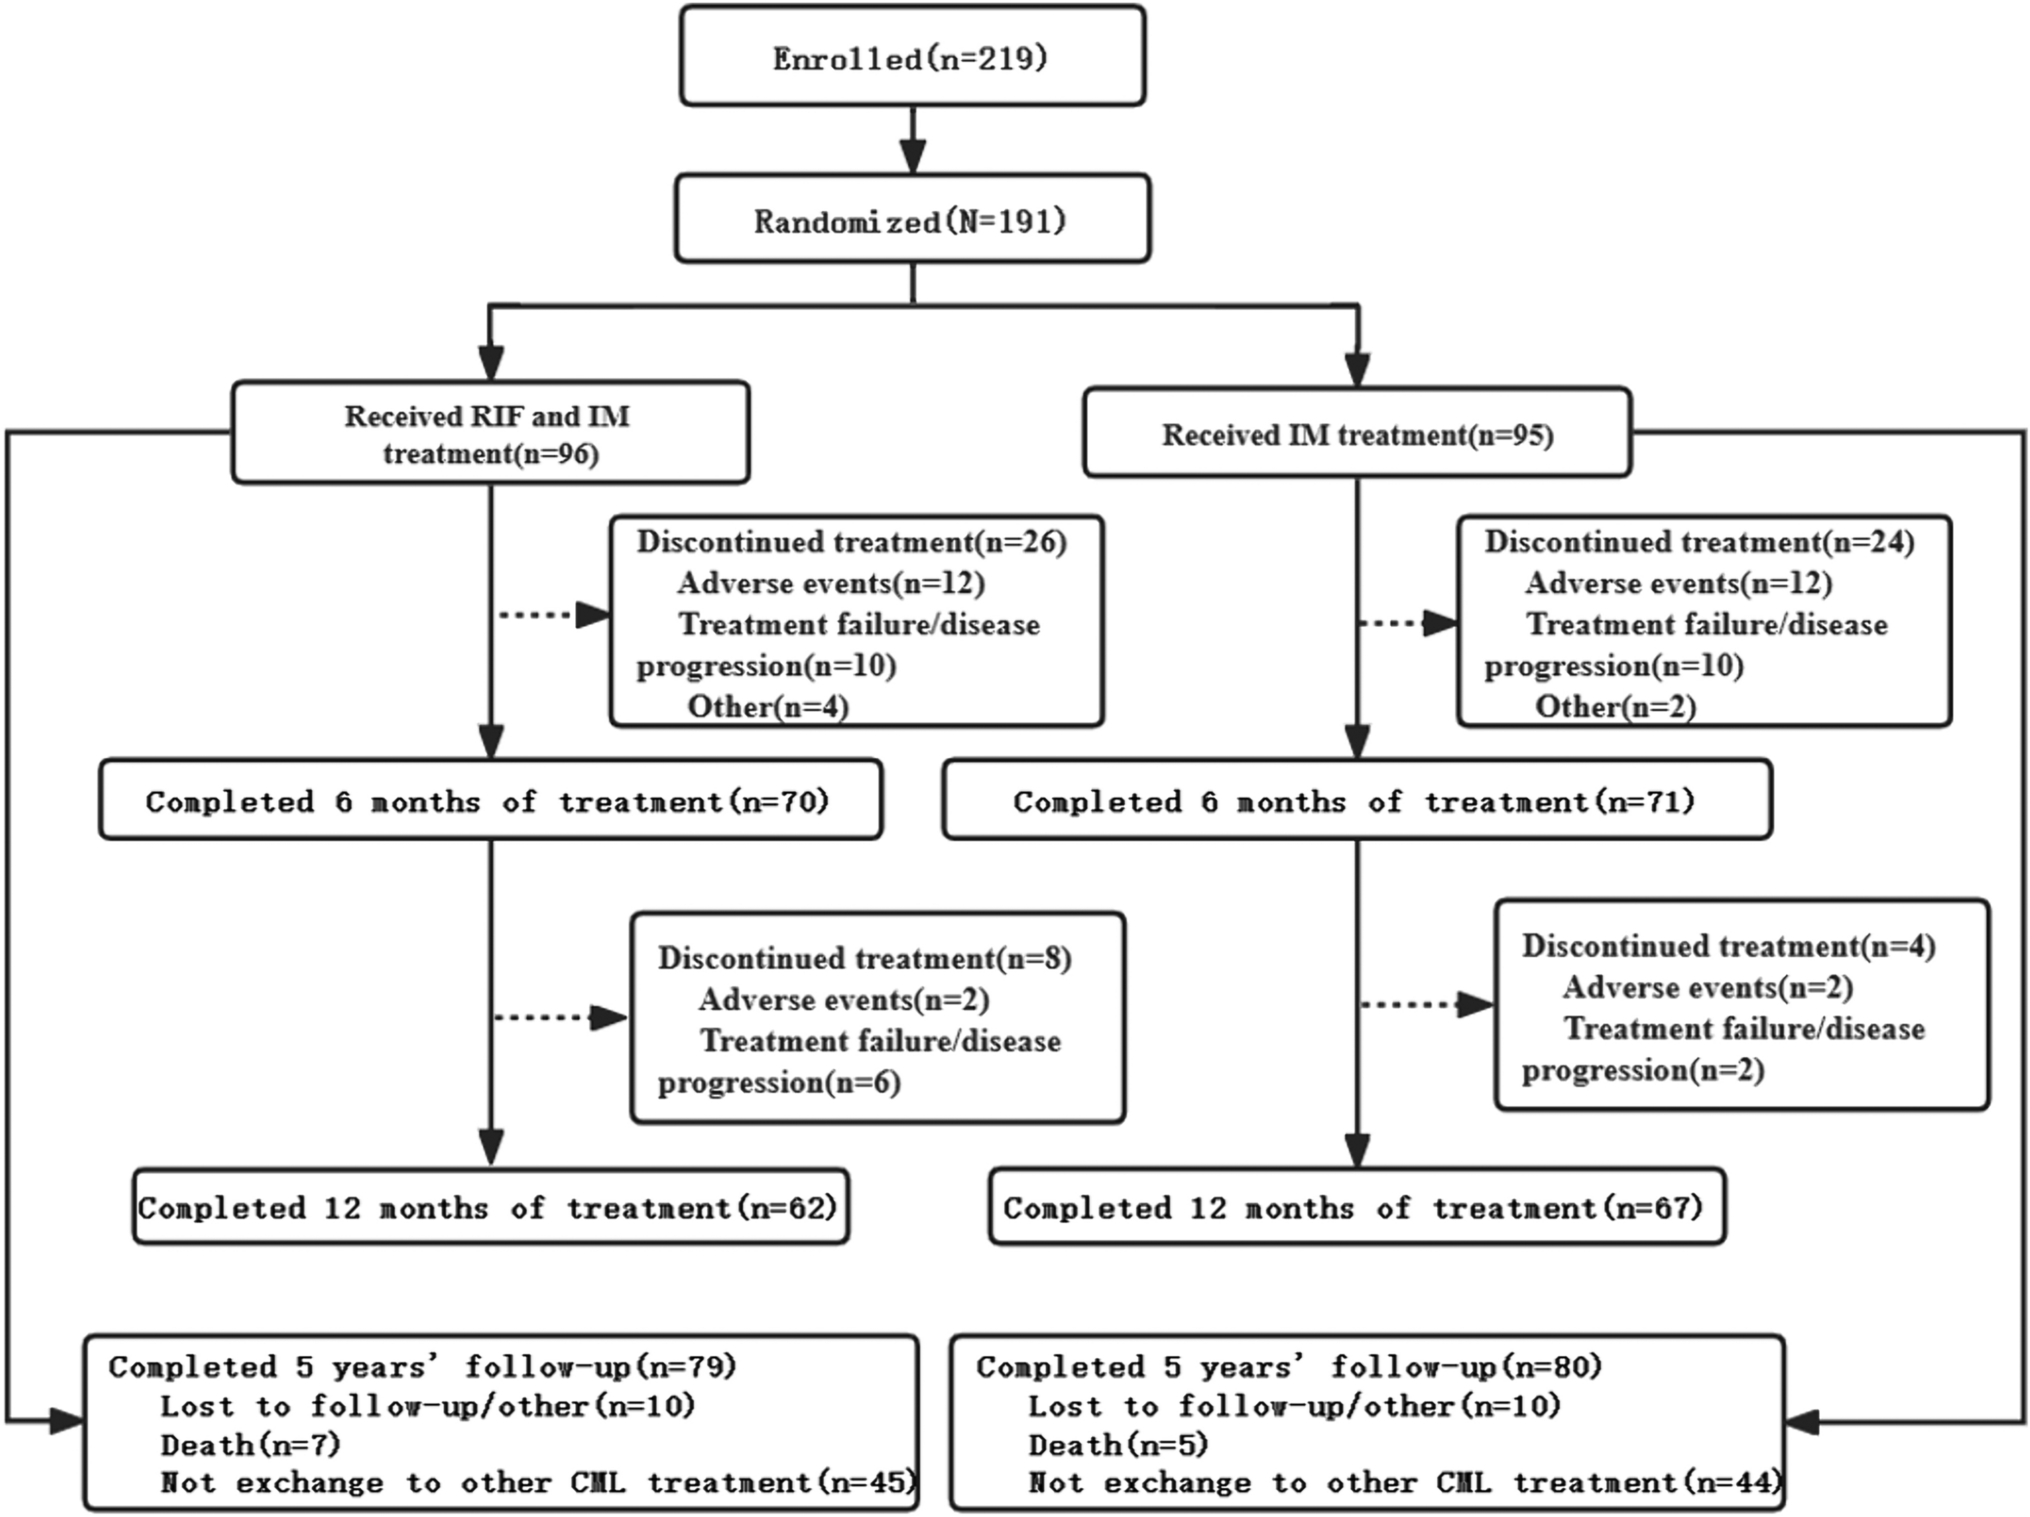
Between December 4, 2018, and February 3, 2022, 210 patients were screened, of whom 47 were excluded and 163 were enrolled. The 163 included patients with BCLC-C HCC were assigned to three groups: initial hepatic artery intervention plus PD-1 inhibitors plus targeted therapy (HPT, n = 66), PD-1 inhibitors plus targeted therapy followed by hepatic artery intervention (PTH, n = 56), and PD-1 inhibitors plus targeted therapy (PT, n = 41) (Fig. 1).
Fig. 1 Baseline demographics and clinical characteristics
The baseline demographics and clinical characteristics were well balanced among the three groups (Table 1). The mean age of patients in the PT group was slightly older than that in the HPT and PTH groups. Most patients were male (82.93–91.07%), but the percentages of males and females in each group were balanced. PS = 1 and Child‒Pugh A were dominant in each group, accounting for approximately 75–89%. The number of patients with AFP greater than 400 ng/ml in the PTH group and PT group was slightly higher than that in the HPT group. Other characteristics were similarly distributed in each group, such as laboratory tests, liver cirrhosis, tumor thrombus, extrahepatic metastasis, smoker status, alcoholism, and medical history.
Table 1 Baseline clinical characteristics of patientsAs of May 10, 2022 (data cutoff), the median follow-up time was 18.3 months (95% CI 16.7 to 20.0 months); the cycles of PD-1 inhibitors plus targeted therapy in the HPT group, PTH group, and PT group were 2–29, 2–16, and 2–28, respectively; and the median cycles were 4.5, 5, and 5, respectively. The catalog of PD-1 inhibitors and targeted medicine in each group is shown in Table S2.
Survival analysisBy the end of follow-up period, 150 of 163 (92.02%) patients had disease progression, including 57 of 66 (86.36%) in the HPT group, 53 of 56 (94.64%) in the PTH group, and 40 of 41 (97.56%) in the PT group.
The progression-free survival benefit with cotreatment of targeted therapy (HPT), initial hepatic artery intervention, and PD-1 inhibitors was shown in the three groups (Fig. 2A). An HR of 0.60 (95% CI 0.39–0.92, p = 0.01) for the comparison was recorded (Fig. 2B). The median progression-free survival was 8.37 months (95% CI 6.35–10.39) with HPT versus 6.33 months (95% CI 3.75–8.92) with PT. Similar results were observed for HPT versus PTH, with an HR of 0.66 (95% CI 0.45–0.97, p = 0.027) for the comparison (Fig. 2C), and the median PFS with PTH was 5.3 months (95% CI 3.48–7.12). However, there was no difference in PFS between the PTH and PT groups (HR 0.93, 95% CI 0.61–1.40, p = 0.72) (Fig. 2D). The 6-month and 12-month PFS rates of the HPT group were 69.7% and 34.8%, respectively, which were better than those of the other two groups. The 6-month and 12-month PFS rates in the PTH and PT groups were 44.6% and 53.7% and 19.6% and 17.1%, respectively.
Fig. 2
Kaplan–Meier curves of survival outcomes of patients in the three groups. A Comparison of progression free survival among three groups. B The PFS comparison between HPT and PT (B), HPT and PTH (C), PTH and PT (D). E Comparison of overall survival among three groups. The OS comparison between HPT and PT (F), HPT and PTH (G), PTH and PT (H). HPT initial hepatic artery intervention combined with immunotarget therapy; PTH immunotarget therapy sequential hepatic artery interventional therapy; PT immunotarget therapy only
At the time of data cutoff, 110 of 163 (67.5%) patients had died, including 39 of 66 (59.1%) patients in the HPT group, 39 of 56 (69.6%) patients in the PTH group, and 32 of 41 (78.0%) in the PT group. All patients died due to progressive disease.
In the HPT, PTH, and PT groups, 27/66 (40.9%), 17/56 (30.4%) and 9/41 (22%) patients failed to reach OS. According to the current data analysis, the median overall survival was 14.6 months (95% CI 10.6–18.7) in the combined therapy group (HPT) versus 10.0 months (95% CI 8.2–11.8) in the sequential therapy group (PTH) versus 11.3 months (95% CI 8.3–14.3) in the immunotarget therapy group (PT). The 1-year OS rates in the HPT, PTH, and PT groups were 50%, 33.9%, and 34.1%, respectively, while in the 18-month group, OS rates were 21.2%, 14.3%, and 7.3%, respectively. Overall survival in the HTP group showed a survival benefit among the three groups (Fig. 2E). Overall survival was significantly longer in the HTP group than in the PT group with an HR of 0.60 (95% CI 0.361–0.996; p = 0.032; Fig. 2F). Compared with the PTH group, the overall survival of the HTP group had a prolonged survival trend with an HR of 0.66 (95% CI 0.416–1.032; p = 0.059; Fig. 2G). However, there was no significant difference in overall survival between the PTH and PT groups with an HR of 0.92 (95% CI 0.572–1.491; p = 0.743; Fig. 2H).
In pairwise comparisons of the three treatment groups, only the HPT group versus the PT group showed significant differences in overall survival, so subgroup analysis based on the baseline demographics and clinical characteristics of the HPT group and the PT group suggested that HPT was superior to PT in collective patient survival. Subgroup analysis is summarized in Fig. 3.
Fig. 3
Forest plot for overall survival and progression free survival of the matched cohorts of patients. HPT initial hepatic artery intervention combined with immunotarget therapy; PT immunotarget therapy only
Preliminary efficacyAs of May 10, 2022, 2 patients achieved a complete response (CR), and 38/66 (57.6%) achieved a partial response (PR) as their best response in the HPT group, which was significantly better than the PTH and PT groups. The overall response rate (ORR) of the HPT group was 60.6%, which was significantly higher than that of the PTH (32.1%) and PT (22%) groups. The disease control rate (DCR) of the HPT group was 84.8%, which was the highest among the three groups (Table 2).
Table 2 Summary of best responseTolerability and safetyAll patients tolerated treatment, and none of the patients discontinued treatment or died as a result of adverse events. The adverse events with an incidence of more than 10% in all three groups were fatigue and appetite loss. The incidence of gastrointestinal reactions was higher in the hepatic artery intervention combined and sequential therapy groups than in the immunotarget therapy group. The most common grade 3 or 4 adverse events were nausea and appetite loss. There were no significant differences in adverse events among the three treatment groups (Table 3).
Table 3 Treatment-related adverse eventsPrognostic factor analysisUnivariate and multivariate prognostic factor analyses for overall survival and progression-free survival are summarized in Table. Multivariate analysis identified that initial hepatic artery intervention combined with immunotarget therapy (HPT), serum albumin level > = 40, Child‒Pugh A, and hepatectomy history were independent prognostic factors of OS and PFS. In addition, a platelet level > = 100 was also found to be an independent prognostic factor of PFS but not of OS (Table 4).
Table 4 Univariate and multivariate analysis of risk factors for overall survival and progression-free survival
留言 (0)