In the July 2022 issue of A&A Practice, the article by Kuk et all, “Bedside Diagnosis of Pulmonary Embolism Using Electrical Impedance Tomography: A Case Report,” contained an error in the figure legends for Figure 1 and Figure 2.
The legends for Figures 1 and 2 incorrectly read as follows:
Figure 1. PEEP titration to optimize respiratory mechanics as measured via EIT. At a PEEP of 14cm H2O, lung compliance is maximized while hyperdistention is minimized. PEEP indicates positive end-expiratory pressure; EIT, electrical impedance tomography.
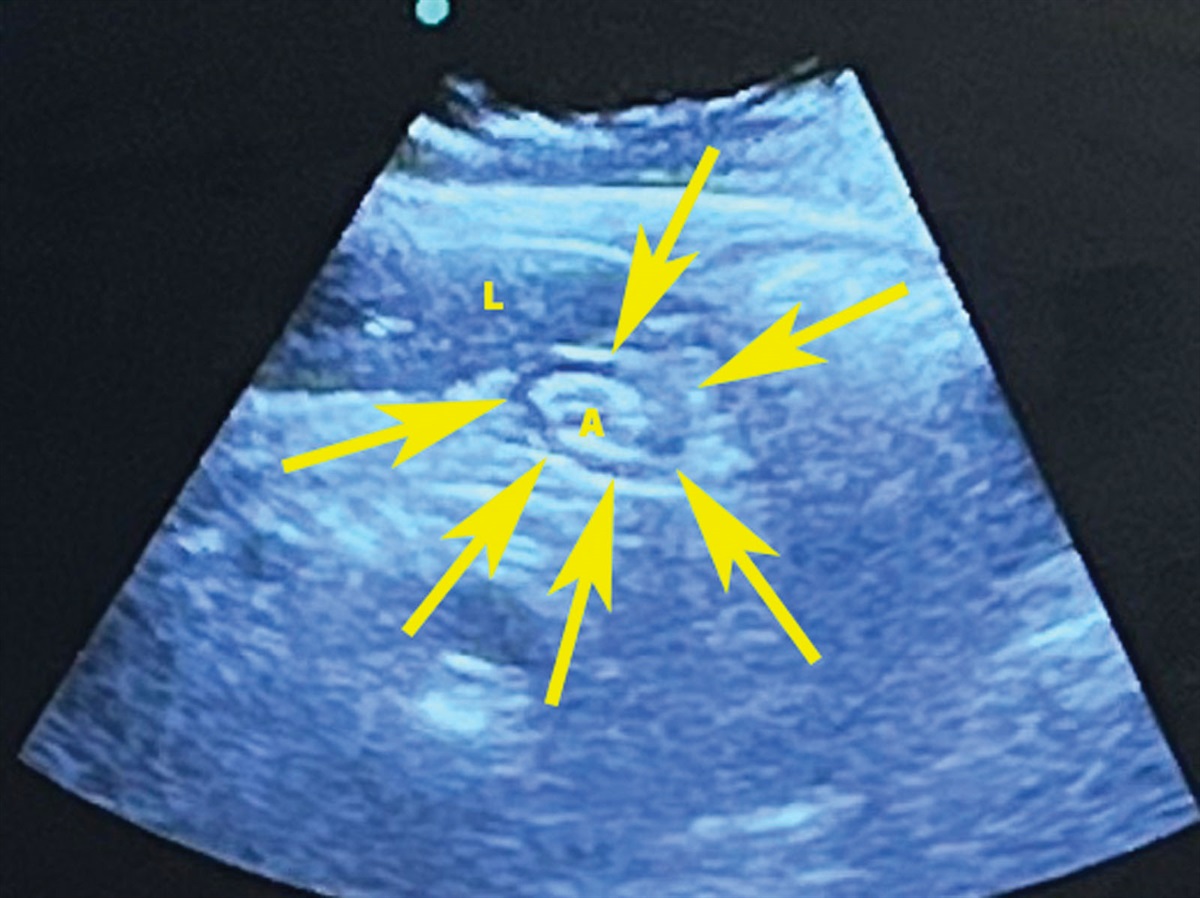
Figure 2. Ventilation/perfusion distributions as measured on EIT using a hypertonic saline bolus during an end-expiratory hold. On the perfusion map, high-perfusion regions are bright, and low-perfusion areas are darker shades of red. On the ventilation map, high-ventilated regions are bright, while low-ventilated regions are darker shades of blue. The map demonstrates that the right anterior portion of the lung has the largest V/Q mismatch, with ventilation distribution at 21% with minimal corresponding perfusion (only at 1%), suggesting dead space from presumed pulmonary embolism at that location. A indicates anterior; EIT, electrical impedance tomography; L, left; R, right; V/Q, ventilation-perfusion.
The legends for Figures 1 and 2 should read as follows:
Figure 1. PEEP titration to optimize respiratory mechanics as measured via EIT. At a PEEP of 14 cm H2O, lung compliance is maximized while hyperdistention is minimized. PEEP indicates positive end-expiratory pressure; EIT, electrical impedance tomography. Figure used by permission. Copyright Pedro Mendez-Tellez, MD, Johns Hopkins Hospital. All permission requests for this image should be made to the copyright holder.
Figure 2. Ventilation/perfusion distributions as measured on EIT using a hypertonic saline bolus during an end-expiratory hold. On the perfusion map, high-perfusion regions are bright, and low-perfusion areas are darker shades of red. On the ventilation map, high-ventilated regions are bright, while low-ventilated regions are darker shades of blue. The map demonstrates that the right anterior portion of the lung has the largest V/Q mismatch, with ventilation distribution at 21% with minimal corresponding perfusion (only at 1%), suggesting dead space from presumed pulmonary embolism at that location. A indicates anterior; EIT, electrical impedance tomography; L, left; R, right; V/Q, ventilation-perfusion. Figure used by permission. Copyright Pedro Mendez-Tellez, MD, Johns Hopkins Hospital. All permission requests for this image should be made to the copyright holder.
Additionally, the following acknowledgement should have been included:
“The authors would like to acknowledge and thank Dr. Pedro Mendez-Tellez, MD for the use of his figures in this publication.”
The authors regret this error. The online version of the article has been corrected.
Kuk W-J, Wright NR. Bedside diagnosis of pulmonary embolism using electrical impedance tomography: a case report. A A Pract. 2022;16:e01606.


留言 (0)