
記住我
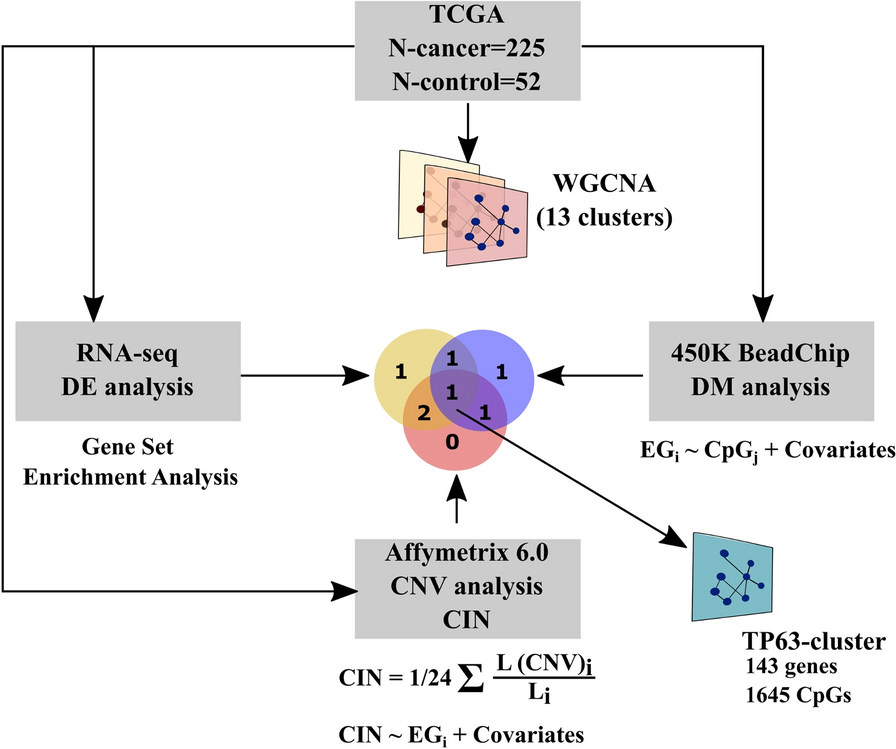
We hypothesized that using nucleosome positioning and repelling sequences we could change where nucleosomes form on transgenes in living C. elegans. To this end, we inserted various DNA sequences into a plasmid we made, pBYU1, that was derived from the well-characterized Fire Lab plasmid pPD151.79 (see methods). The pPD151.79 plasmid has a promoter that drives green fluorescent protein (gfp) expression in pharyngeal muscle cells in C. elegans. Expression of GFP in these cells was used as an internal control to confirm maintenance of the transgene in transgenic worms. The pPD151.79 plasmid also has an unc-54 enhancer in it. We modified the unc-54 enhancer to be only 90 bp, to form a minimal unc-54 enhancer. It is around this minimal enhancer that we inserted our various nucleosome-positioning elements to attempt to influence local nucleosome positions and ascertain whether gene regulatory elements affected the chromatin manipulating sequences’ ability to alter the chromatin landscape. The minimal enhancer was used because its 90 bp length would be too short to allow a nucleosome to form on the enhancer if it were flanked by positioned nucleosomes due to the inserted chromatin manipulating sequences (Fig. 2). Constructs pBYU9, pBYU14, and pBYU18 all harbor putative nucleosome-positioning sequences, while pBYU28, pBYU29, pBYU41, and pBYU44 have putative nucleosome-repelling sequences. pBYU1 serves as a control construct with neither positioning nor repelling sequences (Table 1). In constructs pBYU9, pBYU18, pBYU28, pBYU29, and pBYU41 putative nucleosome positioning/repelling sequences were inserted on both sides of the enhancer. This was to elucidate how these sequences would work in tandem with each other and with regard to the enhancer element.
Fig. 2
Depiction of transgene constructs. pBYU1(the control construct) with the unc-54 minimal enhancer (blue). pBYU9, pBYU14, and pBYU18 have putative nucleosome positioning [601(orange) or Trifonov (purple)] elements around the unc-54 minimal enhancer. pBYU28, pBYU29, pBYU41, and pBYU44 were used to test putative repelling elements; pBYU28 with 20 bp poly-A repeats (red), pBYU29 with the 70 bp PRS-322 sequence (black), pBYU41 with forward- and reverse-oriented 5 bp poly-T sequences (turquoise), and pBYU44 with an AAAAAcAAAAA sequence (dark blue) downstream of the unc-54 minimal enhancer (blue)
Table 1 Transgene construct purposes and modificationsConfirmation of changes in transgene nucleosome occupancyWe expected that the above modifications made to our transgenes would result in modified nucleosome positions on the transgenes in vivo as hypothesized. When injected into worms, these transgenes form repetitive extra-chromosomal arrays that are transmitted from generation to generation in C. elegans. Thus, we isolated transgene nucleosome DNA cores from these in vivo arrays by MNase digestion and selective hybridization [9, 16, 17]. Transgene nucleosome occupancy and positioning were assessed through next generation sequencing of the isolated DNA cores. We observed drastic changes in nucleosome occupancy and positioning on our transgenes in vivo (Figs. 3, 4, and 5).
Fig. 3
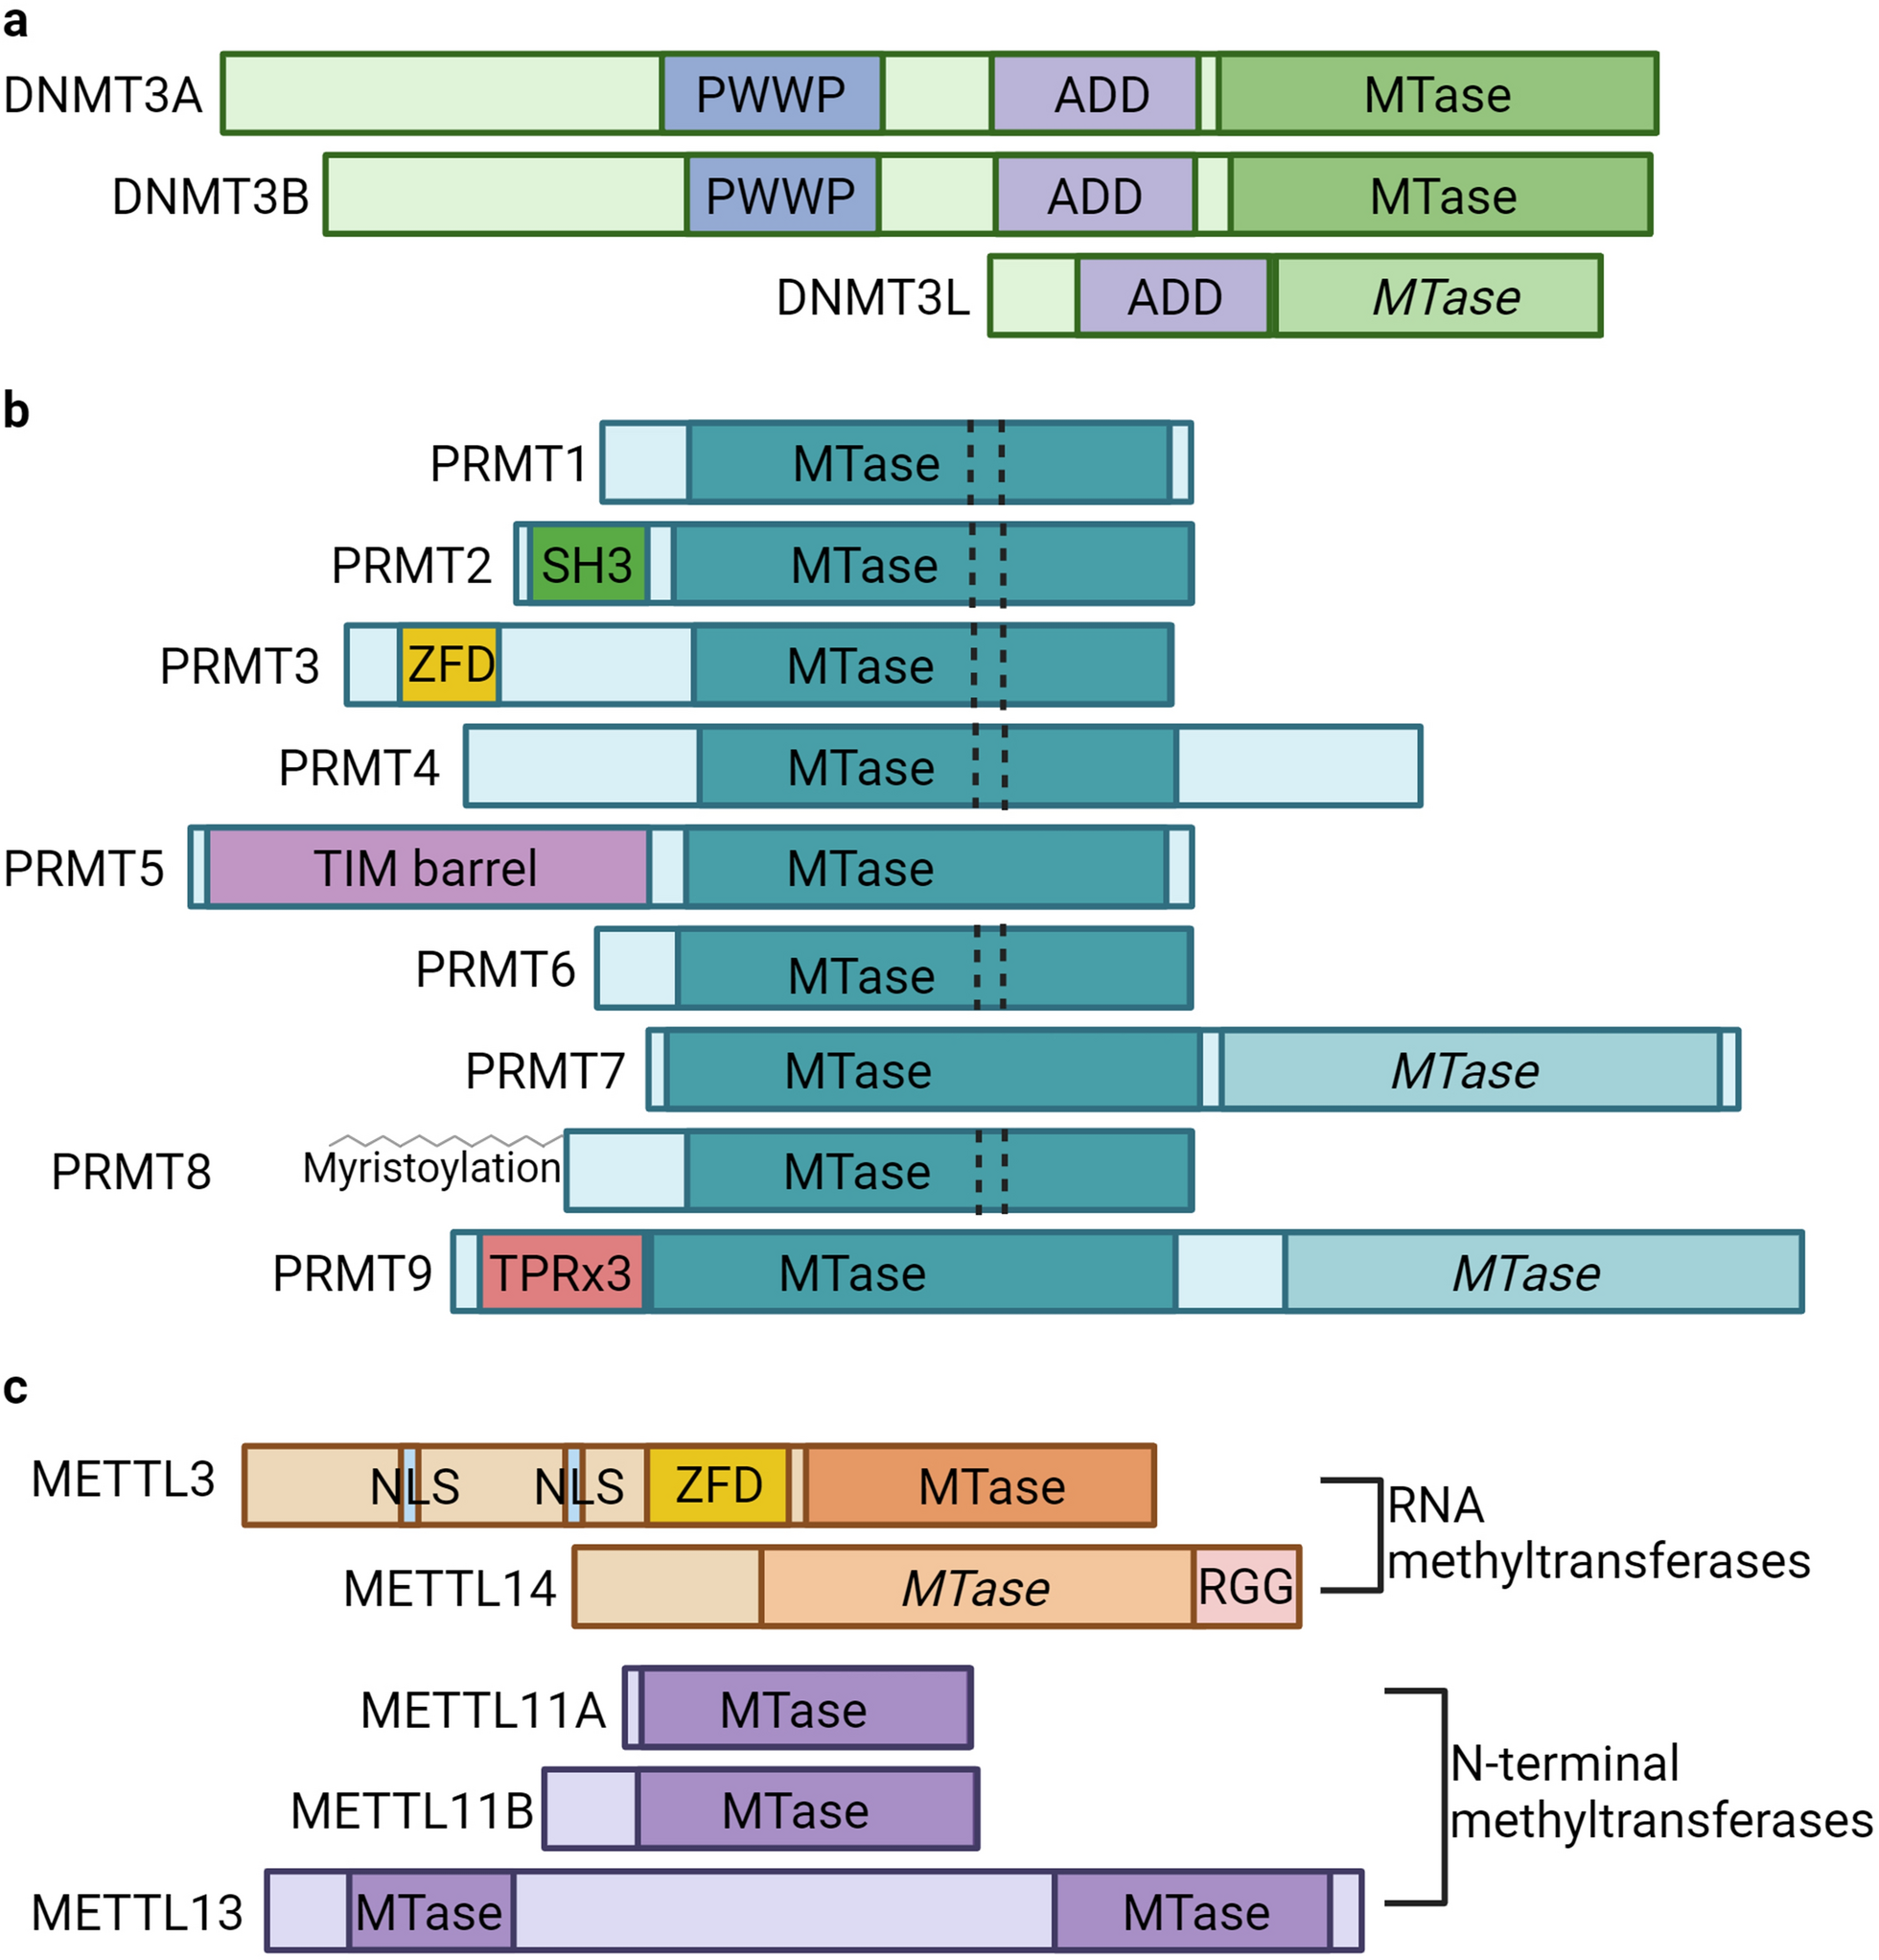
Nucleosome occupancy, the overall number of nucleosomes bound to DNA at a given locus. In all constructs the unc-54 minimal enhancer locus is present and highlighted in blue with the enhancer center designated as the origin and the x-axis numbering in base pairs. The y-axis is the normalized nucleosome occupancy. A pBYU1, with only the unc-54 minimal enhancer locus. b pBYU9 with the Trifonov sequence loci highlighted in purple. C pBYU14 with the 601 sequence locus in orange. D pBYU18 with the two 601 sequence loci in orange. E pBYU29 with the two 70-bp PRS-322 loci in gray. F pBYU28 with the two 20-bp poly-A runs highlighted in red. G pBYU41 with the forward and reverse 5-bp poly-T runs in light blue. H pBYU44 with the single AAAAAcAAAAA sequence locus in dark blue
Fig. 4
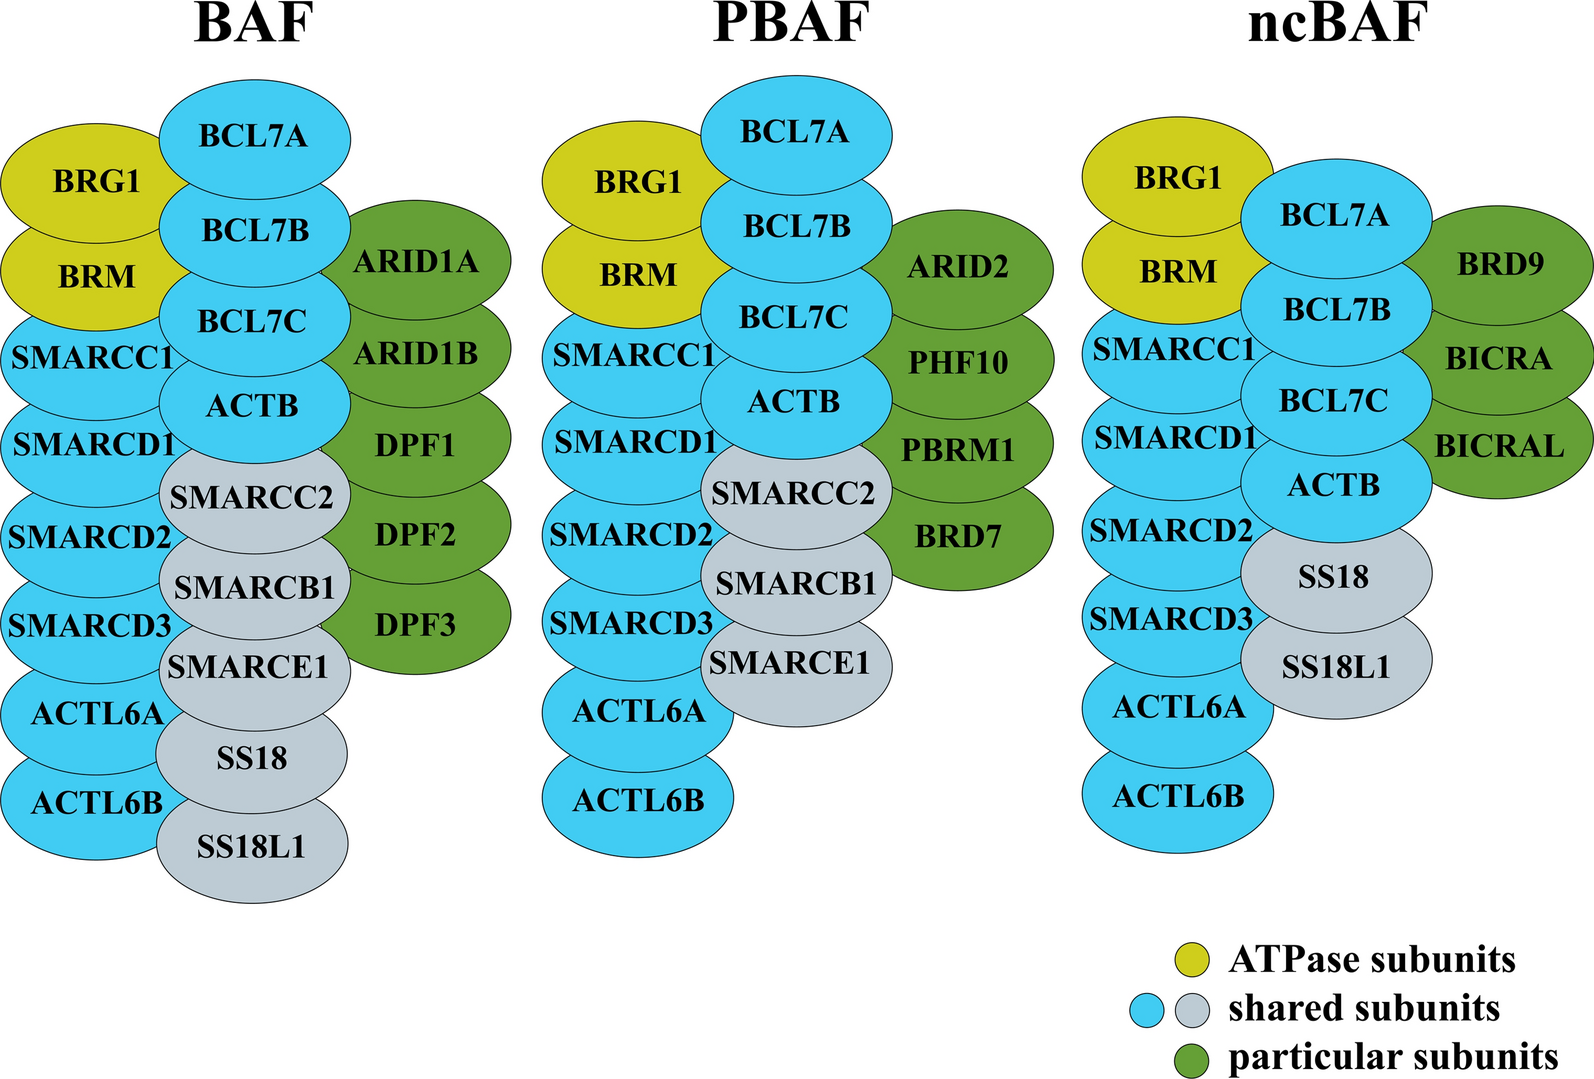
Comparative nucleosome occupancy of regions flanking the unc-54 enhancer and inserted elements. A Nucleosome occupancy for the flanking regions for pBYU1 (dashed black) compared to the flanking regions from transgenes with positioning elements: pBYU9 (red), pBYU14 (blue), pBYU18 (green). B Nucleosome occupancy for the flanking regions for pBYU1 (dashed black) compared to the flanking regions from transgenes with repelling elements: pBYU28 (purple), pBYU29 (orange). C Nucleosome occupancy for the flanking regions for pBYU1 (dashed black) compared to the flanking regions from transgenes with repelling elements derived from the de Boer analysis: pBYU41 (brown), pBYU44 (yellow). For all three graphs, the unc-54 enhancer and the inserted positioning/repelling sequences have been removed with position 0 being where those elements would have been located. Negative x-axis values are the number of base pairs upstream, and positive X-axis values are the number of base pairs downstream of these elements
Fig. 5
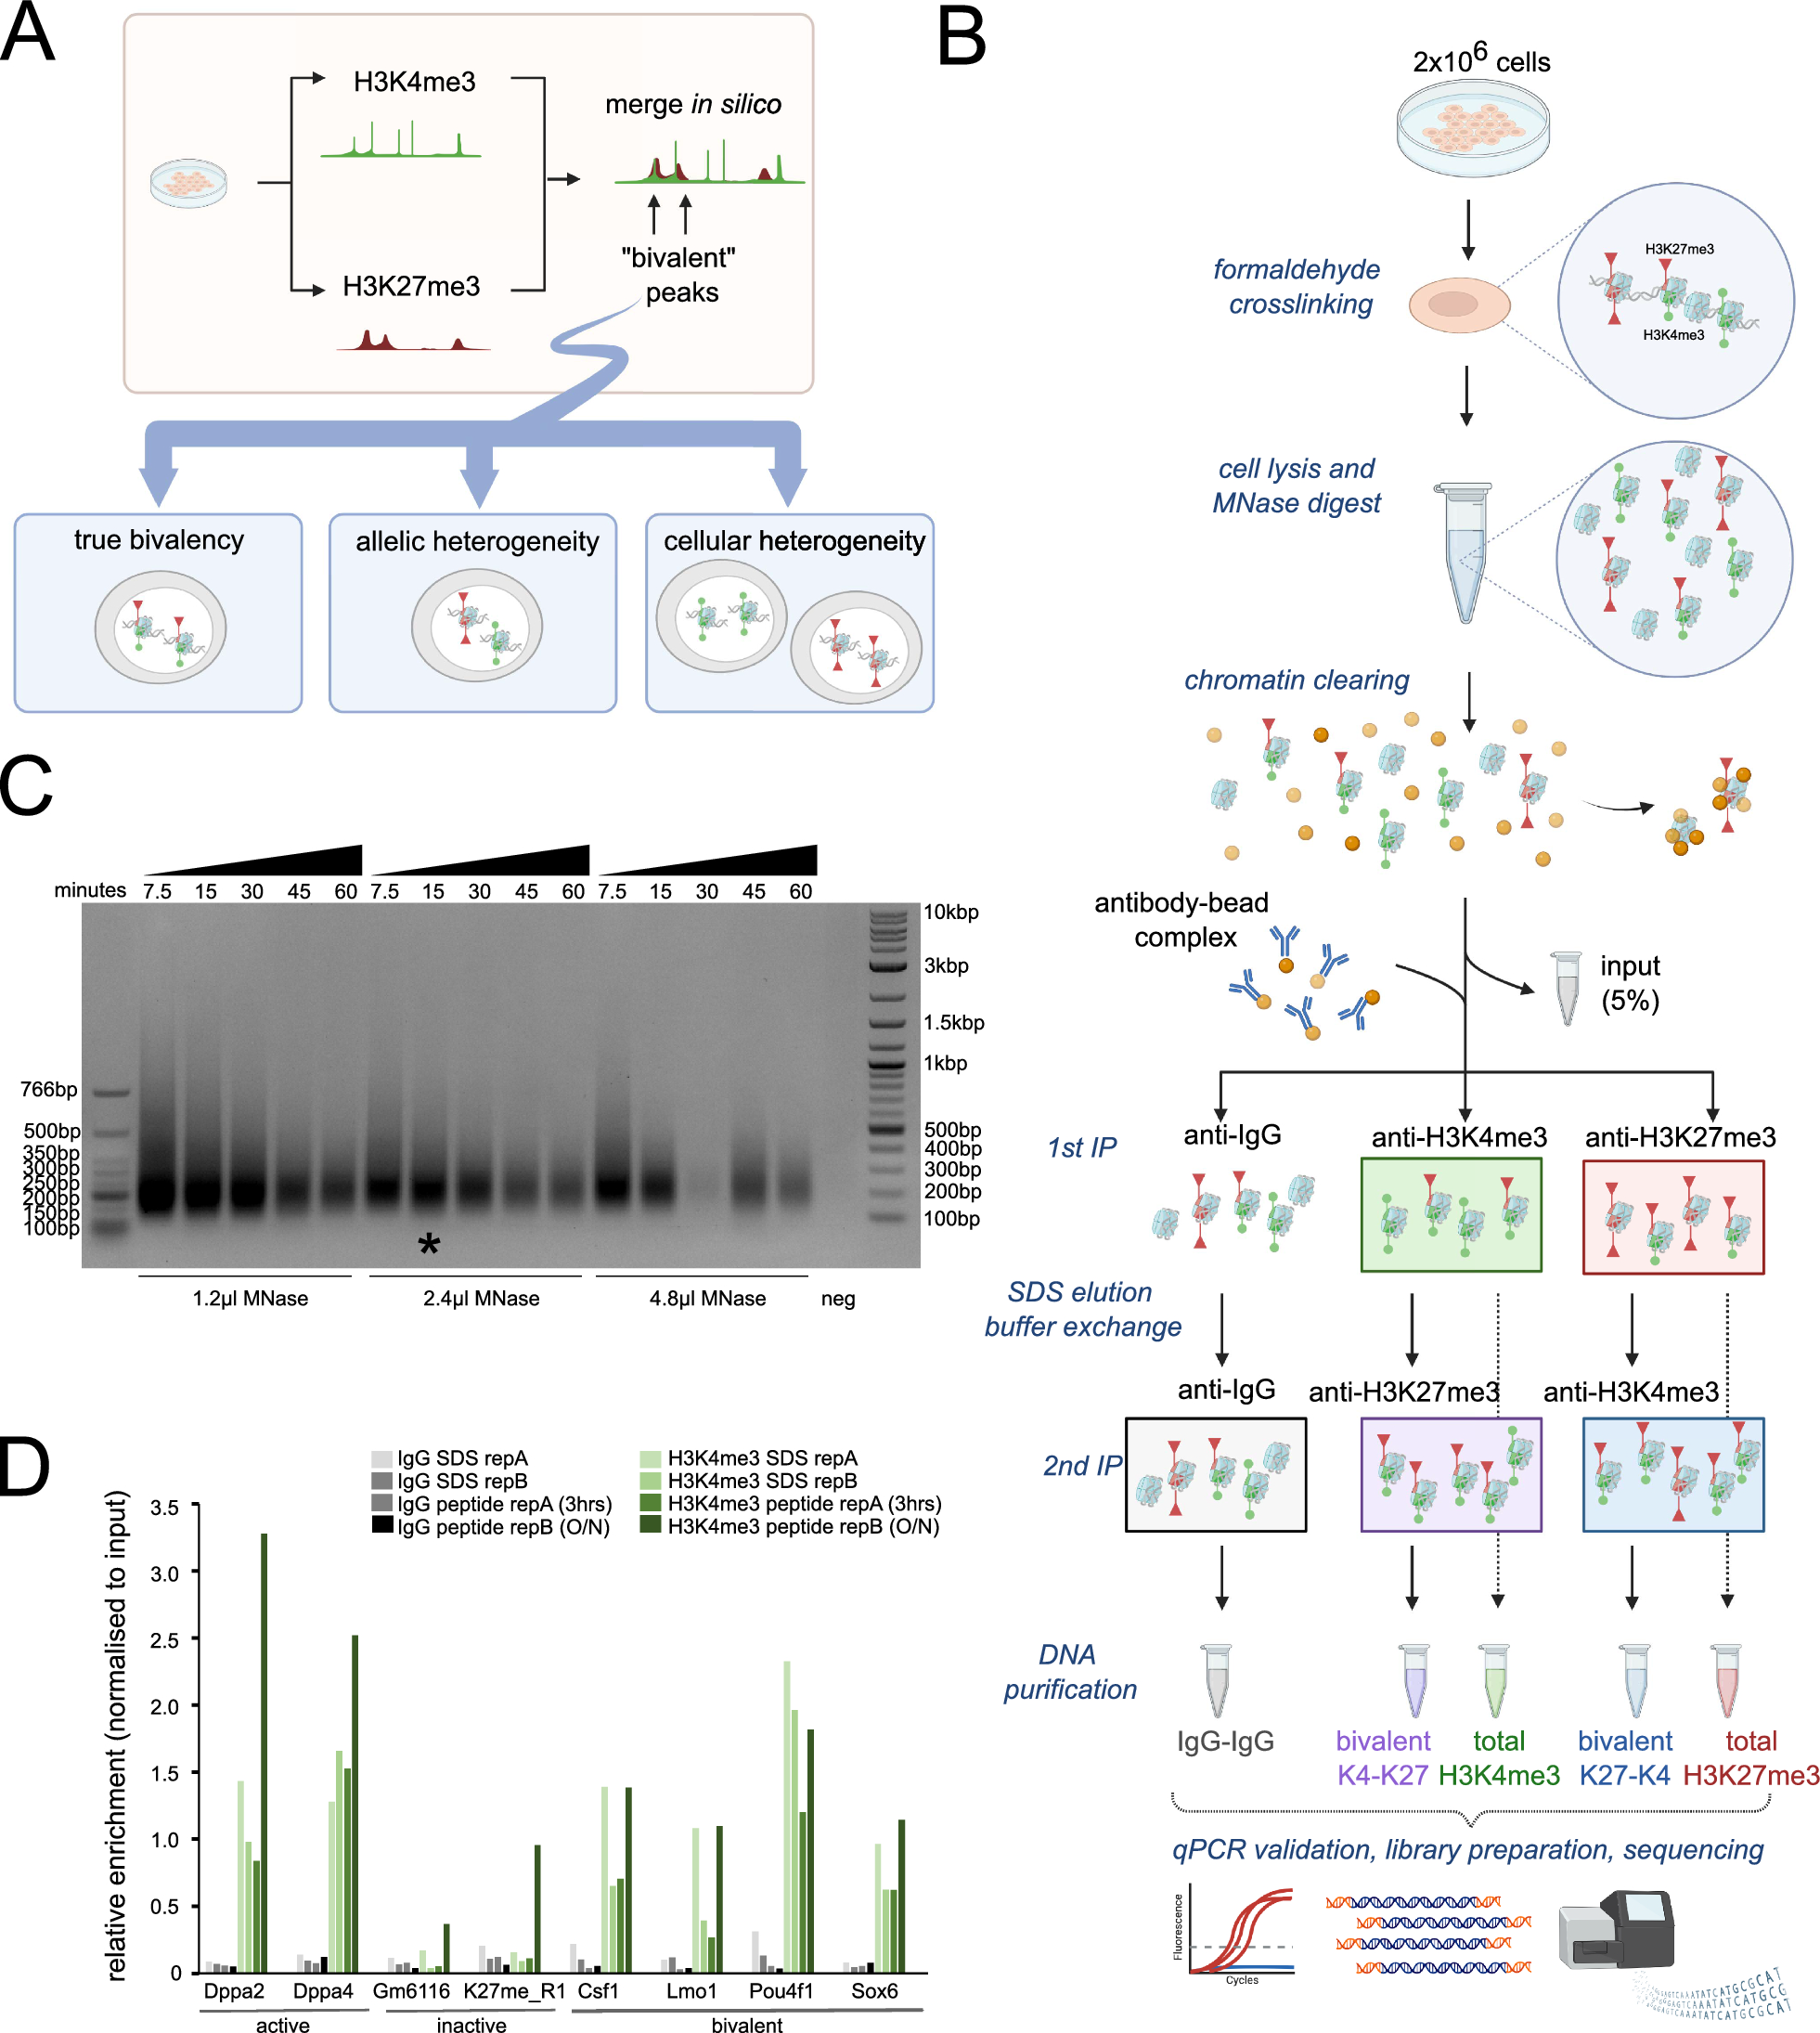
Nucleosome positioning, the percent of nucleosomes (dyads) positioned within a 21-bp window surrounding a locus compared to all the nucleosomes (dyads) within the 301-bp window surrounding that same locus. As in Fig. 3, in all constructs, the unc-54 minimal enhancer locus is present and highlighted in blue with the enhancer center designated as the origin and the x-axis numbering in base pairs. The y-axis is the percent nucleosome positioning score represented as a decimal. A pBYU1, with only the unc-54 minimal enhancer locus. B pBYU9 with the Trifonov sequence loci highlighted in purple. C pBYU14 with the 601 sequence locus in orange. D pBYU18 with the two 601 sequence loci in orange. E pBYU29 with the two 70 bp PRS-322 loci in gray. F pBYU28 with the two 20 bp poly-A runs highlighted in red. G pBYU41 with the forward and reverse 5 bp poly-T runs in light blue. H pBYU44 with the single AAAAAcAAAAA sequence locus in dark blue
Nucleosome occupancy is defined as the overall number of nucleosomes bound to DNA at a given locus. As shown in Fig. 3, in vivo nucleosome occupancy levels decreased at the unc-54 minimal enhancer locus (unc-54 locus) on transgenes with the added positioning elements (pBYU9, pBYU14, and pBYU18), when compared to pBYU1. The same decrease was seen in all transgenes with repelling sequences (pBYU28, pBYU29, pBYU41, and pBYU44). However, this decrease was less pronounced on transgenes pBYU41 and pBYU44. The decrease was much more pronounced on transgenes pBYU28 and pBYU29 in transgenic lines, with virtually no nucleosomes occupancy at the unc-54 locus in pBYU29 (Fig. 3E) which harbored our novel PRS-322 sequence. The amount of nucleosome occupancy on the unc-54 enhancer was calculated for each construct and compared to the control (pBYU1). Table 2 shows the total normalized occupancy and the total normalized occupancy divided by the normalized occupancy of pBYU1. We see that all of our modifications resulted in reduced nucleosome occupancy, but that pBYU 29 (the PRS) virtually eliminated nucleosome occupancy by reducing occupancy on the unc-54 enhancer by 99%.
Table 2 Normalized occupancy at the unc-54 lociBeyond nucleosome occupancy on the unc-54 enhancer, we wanted to see the effect of the introduced DNA elements on nucleosome occupancy both upstream and downstream of the inserted sequences. Occupancy in the flanking regions around the positioning/repelling/unc-54 loci were compared and quantified for each construct (Fig. 4). While nucleosome occupancy upstream of the added DNA sequences is very similar for all the constructs, occupancy downstream of the inserted sequences was altered for most of the constructs. Despite the upstream nucleosome occupancy pattern being generally the same as the control, we did see a steep drop in occupancy at position − 50, from 0.65 in pBYU1 to 0.1 in both pBYU28 and pBYU29. A similar upstream drop is seen in pBYU14 and pBYU18, with more moderate drops at pBYU9, pBYU41 and pBYU42.
Downstream nucleosome occupancy was much more affected. Specifically, in the case of the nucleosome-positioning elements (pBYU14, pBYU18 and pBYU9), all have a similar profile downstream of the elements: the first downstream peak is reduced from 0.9 in the control to 0.6 in the pBYU14 and even more reduced down to 0.25 and 0.4 for pBYU18, and pBYU9, respectively, at position + 75. At position + 150 we see a valley that is nearly identical across all three constructs and control. Downstream of that position the general profile is the same, but reduced by approximately 10 to 50 percent across the three constructs compared to the control. Two of the repelling sequences (pBYU28 and pBYU29) have reduced downstream occupancy with similar profiles as well. Downstream, at position + 50 we see a complete loss of the first downstream peak with a drop from 0.8 in the control to 0.3 in pBYU28 and 0.1 in pBYU29. We also see the downstream occupancy in these constructs peak at position + 135 at 0.55 in pBYU28 and position + 185 at 0.3 in pBYU29. This is in juxtaposition to the valley in the control over the same positions. The other two repelling sequences (pBYU42 and pBYU44) had minimal downstream occupancy changes, with a profile similar to the unmodified pBYU1. Interestingly there is a peak at position + 125 in both pBYU42 and pBYU44 that is absent in the control, and in these two constructs we see a decrease in the relative depth of valley at position + 135 relative to the control.
Confirmation of changes in transgene nucleosome positioningNucleosome positioning is the number of nucleosome dyads within 20 bp of a locus compared to the number of nucleosome dyads within 300 bp (150 bp on either side) of said locus [9]. It is interesting to note that in our transgenes, while the overall nucleosome occupancy was not high at the Trifonov or 601 sequences (Fig. 3B, C, D), the nucleosome positioning at the 601 sequences, particularly in pBYU14, was very strong with a positioning score of 0.450655359 at the center of the 601 sequences for this construct (Fig. 5C). A positioning score of 1 would indicate perfect (100%) nucleosome positioning. The 601 sequences in pBYU18 have strong positioning scores of 0.285016287 and 0.302695, upstream and downstream of the unc-54 locus, respectively (Table 3, Fig. 5D). Thus, all the elements tested affect nucleosome formation and/or location, with the 601 sequence being particularly effective at positioning nucleosomes in C. elegans in vivo. The Trifonov sequence, on the other hand, demonstrated virtually no nucleosome-positioning ability in vivo with all positioning scores being less than 0.035, about an order of magnitude lower that the 601 positioning scores (Table 3).
Table 3 In vivo positioning scores for 601 and Trifonov elements
留言 (0)