Cell culture
Lncap cell line (5 passages, provided by the FuHeng Ltc., Shanghai, China) was digested with 1 mL 0.25% Trypsin Digestion solutions with EDTA (Solarbio, catalog number: T1350) at 37 °C for 50 s. The cells were cultured with androgen deprivation condition in culture medium RPMI Medium 1640(gibco, catalog number: 11835-030) with 10% Certified Foetal Bovine Serum (FBS) Charcoal Stripped (Biological Industries Pricelist, catalog number: 04-201-1 A), 1% GlutaMAX-I (gibco, catalog number: 35050-061) and 1% Sodium Pyruvate (gibco, catalog number: 11360-070). The culture medium was replaced every five days. Incubator until the cells get reach ~ 80% confluence to cell freezing or cell passage.
Cell treatment and cell morphology
The cells were placed in a 10-cm culture dish and co-cultured with Flutamide (Yuanye, Shanghaiyuanye Bio-Technology™, catalog number: H20A9Z68074), and sustained culture 60–80 passages at 37 °C. Flutamide’s concentrate was as follows: 0.1 µM during 0–20 passages, 0.5 µM during 21–40 passages, 2.5 µM during 41–60 passages. Cells were observed and photographed with an optical microscope (Mshot, Guangzhou, China).
Haematoxylin-eosin (HE) staining
After paraformaldehyde prefixed-coomassie, the cells were stained with haematoxylin for 15 min, followed by 1% hydrochloric acid alcohol differentiation for 10 s. Next, samples were held under a tap water flow for 15 min, and stained with eosin for 60 s until a proper stained color and neutral resin was sliced. Cells were observed with an optical microscope (EVOS FL Auto, life technologies, Japan).
Quantitative real time-polymerase chain reaction (qRT-PCR)
Total RNA was extracted from PCa cell lines by TRIzol reagents from Invitrogen/Life Technologies (Carlsbad, CA, USA) and reverse transcribed to complementary DNA (cDNA) by PrimeScript™ RT reagent Kit with gDNA Eraser (TaKaRa, Dalian, China). The primers were designed by PrimerBank (https://pga.mgh.harvard.edu/primerbank/) and synthesized by GenSys (GenSys, Guangxi, China). AR1, forward, 5’- CCAGGGACCATGTTTTGCC − 3’, reverse, 5’- CGAAGACGACAAGATGGACAA − 3’; AR2, forward, 5’-GACGACCAGATGGCTGTCATT-3’, reverse, 5’- GGGCGAAGTAGAGCATCCT-3’; FKBP5, forward, 5’- CTACACCTGCTGAAGGGACG − 3’, reverse, 5’- CTCCAGCAAACCCTGGTACA − 3’; STEAP1, forward, 5’-ACTGGGCACAATACACGCAT − 3’, reverse, 5’- GGTGACGTCTTCCCAACCAT-3’; ALCAM, forward, 5’-TCCTGCCGTCTGCTCTTCT-3’, reverse, 5’- TTCTGAGGTACGTCAAGTCGG − 3’; ESAM, forward, 5’-GGGGTCACAACAAGCAAACC-3’, reverse, 5’- TTGTCTTGCACATTCACGGAG-3’; ICAM1, forward, 5’- ATGCCCAGACATCTGTGTCC − 3’, reverse, 5’- GGGGTCTCTATGCCCAACAA − 3’; ICAM2, forward, 5’- CGGATGAGAAGGTATTCGAGGT − 3’, reverse, 5’- CACCCACTTCAGGCTGGTTAC − 3’; L1CAM, forward, 5’- TGTCATCACGGAACAGTCTCC − 3’, reverse, 5’- CTGGCAAAGCAGCGGTAGAT − 3’; MCAM, forward, 5’- AGCTCCGCGTCTACAAAGC − 3’, reverse, 5’- CTACACAGGTAGCGACCTCC − 3’; GAPDH, forward, 5’- GGAGCGAGATCCCTCCAAAAT − 3’, reverse, 5’- GGCTGTTGTCATACTTCTCATGG − 3’. qRT-PCR was performed at 95ºC for 600 s, followed by 35 cycles of 95 °C for 15 s, 61 °C for 60 s, and 72 °C for 10 s, melting of 95 °C for 10 s, 65 °C for 60 s, and 97 °C for 1 s, then cooling of 37 °C for 30 s used a LightCvcler 96. Glyceraldehyde-3-phosphate dehydrogenase (GAPDH) was selected as the internal reference. The relative expression of mRNA was calculated by the 2-∆∆Ct method.
Western blot
Total protein was extracted using cell lysis buffer (Beyotime, catalog number: P00138). Proteins were separated on a 10% SDS‑PAGE gels kit (PG112, Epizyme, Shanghai, China) and transferred onto PVDF membranes (Millipore, Billerica, MA, USA). After blocking with NcmBlot Blocking Buffer (Cat#P30500, NCM Biotech, Suzhou, China), and incubated with the primary antibodies at 4 ˚C overnight, followed by incubation with secondary antibodies (Goat Anti-Rabbit IgG-HRP, Abmart, Shanghai, China). Protein bands were developed with BeyoECL Plus (Beyotime) on an Image Quant LAS500 (GE Healthcare, JAPAN). The primary antibodies against rabbit polyclonal PSA (1:1 000, Abcam ab53774, Cambridge, MA, USA), rabbit monoclonal AR (1:3 000), rabbit monoclonal HK2 (1:3 000), rabbit polyclonal Βaction (1:2 000), (all from Cell Signaling Technology, Beverly, MA, USA). β-Actin was used as the loading control. Enzalutamide (1 μm/lml, A3003, APExBIO, Houston, USA ) was used as an AR inhibitor. The specific bands’ relative densities were quantified using the image detection software Image J software (Version 1.53 h).
5-Ethynyl-2’-Deoxyuridine (EdU) assay
The 100 T assay Cell-Light Apollo 567 Stain Kit (Cat#C10371-1, RIBBIO, Guangzhou, China) contains EdU, Apollo component reagent. EdU Assay 100 µl of diluted EdU (1:1000 in RPMI Medium 1640; gibco) was applied in each well of a 96-well plate and incubated in the dark for 4 h. After 100 µl of phosphate-buffered saline (PBS) washing 3 times for 5 min, paraformaldehyde was fixed for 30 min, 100 µl of glycine and 100 µl of Triton X-100 were separated for 10 min and finally, 200 µl of Hoechst was applied and cultured in the dark for 20 min. Eventually, EdU-labeled and Hoechst-stained cells were captured.
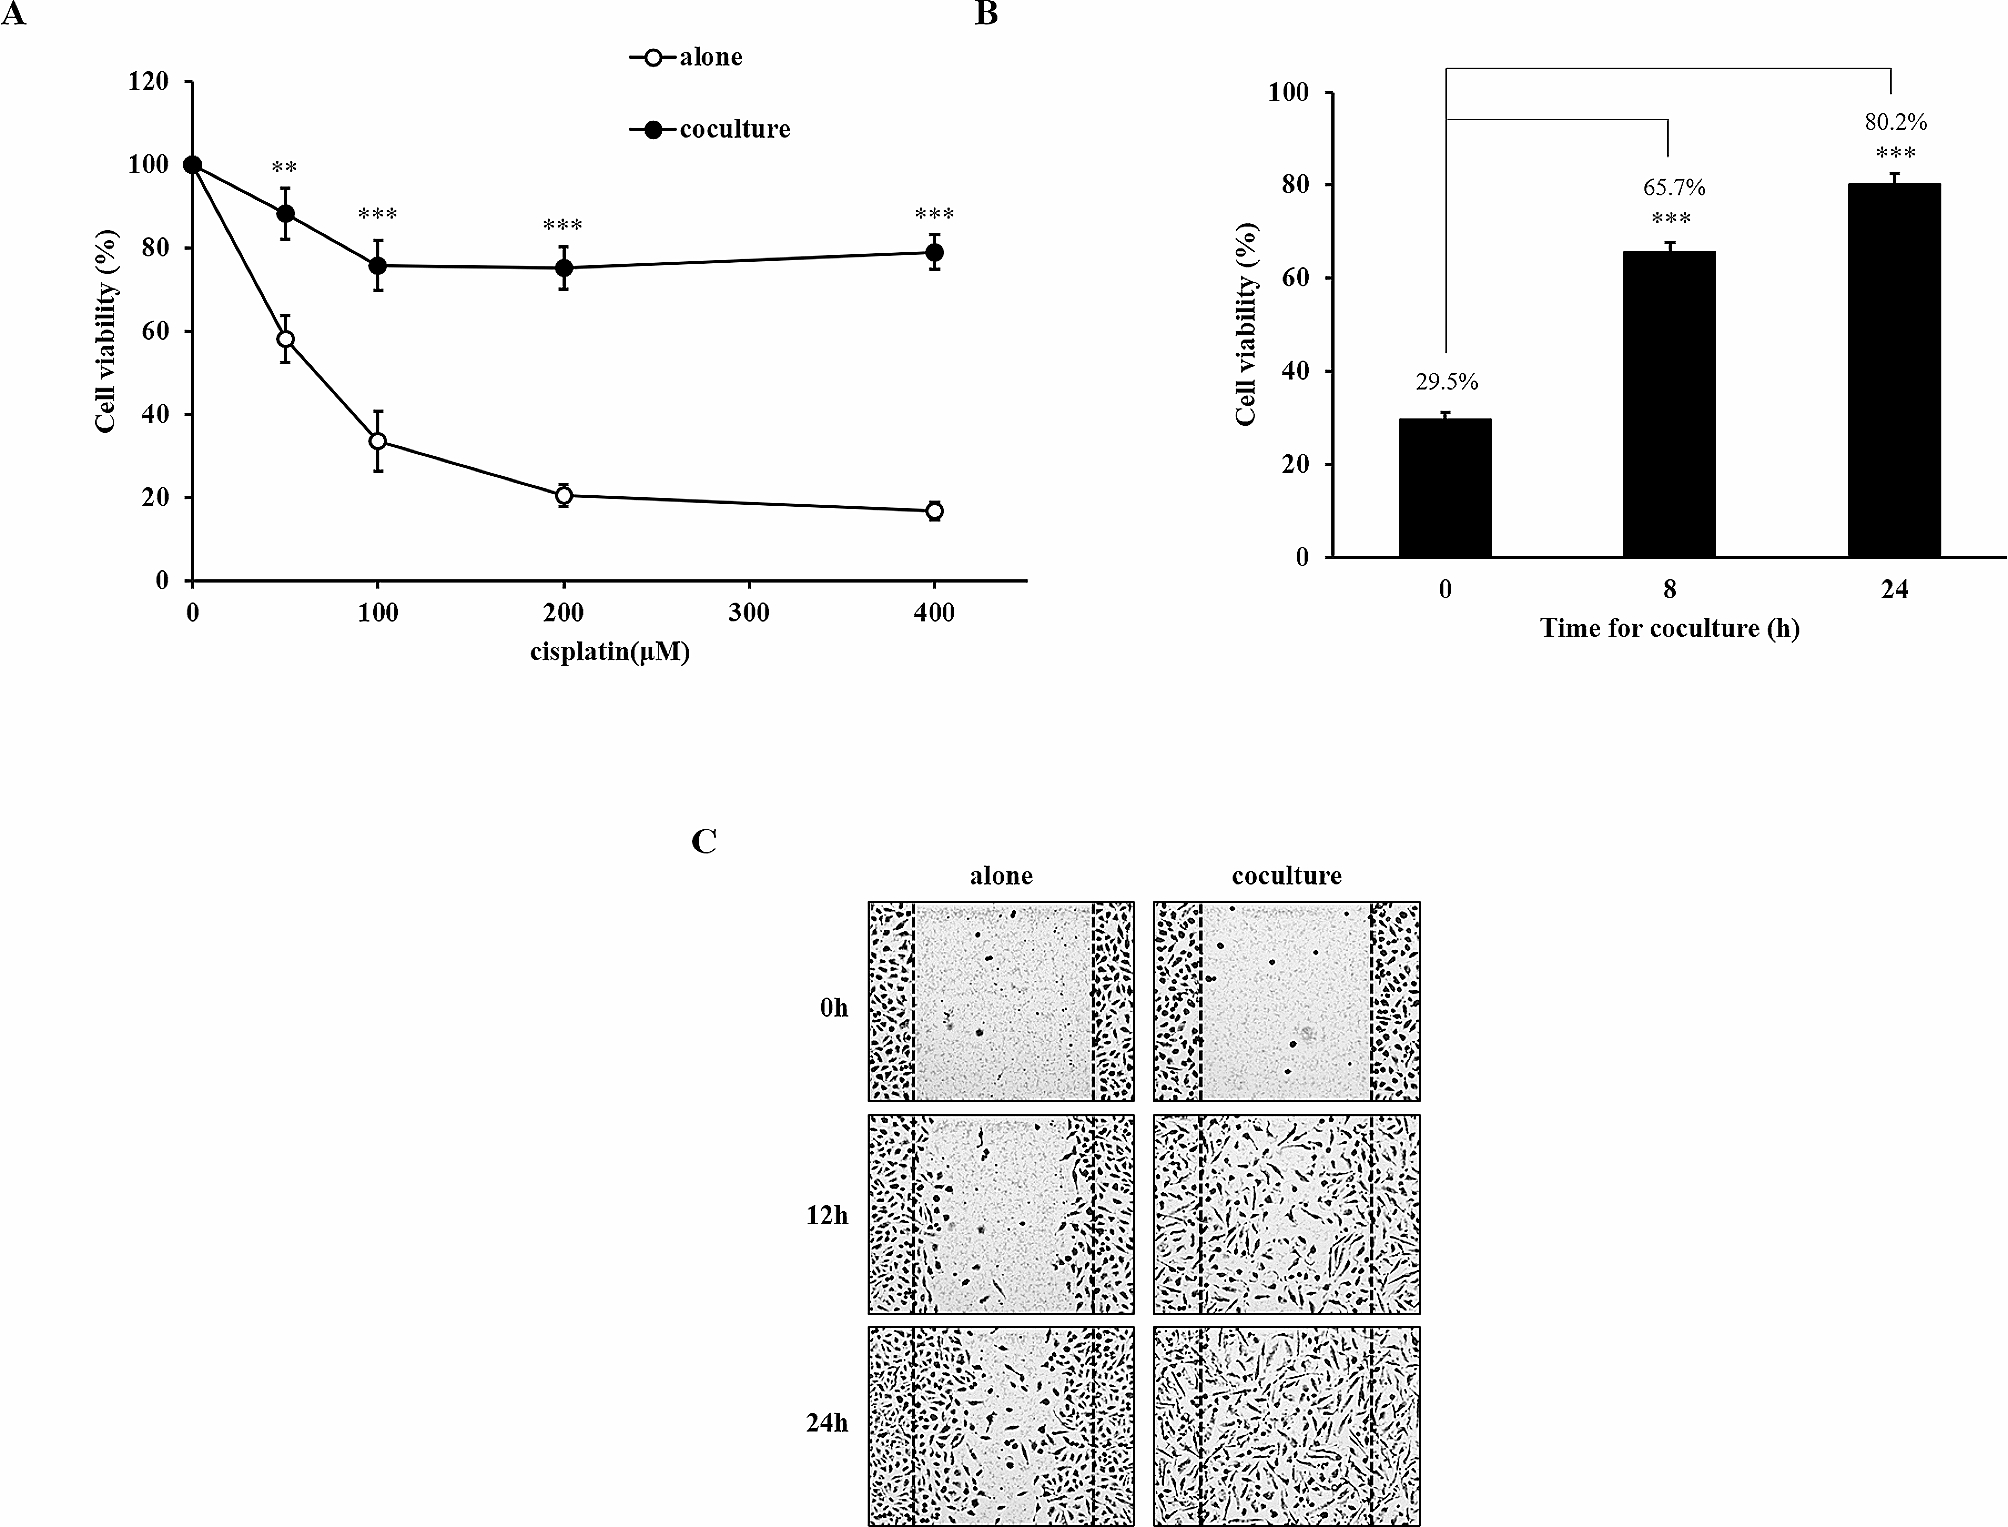
Wound heal assay
The PCa cells were seeded in 6-well plates. Cell growth was allowed to continue until confluence was reached. The cell monolayer was then scratched with a 100 ul micropipette tip and floated cells were washed away with PBS. Cell incubation continued under pour condition medium without FBS to exclude the proliferation influence. And the migration of PCa cells was captured in 48 h. The migration distance and migration area were measured in Image J software (Version 1.53 h).
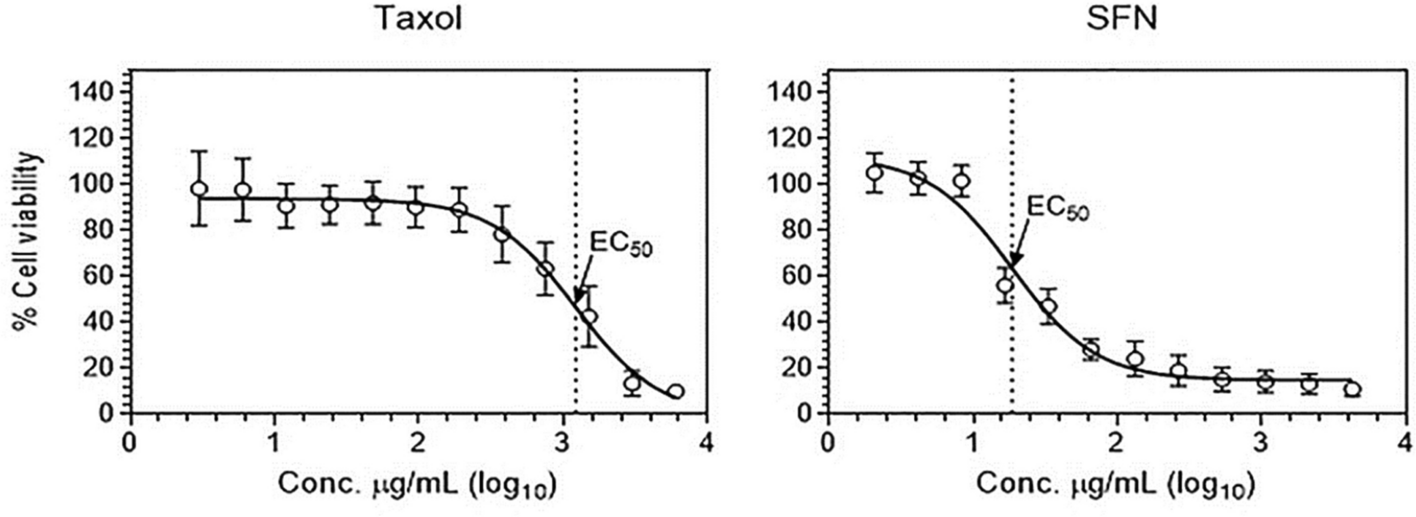
Cell counting Kit-8 (CCK-8) assay
At the indicated times, PC3 cells were treated with a CCK8 kit (10 µl/well, NCM, catalog number: C6005) for an additional 1 h. The absorbance was recorded at 450 nm using a microplate absorbance reader EPOCH2 (BIO-TEK, USA).
Cell adhesion assay
Put the Fibronectin (100 µl/well, Solarbio) or Collagen I (10 µl/well, Solarbio) onto a 96-well microplate for 8 h at 37˚C, and then make the inactivated Fetal Bovine Serum (FBS, 200 µl/well, Solarbio) joined for 1 h at 37 ˚C. PBS buffer was used to wash the well three times and then joined the culture medium to wash again. Then cells were added into the well by an aliquot (1 × 10E4 cells) of the prepared cell suspension for 48 h at 37˚C in a cell culture incubator. After washing none adherent cells, the adherent cells were sustained by a CCK8 kit (10 µl/well) for 4 h and quantified at OD450.
Cell adhesion signal
The KEGG (https://www.genome.jp/kegg/) database was used to obtain the cell adhesion signaling passway, including 26 genes init: The CCLE (https://portals.broadinstitute.org/ccle/) database was used to find the cell adhesion expression in prostate cancer and prostate tissue cell lines.
Scanning Electron microscope (SEM)
SEM assay was used to observe the CRPC membrane. The cells were seeded at a density of PC3 and the Lncap-AD cell line was set as a Positive and Negative Control. The CRPC cell lines were extracted from wells, the culture medium was removed and specimens were fixed in 3% glutaraldehyde at 4 ℃. Dehydrated in a series of graded ethanol (50, 70, 80, 90, and 100%) [12]. The specimens were air-dried using a Hitachi HCP-2 critical point dryer (Japan) and sputter-coated with gold using an Eiko IB5 ion coater (Japan). Cell cluster surface morphology was observed with a scanning electron microscope (TESCAN VEGA3, Czech Republic).
Transmission Electron microscope (TEM)
TEM assay was used to observe CRPC microstructure. The cell samples were collected as an SEM assay. The protocol of digestion and centrifuge of the cells are just like the cell culture. Specimens were fixed in 3% glutaraldehyde and added in 1% osmium oxide buffer. Dehydrated in a series of graded ethanol (30, 50, 70, 80, 90, 95, and 100%). Then, the specimens dealt with the acetone replacement alcohol, epoxy resin permeability, joining the catalyst for polymerization, and ultrathin sectioning. The specimens were observed with a transmission electron microscope (H-7650, HTACHI, Japan), and images were recorded at a magnification of 10 000×.
Enzyme-linked Immuno sorbent assay (ELISA)
An ELISA kit detected the expression of PSA in the serum. The supernatant was collected by centrifuging tube collected from each group according to the ELISA kit (Human PSA ELISA KIT, mlbio, Shanghai, China). The microplate reader measured the optical density (OD) of each well by Spectrophotometer (EPOCH3, BioTek, USA). The KIT standard sample established the standard curve. The corresponding sample concentration was calculated by standard curve three times.
Statistics analysis
All data analyses were performed by GraphPad Prism 8 for Windows (version 8.2.1, GraphPad Software, San Diego, California USA, www.graphpad.com). All data were presented as mean ± standard deviation and compared by Student’s t-test, one-way ANOVA, or two-way ANOVA. The Bonferroni test was used for comparing measurement data between groups. P < 0.05 was depicted as statistically significant.


留言 (0)