


記住我
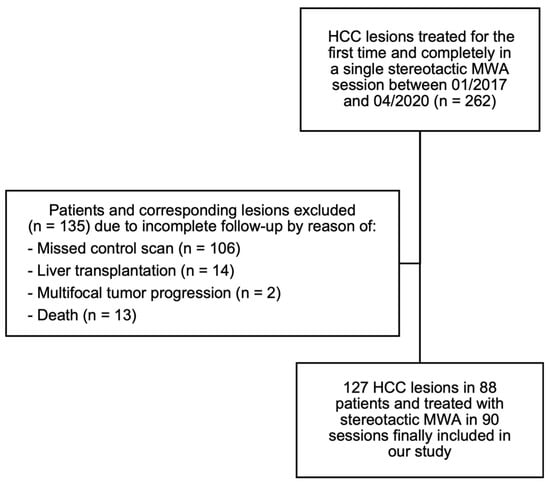


Figure 1. Flowchart of patient selection.
Figure 2. The measurement of the pancreatic fat volume on unenhanced CT. (a) axial, (b) coronal, (c) sagittal CT images. The pancreatic whole volume was measured in cm3 on unenhanced CT images using all slices, using an automated segmentation program installed in the workstation. (d) The pancreatic fat volume within the pancreas was calculated by means of a histogram analysis with local thresholding.
Figure 2. The measurement of the pancreatic fat volume on unenhanced CT. (a) axial, (b) coronal, (c) sagittal CT images. The pancreatic whole volume was measured in cm3 on unenhanced CT images using all slices, using an automated segmentation program installed in the workstation. (d) The pancreatic fat volume within the pancreas was calculated by means of a histogram analysis with local thresholding.
Figure 3. Unenhanced axial CT images of a 51-year-old male patient with severe COVID-19 pneumonia. (a) Chest CT showed extensive consolidations in both lungs. The lung severity score was 3.8. (b) Pancreatic steatosis and fatty liver were seen on the abdominal CT. The CT-FVF of the pancreas was 28.4% and the CT attenuation value of the liver was 46.9 HU.
Figure 4. Unenhanced axial CT images of a 57-year-old male patient with non-severe COVID-19 pneumonia. (a) Chest CT showed the ill-defined ground-glass opacity in the middle lobe of the right lung. The lung severity score was 0.4. (b) No abnormal findings were observed in the pancreas and liver on the abdominal CT. The CT-FVF of the pancreas was 4.5 % and the CT attenuation value of the liver was 61.2 HU.
Figure 5. The ROC curve of CT-FVF (%) of the pancreas predicting the severity of pneumonia on CT.
Table 1. Comparison of CT-FVF (%) of the pancreas and CT attenuation value (HU) of the liver between the severe and non-severe pneumonia groups.
Table 1. Comparison of CT-FVF (%) of the pancreas and CT attenuation value (HU) of the liver between the severe and non-severe pneumonia groups.
Severe Pneumonia Group
留言 (0)