
記住我


Skeletal muscle is critical for all voluntary behaviors and is derived from the earliest contractile proteins present in the ancestral single-celled heterotrophs. Enhanced contractile strength and efficient energy metabolism among these primitive skeletal muscle cells were, therefore, required for both locomotion and feeding (Ni et al., 2012; Ramulu et al., 2012). We have postulated that essential intercellular signaling systems, originating phylogenetically early, conferred a selective advantage upon these basal heterotrophs by linking sensory and motor functions with cell metabolism (Lovejoy and Hogg, 2020). Numerous studies have indicated that the teneurins and their receptors, the latrophilins (LPHN) are part of an ancient regulatory system that modulates cell adhesion and metabolism. The introduction of the teneurin and LPHN genes into multicellular animals occurred via lateral gene transfer from prokaryotes into a single-celled ancestor of metazoans (King et al., 2003; King et al., 2008; Strotmann et al., 2011; Zhang et al., 2012; Chand et al., 2013a; Tucker, 2013). Thus, the teneurins and LPHNs were evolutionarily poised to play a seminal role in the development and coordination of cell-to-cell communication, adhesion and metabolic activities.
Teneurins are essential for development and maintenance of the central nervous system (CNS) (Baumgartner et al., 1994; Levine et al., 1994; Rubin et al., 1999; Tucker and Chiquet-Ehrismann, 2006; Kenzelmann et al., 2008; Young and Leamey, 2009; Hong et al., 2012; Mosca et al., 2012; Li et al., 2018). Comprising a family of four paralogous proteins in vertebrates, the teneurins possess several functional domains that confer specialized actions on their extracellular and intracellular regions (Minet et al., 1999; Oohashi et al., 1999; Minet and Chiquet-Ehrismann, 2000). As type-II proteins, their carboxyl terminus is displaced extracellularly. The distal region contains a β-barrel structure unique to metazoans, but is similar to that found in prokaryotic Tc-toxins (Wang et al., 2005; Lovejoy et al., 2006; Aravind et al., 2012; Zhang et al., 2012; Jackson et al., 2018; Li et al., 2018). Associated with the extracellular domain lies an extended amino-acid chain termed the ‘teneurin C-terminal associated peptide’ (TCAP) (Wang et al., 2005; Lovejoy et al., 2006; Jackson et al., 2018). The TCAPs possess primary structure similarity to the Secretin superfamily of peptides that include, not only secretin paralogs such as vasoactive intestinal peptide (VIP), growth hormone-releasing hormone (GHRH), glucagon and pituitary adenylate cyclase activating peptide (PACAP), but also the calcitonin and corticotropin-releasing factor (CRF) families. One of the distinguishing aspects of this peptide superfamily is their role in the coordination of sensory, motor and energy metabolism (Sekar and Chow, 2013; Lovejoy and Hogg, 2020; Michalec et al., 2020).
The LPHNs are G-protein-coupled receptors (GPCR) belonging to the Latrophilin Adhesion GPCR family (ADGRL) and are cognate receptors of the teneurins in vertebrates (Fredricksson et al., 2003; Fredriksson and Schiöth, 2005; Araç and Li, 2019). LPHNs have three distinct paralogous forms (LPHNs-1-3) and can bind to the C-terminal region of the teneurins, which include the TCAP region. For example, Teneurin-2 and LPHN-1 binds with nanomolar affinity at the lectin-domain of LPHN-1 (Silva et al., 2011). A splice variant of C-terminal domain of teneurin-2, also termed ‘LPHN1-associated synaptic surface organizer’ (Lasso), binds to LPHN with, likewise, high affinity in neurons. Moreover, transgenic over-expression of both TCAP-1 and the hormone-binding domain (HBD) of LPHN-1 results in co-precipitation of both transgenic proteins indicating an interaction between TCAP-1 and LPHN-1 (Husic et al., 2019). Recent structural studies of the teneurins indicate that the TCAP region may be auto-catalytically cleaved from the teneurins after interaction with the LPHNs (Jackson et al., 2018; Li et al., 2018), or could be the result of a separate teneurin splice variant resulting in the mRNA expression of the terminal exon that includes the TCAP sequence (Chand et al., 2013b; Reid et al., 2021).
Regardless of the mechanism of TCAP release, the expected TCAP mature peptide, based on its genomic sequence, has distinct biological properties. Synthetic TCAP-1 regulates cytoskeletal elements and energy metabolism in neurons critical for neuroplastic modulation in the CNS. In rats, TCAP-1 modifies dendritic arborization and spine density in the hippocampus (Tan et al., 2008; Tan et al., 2011), findings that were corroborated in primary cultures of rat embryonic hippocampal tissues that exhibited increased filopodia, neurite and axon development (Al Chawaf et al., 2007a; Chand et al., 2012; Chand et al., 2013b). Thus, these actions indicate a role of TCAP-1 in CNS energy metabolism. Moreover, subcutaneous administration of TCAP-1 into rats increases brain glucose uptake as assessed by functional positron emission tomography (fPET). These observations were corroborated by the expected decreased serum glucose and insulin levels in rats, and in cell culture studies showing that TCAP-1 stimulates glucose uptake by increased glucose transporter transit to the membrane and subsequently increases in ATP turnover providing increased energy for the neurons (Hogg et al., 2018).
However, given the evolutionary history of the teneurins, it is plausible that the teneurins, LPHNs, and TCAP could also play a role in the regulation of skeletal muscle. Skeletal muscle is one of the most important sites of glucose metabolism and is responsible for 40% of glucose-associated energy requirements (Hogg et al., 2018) and 80% of glucose uptake under insulin-stimulated conditions (Richter and Hargraves, 2013). Muscle function and metabolism are intrinsically linked, as evidenced by metabolic syndromes that result in poor muscle function and degradation. A key example of this is demonstrated in patients with type-II diabetes where patients have reduced skeletal muscle function in the grip force test compared to non-diabetic patients (Sayer et al., 2005; Santos et al., 2008).
Based on these previous findings, we investigated the role of TCAP-1 on skeletal muscle function for the first time. We demonstrate that skeletal muscle possesses the critical elements of teneurin-LPHN interaction, and show that TCAP-1 regulates skeletal muscle contractile kinetics in vivo in rats. These studies are supplemented by in vitro studies, using the mouse skeletal cell line, C2C12, to show that TCAP-1 regulates intracellular skeletal calcium (Ca2+) flux similar to that reported in neurons (Hogg et al., 2018; Lovejoy and Hogg, 2020). Moreover, like neurons, the TCAP-1-mediated Ca+2 response leads to increased glucose metabolism and mitochondrial activation, but results in skeletal muscle fiber regulation. We posit that the teneurin-LPHN interaction is required for skeletal muscle physiology and regulates skeletal muscle performance.
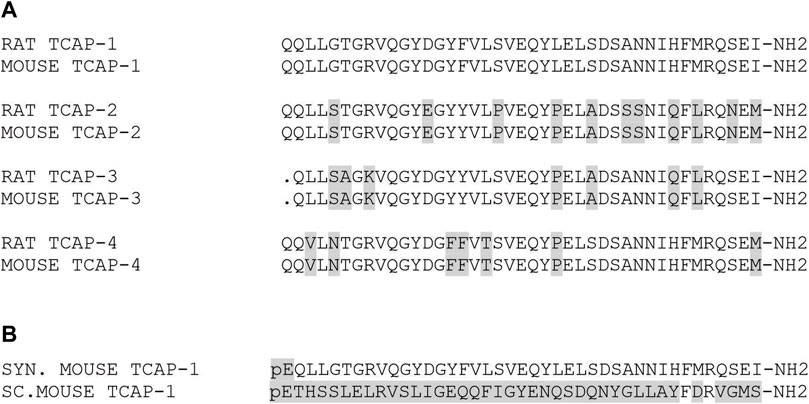
2 Methods2.1 Peptide synthesis and solubilizationBoth peptides; rat/mouse TCAP-1 and scrambled (sc)TCAP-1 (Figure 1), were synthesized commercially by AmbioPharm, Inc. and prepared as an acetylated salt at 95% purity. Peptides were solubilized in saline after alkalization as previously described (Al Chawaf et al., 2007a) then diluted into the required media for in vitro or in vivo studies (see below). The primary structure of all 4 rat and mouse TCAPs are identical to each other’s paralog (Figure 1A) and possess a 73–83% sequence identity among the overall orthologous sequences, although most of these changes reflect homologous and conservative substitutions. For this reason, TCAP-1 was used in both rat and mouse preparations. Synthetic rat/mouse TCAP-1 was prepared with an initial N-terminal pyroglutamic acid to inhibit N-terminal-directed peptidases, and a C-terminal amidated-residue as expected based on the genomic sequence (Wang et al., 2005; Al Chawaf et al., 2007a). As a control peptide, we have utilized a scrambled (sc) amino acid sequence version of rat/mouse TCAP-1 where each residue, with the exception of the initial pyroglutamyl residue (pE), was randomized in its placement within the peptide (Figure 1B). This scTCAP-1 has been used in previous studies to establish an additional level of controls to ensure that TCAP-1 is not affecting non-specific (e.g. oligopeptide transporters; non-target receptors) actions. The vehicle included scTCAP solubilized in 0.9% saline or cell culture medium, unless otherwise stated.
FIGURE 1. Primary structures of rat and mouse TCAP peptides. (A). Comparison of the amino acid sequences of mouse and rat TCAPs. (B). Primary structure of the peptides used in this study. Grey boxed regions indicates regions of identity relative to the rat/mouse TCAP isoforms. Note: pE refers to glutamine residues that have been modified to pyroglutamyl residues and–NH2 indicates where the carboxy terminus has been expected to be modified to an amidated product. In addition, the synthetic peptides, (B) have been prepared with both modifications based on their genomic sequences.
2.2 AnimalsMale adult Sprague-Dawley (SD) rats (Charles River, Canada) were used for the short-term and long-term muscle function studies. The metabolic and endocrine studies of TCAP-1 on rats were approved by the University of Toronto Animal Care Committee (UACC) under the auspices of the Canadian Council of Animal Care. Male adult Wistar rats (∼250 g) (Charles River, United States) were used for the functional positron emission tomography (fPET) studies performed by Molecular Imaging, Inc. (Ann Arbor, MI, United States) and approved by the American Association of Animal Laboratory Care (Hogg et al., 2018). In both sets of studies, animals were weighed weekly and monitored for any signs of distress or illness (e.g., loss of hair, extreme weight loss, abnormal behaviors). Animals were monitored daily by animal care personnel under the supervision of the facility veterinarian. Had any animals exhibited signs of distress, they would have been removed from the study and humanely euthanized using CO2 exposure. However, no animals showed overt indications of stress and, subsequently, all animals were utilized for these studies.
2.3 In Vivo studiesThe short-term application studies of TCAP-1 utilized 16 male adult SD rats (250g) that were acclimated for 1 week (w) on a 12:12 light-dark (LD) cycle. For 5 days (d) daily, the animals were treated with either vehicle or TCAP-1 (10 nmol/kg) by subcutaneous (SC) injection in the intrascapular region. Animals were tested for muscle function by electrical muscle stimulation (see below) 3 days after the last treatment under anesthesia of 5% isoflurane when animals were immediately euthanized afterward using CO2. For the long-term study, 20 adult male SD rats (350g), acclimated for 1w on a 12:12 LD cycle and were treated with either vehicle or intrascapular TCAP-1 (SC; 25 nmol/kg) for 3 months (m) (1 injection/week). Muscle function by electrical muscle stimulation was tested 2w after the last treatment. Animals were immediately euthanized after electrical muscle stimulation studies (see below).
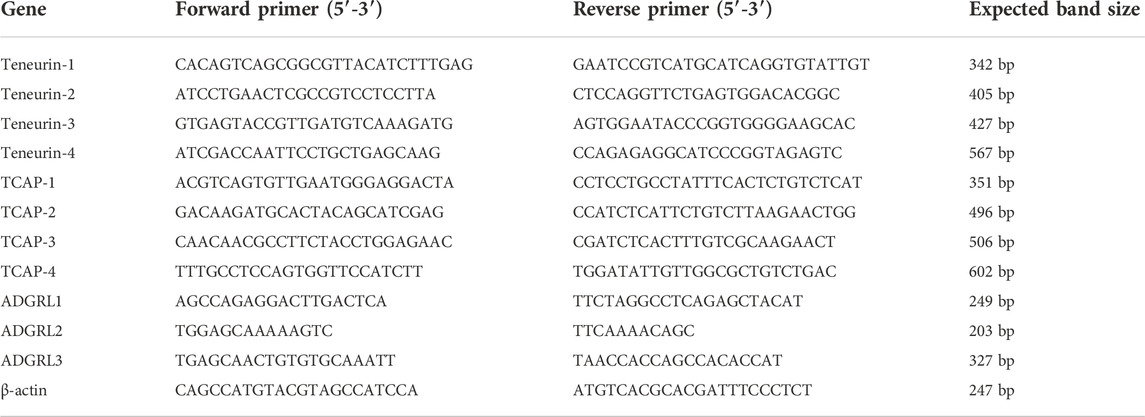
2.3.1 PCR-based mRNA expression of teneurin and LPHNRNA was extracted from tibialis anterior (TA) muscles using TRIzol (Thermo Scientific, Waltham, MA, United States) following the manufacturer’s instructions. The PCR reaction mix included 5 μL cDNA, 2 μL forward primer and 2 μL reverse primer (Invitrogen; Table 1), 14.2 μL water (Sigma, Oakville, ON), 3 μL 10x Taq Buffer with KCl (Thermo Scientific), 1.8 μL MgCl2 (Thermo Scientific), 1 μL deoxynucleotide Solution Mix and 0.5 μL Taq DNA Polymerase (New England Biolabs). The reactions were incubated in an Eppendorf Mastercycler Gradient Thermal Cycler for 7 m at 95°C; followed by 35 cycles of 60 s at 95 °C, 90s at 67°C, and 35s at 72°C; and then held at 4°C. cDNA samples were resolved on a 3% agarose gel at 100 V for 1.5 h and visualized using a Bio-Rad ChemiDoc MP System with 0.5s exposure.
TABLE 1. Primers used for in vitro and in vitro RT-PCR analyses. Forward and reverse primer pairs for the four teneurins, TCAPs, three latrophilins (ADGRL), and β-actin control are indicated.
2.3.2 Histological studiesTA muscle was excised, then flash-frozen in liquid nitrogen-cooled isopentane. The tissue was cryo-sectioned at 10 μm at −20°C and transferred to cover-slides and fixed using ice-cold methanol. Immunohistochemical (IHC) studies of the β-dystroglycan (β-DG) and teneurins followed previously established methods using commercially available monoclonal antibodies (Al Chawaf et al., 2007a; Chand et al., 2012; Chand et al., 2013b; Husic et al., 2019). Following blocking for 1 h with 10% normal goat serum (NGS: Cell Signaling, Inc.), the primary antibodies against β-dystroglycan (β-DG; 1:500 dilution, Santa Cruz Biotechnology), teneurin-3 (1:1200 dilution; Abnova) or latrophilin (1:1000 dilution: Santa Cruz Biotechnology) diluted in 1% NGS, were added and incubated overnight (ON) at 4°C. After 3x phosphate-buffered saline (PBS) washing, the cells were treated with the secondary antibodies, Alexa 594, goat anti-rabbit (1:400 dilution; Invitrogen) or Alexa 488 donkey anti-mouse (1:400 dilution, Invitrogen) and incubated for 1 h at room temperature (RT) in the dark. Coverslips were attached, and the tissue imaged using confocal microscopy (Leica TCS-SP8) at ×400 magnification. For fluorescence analyzes of protein expression, ImageJ software was used to measure arbitrary fluorescent units (AFU), where changes of AFU are proportional to protein expression changes. A total of five slides were quantified with eight regions of interest (ROI) investigated. ROI was defined as regions with multiple cell interactions free of artifacts.
2.3.3 functional Positronic Emission Tomography (fPET)Male Wistar rats were treated with either vehicle or TCAP-1 (10 nmol/kg) by intrascapular SC injection. After 3 days of treatment, 1 mCi of [18F]-2-deoxyglucose (18F-DG) radiotracer (IBA Molecular) was administered intravenously (IV) under 5% isoflurane anesthesia. fPET scans were performed using a Siemens Inveon microPET small animal PET scanner using the protocol as previously described (Hogg et al., 2018). Briefly, body temperature was maintained with a thermostat-regulated recirculating water-heated pad. Static emission data was acquired for 20 m. The PET list mode data was converted to 2-dimensional (2D) sinograms, corrected for random coincidences, and normalized for scanner uniformity. The PET image analysis was performed using the Amira 5.5.0 analysis software package. For whole body ROIs (regions of high 18F-DG uptake), a low threshold was set to delineate specific signals in the whole body while eliminating background. The total PET counts were calculated from all voxels within the segmented volumes of interest. These images were then compiled into 3-dimensional (3D) projections, thus allowing for accurate analyzes of muscle tissue. Fluorescence of the mean pixel was calibrated to volume of muscle being analyzed (mean pixel fluorescence/mm3).
2.3.4 NADH staining and analysisTA muscles from the treated SD rats were cryo-sectioned at 10 μm thickness as described above. Cryo-sections were washed 2x with PBS, then 0.2% NBT solution in PBS (containing 0.1% NADH; Sigma, Oakville, ON, Canada) was added and incubated for 30 m at 37 °C. Slides were washed 2x in PBS before mounted, imaged at ×100 magnification and analyzed on ImageJ software for pixel density, where darker pixels represent higher levels of NADH. Expression of NADH was analyzed based on a minimum of 100 fibers per tissue, with a minimum of 3-4 tissues analyzed for each group.
2.3.5 Muscle function and integrity testing by electrical muscle stimulationThe electrical muscle stimulation protocol was followed as described previously (Holwerda and Locke, 2014) with minor modifications. Briefly, both TCAP-1 or non-treated animals were anesthetized with 5% isofluorane in 1L/min O2, and subsequently positioned into the testing apparatus. A 25g needle was inserted through the soft tissue of the knee in order to ensure a stable position. The foot was placed on a lever attached to a servomotor and taped in position. Electrodes were placed below the skin but adjacent to the TA muscle. Dynamic Muscle Control (DMC; Version five; Aurora Scientific) software was used for electrical stimulation and analyses. The correct voltages for peak tetanic tension was established by increasing voltage by 1V increments until optimal tetanus twitch was achieved. Subsequently, the test began with a single tetanus and single twitch protocol to establish the baseline followed by a 6 m fatigue protocol (8V, 200 Hz, 300 ms). After the termination of the protocol, tetanic and twitch tensions were recorded at 0, 1, and 5 m. Animals were immediately euthanized after recovery measurements were recorded.
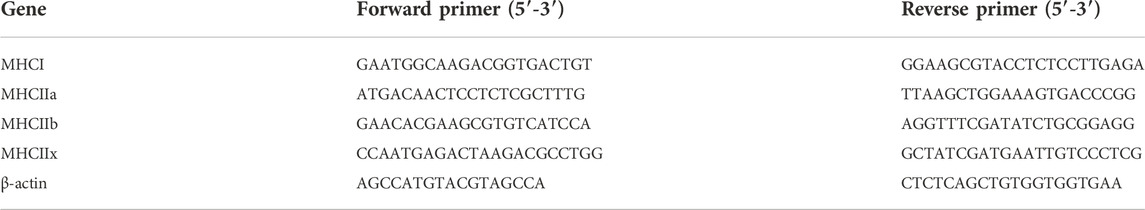
2.3.6 Quantitative reverse-transcription polymerase chain reactionTA muscle mRNA and cDNA were prepared as previously described (see above). The cDNA from all samples was used to prepare pools to establish standard curves of each gene. The cDNA pool or cDNA samples were mixed with MasterMix containing SYBR select. The reactions were loaded in a 384-well PCR plate and run in a BioRAD qRT thermal cycler for 2 m at 50°C, 7 m at 95°C; followed by 39 cycles of 60s at 95°C, 90s at 67°C, and 35s at 72°C. Melting curves were established by a step-wise gradient from 60 to 90 °C. The myosin heavy chain (MHC) isoforms, MHCI, MHCIIa, MHCIIx and MHCIIb were analyzed by real-time PCR using the mRNA and cDNA prepared above (see Table 2).
TABLE 2. Rat MHC isoforms and β-actin control primers used for qRT-PCR. Forward and reverse primer pairs are indicated for the four MHC isoforms.
2.4 In Vitro studies2.4.1 Culture, immunocytochemistry and mRNA expression studies of the C2C12 cell lineThe immortalized murine skeletal muscle cell line, C2C12, was used for all in vitro studies. Cells were maintained at 60–70% confluency with Dulbecco’s Modified Eagle Medium (DMEM) supplemented with 20% fetal bovine serum (FBS) and a penicillin/streptomycin antibiotic combination (Invitrogen, Burlington, ON, Canada). To induce differentiation, the media was changed to DMEM supplemented with 10% horse serum (HS) with the penicillin/streptomycin antibiotic combination, and the cells were allowed to differentiate for 6 days (media replaced every 24 h). For treatment, cells were serum-starved for 3 h and then provided with either vehicle or TCAP-1 (100 nM). The TCAP immunocytochemistry (ICC) was performed using a polyclonal antiserum raised against TCAP-1 and previously characterized (Chand et al., 2013b). Briefly, cells were plated on poly-D-lysine-coated coverslips (BD Biosciences) and cultured overnight (ON) to 60% confluency in DMEM with 10% FBS. The coverslips were rinsed with PBS and fixed in 4% PFA and permeabilized with 0.3% Triton X-100 (Fisher Scientific). After blocking with 10% NGS (Vector Laboratories) for 1 h, the coverslips were incubated ON with the TCAP-1 TNR308 primary antiserum (1:1000 dilution) (Chand et al., 2013b). After incubation and washing, the cells were treated with the secondary antibodies indicated above. Where appropriate, the cells were washed then counterstained with DAPI, and mounted with DABCO. Fluoroceinisothiocyanate (FITC) was covalently linked to the K37 residue of mouse TCAP-1 peptide using the EZ-Label FITC protein labelling kit (Pierce Biotechnology) as we have used in the past (Al Chawaf et al., 2007a; Chand et al., 2012; Chand et al., 2013b). The identification of teneurin, TCAP and LPHN cDNAs in C2C12 cells were performed with mRNA extracted from differentiated mouse C2C12 cells using the method described above using the primer sequences indicated in Table 1.
2.4.2 Live-cell calcium imaging in C2C12 myotubulesThe C2C12 skeletal cells were grown and differentiated on poly-D-lysine-coated 25 mm round No. 1 glass coverslips (Warner Instruments, Hamden, CT, United States). Changes in intracellular Ca2+ were assessed using the membrane-permeable fluorescent indicator Fluorophore-4 (Fluo-4) (Invitrogen, Burlington, ON, Canada). Cells were loaded with Fluo-4 by incubating coverslips in DMEM containing 10 μM Fluo-4 for 30 m (37°C) followed by a 15 m wash in Locke’s Buffer (305–310 mOsmol at 22°C). In experiments assessing changes in intracellular Ca2+, coverslips were placed in a flow-through bath chamber (RC-40HP, Warner Instruments, Hamden, CT, United States) of an inverted microscope (Axio Observer Z1, Zeiss, Toronto, ON, Canada) equipped with a ×40 oil immersion objective. Cells were continuously bulk-perfused with Locke’s Buffer via a gravity drip perfusion system at a rate of 2–3 ml/min at RT. Changes in Fluo-4 fluorescence were imaged using a green fluorescent protein (GFP) filter set (Semrock, Rochester, NY, United States) and a X-Cite 120 fluorescence illumination system (Excelitas Technologies, Mississauga, ON, Canada), controlled by Volocity 4.0 imaging software (Quorum Technologies Inc., Guelph, ON, Canada). Fluorescence emissions were detected with an Orca-ER Hamamatsu B/W CCD digital camera (Hamamatsu, Middlesex, NJ, United States). Fluo-4 was excited with a wavelength of 480 nm for 100 ms every 3–5 s and fluorescence emission was measured at wavelength of 516 nm.
2.4.3 Caffeine stimulation experimentsCaffeine treatment of the C2C12 cells was used to establish that the cells were viable. Caffeine (4 mM; Sigma-Aldrich, Oakville, ON, Canada) was applied to C2C12 myotubules to stimulate Ca2+ release from the sarcoplasmic reticulum (SR). Cells were either pre-treated with TCAP-1 (100 nM) or vehicle for 1 h before stimulation with caffeine. Using Velocity 4.0 imaging software, ROIs were taken from cytosolic regions within the myotubules (n = 4 coverslips, 4-5 ROIs per coverslip).
2.4.4 GLUT4 immunocytochemical studiesC2C12 cells were differentiated as described above. After 3 h of serum-starvation, myotubules were treated either with vehicle, TCAP-1 (100 nM) or insulin (100 nM) for 15 or 30 m. Cells were then fixed using 4% PFA and subsequently blocked with 10% NGS for 1 h at RT. The GLUT4 primary antibody, diluted in 1% NGS, was added to the cells and incubated at 4 °C OT. Following 4x PBS washes, the secondary antibody (diluted in 1% NGS) was added and incubated 1 h at RT. The coverslips were mounted using DAPI-containing Vectashield. Slides were imaged on a confocal microscope with a ×40 oil objective. The images were analyzed using ImageJ, where myotubules were selected as ROIs and were analyzed for red pixel intensity values, representing ir-GLUT4 levels, and normalized to area size (n = 3-4 coverslips per treatment, 7-8 myotubules per coverslip). For the IP3R inhibitor, 2-aminoethoxydiphenyl borate (2-APB; Sigma Aldrich, Oakville, ON, Canada) experiments, 2-APB (100 µM) was applied for 4 m before the start of treatment with either sham (Locke’s buffer) or TCAP-1 (100 nM), containing 2-APB for continuous blocking of IP3R.
2.4.5 Radioactive glucose uptakeThe 3H-2-deoxyglucose uptake protocol was followed as previously described with minor modifications (Maher, 1995; Uemura and Greenlee, 2006). At day-6 post-plating, C2C12 myotubules were washed 2x with Locke’s Buffer without serum and glucose. The culture was incubated in the Locke’s Buffer for 1 h at 37 °C followed by exposure to 100 nM insulin, 100 nM TCAP-1, 100 nM SC-TCAP-1, or saline. 3H-2-deoxyglucose (0.5 μCi/ml) was added to the culture 5 m before termination of treatment exposure. Uptake of 3H-2-deoxyglucose was stopped immediately after 5 m with 3x washes of ice-cold 0.9% saline solution. The cells were digested with 1 ml of 0.05 M NaOH at 0, 30, 45, and 60 m after treatment. Radioactivity of the cell lysates was measured using a beta (β) -liquid scintillation counter (Beckman Coulter), and recorded in counts per minute (CPM).
2.4.6 Intracellular ATP and NADH assaysATP assays were conducted using Promega ATP Assay kits (Wisconsin, United States) following the manufacturer’s instructions. Briefly, C2C12 cells were seeded at 10,000 cells/well in 96-well plates. The following day, cells were treated with either vehicle or TCAP-1 (100 nM) and lysed at 0, 15, 30, and 60 m after treatment. Ultra-Glo recombinant luciferase (Promega, Wisconsin, United States) was added to the media to determine ATP levels. Fluorescence from blank wells was subtracted from all samples to account for background signal noise. As the fluorescence signal naturally decays over the course of the experiment, TCAP-1-treated cells were compared to the vehicle-treated cells for each time point (n = 8). The resazurin-resorufin-based NADH assays (Abcam) for the wild-type (WT) C2C12 and the CRISPR-associated knockout (KO) C2C12 cells, C2C12 myoblasts were seeded at 10,000 cells/well into a white clear-bottom 96-well plate and grown for 12–18 h. The resazurin sodium salt (0.025 mg/well from 10X stock in PBS) was added to each well and mixed for 1 m. Fluorescence was measured using the Tecan Infinite M1000 Pro plate reader, where each well was excited at 530 nm and emission was captured at 590 nm. Measurements were taken every 10 m from 0 to 30 m to establish a pre-treatment baseline. Then, vehicle (distilled water), TCAP-1 (100 nM) or FCCP (10 uM; all from 10X stocks in PBS) was added to each well and mixed for 1 m. Measurements were taken every 30 m for 150 m. To analyze, background fluorescence measurements from wells containing no cells were subtracted from sample fluorescence measurements. Relative fluorescence was calculated at each time point by normalizing to the background-subtracted fluorescence (in arbitrary fluorescence units, AFUs) at time 0, just prior to treatment. Each well represents n = 1.
2.4.7 Diacylglycerol and inositol triphosphate (IP3) assaysThe protocols provided by commercial DAG and IP3 assays (MyBiosource, San Diego, California, United States) were followed. To determine the downstream Ca2+ response, six replicates of C2C12 cells were prepared using the TCAP-1 treatment protocol described above then treated with either vehicle, the IP3R antagonist, 2-APB, or the phospholipase C inhibitor, U73122. Cell lysates were added to a microELISA plate coated with purified mouse DAG or IP3 antibodies. Subsequently, 3,3′,5,5′-tetramethylbenzidine (TMB) solution was added to detect the HRP-conjugates as color changes. Finally, sulfuric acid (0.01N) was added to terminate the reaction. The absorbance change was measured at 450 nm by spectrophotometry (SpectraMax Plus, NH, United States). For the IP3R inhibitor, 2-APB (100 µM) was applied before the start of treatment with either sham (Locke’s Buffer with scTCAP-1) or TCAP-1 (100 nM). For live-cell fluorescence experiments, C2C12 cells were differentiated and intracellular Ca2+ flux was assessed via Fluo-4 via a flow-through bath chamber of an inverted microscope. Cells were quantified with a GFP filter set at 480 nm with the fluorescence emission measured at 516 nm.
2.4.8 Mitochondrial Ca2+ accumulation and membrane potential measurement in C2C12 myotubulesChanges in mitochondrial (MT) Ca2+ levels were assessed using fluorescent indicator, Rhodamine-2 (Rhod-2). C2C12 myotubules were loaded with Rhod-2 by incubating coverslips in DMEM containing 4 µM Rhod-2 (from a 1 mM stock solution in DMSO with 20% pluronic; Invitrogen-Pluronic™ F-127) for 30 m at 22 °C. Cells were washed once for 30 m at 37 °C in Locke’s Buffer Cells then acclimated for 15 m at 22°C. To assess changes in MT Ca2+ levels, cells were continuously perfused in a flow-through chamber as indicated previously. Changes in Rhod-2 fluorescence was imaged using a TRITC filter set (Semrock, Rochester, NY, United States) and an X-Cite 120 fluorescence illumination system (Quorum Technologies, Inc. Guelph ON, Canada). Emissions were detected using an Orca-ER Hamamatsu BW CCD digital camera as described above. Rhod-2 was excited at 552 nm every 100 ms and measured at 577 nm. Multiple ROI were taken from the nuclear regions of the myotubules (n = 5, 5-7 ROIs per coverslip). Changes in MT membrane potential were assessed using rhodamine-123 (Rhod-123)-based fluorescence. C2C12 myotubules were prepared by incubating coverslips in DMEM containing 5 μM Rhod-123 for 30 m (37 °C) followed by a 15 m wash in Locke’s Buffer. Changes in Rhod-123 fluorescence were imaged using the green GFP filter set using the same experimental configuration as previously described. Rhod-123 was excited with a wavelength of 480 nm for 100 ms every 5s and fluorescence emission was measured at 516 nm.
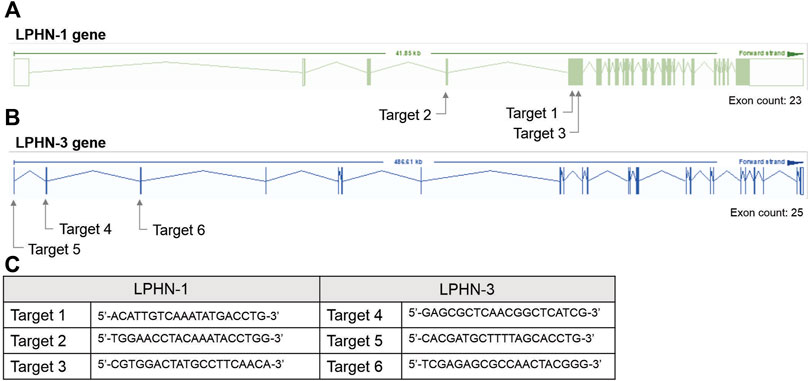
2.4.9 SiRNA knockdowns and CRISPR knockouts of LPHN-1 and -3For the siRNA KD studies, transfection with siRNA oligonucleotides was performed after 4 days of C2C12 differentiation using Dharmacon SmartPOOL (Horizon Inc. Canada) siRNA for LPHN1 (L-061299-00-0005), LPHN3 (L-040779-00-0005) and a randomized non-targeting control (D-001810-10-05). Dharmacon SmartPOOL siRNAs targeted against LPHN-1 and-3, glyceraldehyde-3-phosphate (GAPD) and a non-targeting control were re-suspended in 1x siRNA buffer from 20 µM stocks. The stocks were diluted in serum-free and antibiotic-free DMEM to 250 nM. A 7.5 µL aliquot of Mirus TranslT-X2 (Mirus Bio LLC) transfection reagent was diluted in 200 µL serum- and antibiotic-free DMEM and incubated at RT for 30 m. The mixture was added to C2C12 cells (see above) with a final siRNA concentration of 25 nM. The cells were differentiated in siRNA-containing media for 2 days for a total of 6 days of differentiation before use in the experiments. For CRISPR studies, single-guided RNA (sgRNA) constructs were designed to target the mouse LPHN-1 and -3 gene at three locations (see Figure 2). C2C12 cells were transfected with sgRNA constructs (Figure 2C) and a Cas9 plasmid, generating heterogenous pools of transfected cells. The CRISPR/Cas-transfected C2C12 cells (either heterogenous pools or clones) were trypsinized and pelleted for DNA extraction. Genomic DNA was extracted using Lucigen QuickExtract DNA extraction solution (Biosearch Technologies, Inc.) according to the manufacturer’s direction. The LPHN-1 and -3 genes were amplified by PCR and digested by T7 endonuclease using the EnGen Mutation Detection Kit (New England Biolabs) according to directions in combination with the custom primers that flank the appropriate CRISPR-targeting regions (Figure 2C). The fragments were identified as previously described above. Clones that showed low or no wild-type (WT) PCR amplicon were screened for LPHN1 expression by qRT-PCR. Selected clones showing significantly reduced LPHN1 mRNA expression by qRT-PCR were termed ‘LPHN1 E5U KO’ and ‘LPHN1 E5D KO’ based on the exon position of mutated site and were used for further study (Figure 2). The activity of the clones were determined by TCAP-1-induced cytosolic Ca2+ flux, peroxisome proliferator-activated receptor γ coactivator 1α (PGC-1α) qRT-PCR-based expression, and NADH turnover using the methods described above.
FIGURE 2. CRISPR-based targets for the mouse LPHN-1 and -3 genomic sequences. (A). Schematics of LPHN-1 and -3 genomic organization. The oligonucleotides targeting these regions are indicated as arrows. (B). Sequence of the oligonucleotides used in the CRISPR knockdowns as indicated in “A” above. (C) Sequence of oligonucleotides indicated in A and B above.
2.5 Statistical analysesThe data graph data are represented as mean ± SEM. All data were analyzed by Student’s t-test or one or two-way ANOVA, as described within each figure caption. Tukey’s post-hoc test and Sidak’s post-hoc test were used to determine significance in one-way and two-way ANOVA analyzes, respectively, as indicated. An a priori hypothesis of p < 0.05 was used as a threshold for statistical significance. GraphPad Prism 7-8 was used to analyze each statistical test.
3 ResultsThe primary structure of rat and mouse TCAP-1 possesses a high degree of homology among the other three paralogs (Figure 1A). Because the primary structure of rat and mouse TCAP-1 is identical, it was used for all studies, as well as a proxy for the other TCAP isoforms. The first in vivo studies established that the teneurins, TCAP and LPHNs could be expressed in rat skeletal muscle and subsequently, the physiological role of TCAP-1 in the rat skeletal muscle was examined. In the second part of the study, we have used mouse C2C12 cells as a model to understand the molecular and cellular action on TCAP-1 in skeletal muscle function.
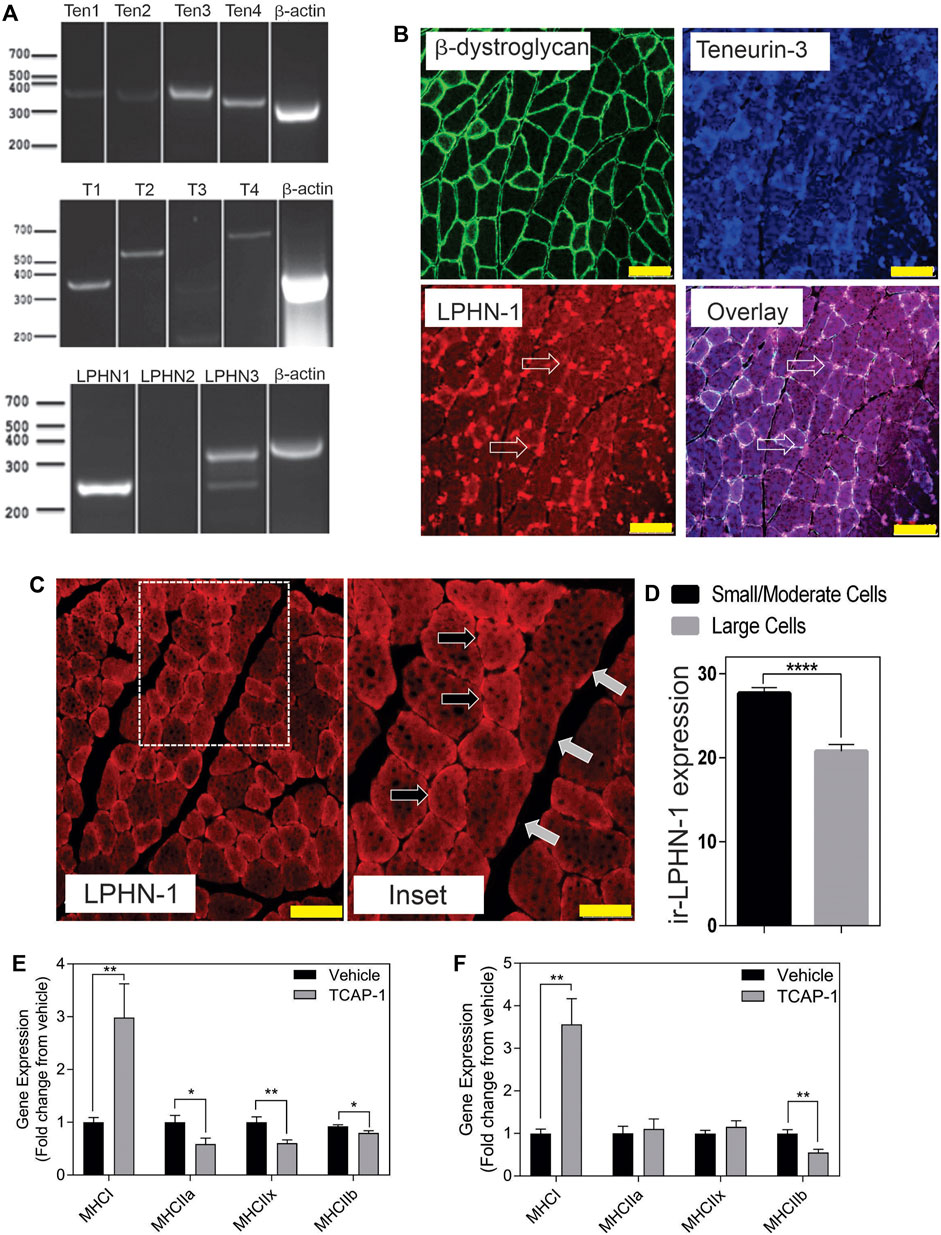
3.1 In Vivo rat studies3.1.1 Molecular expressionIn rat TA muscle mRNA extracts, all 4 teneurin mRNAs were identified based on the PCR primers indicated in Table 1. Teneurins-3 and-4 showed the strongest response, although both teneurins-1 and -2 were present, albiet weakly expressed. In contrast, TCAP-1 and -2 showed a strong signal relative to that indicated by teneurins-1 and -2 whereas TCAP-4 showed a signal consistent with teneurin-4. Although these studies were not quantitative, they do establish that both teneurins and TCAP paralogs are present in rat skeletal muscle. However, importantly, both LPHN-1 and -3 cDNA bands were also strongly expressed, although there was no evidence of LPHN-2 in this preparation (Figure 3A). To corroborate these cDNA studies, IHC expression was performed in rat TA muscle tissue. Initially, β-dystroglycan (DG) labelling was used to establish the sarcolemmic boundary of the cells, as previous studies indicated a relationship between DG and TCAP signaling (Chand et al., 2013b). Further, IHC co-localization labeling of teneurin-1,-3 -and LPHN-1 was utilized to determine the cellular anatomical relationship between the teneurins and LPHNs. Immunoreactive (ir) teneurin-1 labelling did not show a strong signal, consistent with the RT-PCR data indicated above, however the ir-teneurin-3 showed a response indicating specific concentrations of both ir-dystroglycans and ir-teneurins in the sarcolemma (Figure 3B). Importantly, ir-LPHN-1 labelling of these tissues showed co-localization with the ir-DG along with ir-teneurin and ir-TCAP labelling consistent with the PCR studies indicated in Figure 3A. The variation among the PCR-based mRNA and ir-teneurin -1 and -3 expression was expected due to affinity differences among the antibodies and primers (see Discussion). Moreover, these studies establish a clear relationship between TCAP, teneurins and LPHNs in rat skeletal muscle (Figure 3B). Morphological differences, with respect to cross-section diameter between the vehicle- and TCAP-1-treated animals could be discerned. Thus, TCAP-1 administration induced a 25% increase (p < 0.001) between the number of small and intermediate cells relative to the untreated vehicle rats (Figures 3C,D). Because small and intermediate fibers are typically oxidative muscle fibers, these observations suggested that TCAP could stimulate glucose uptake in skeletal muscle. To corroborate these findings, the expression of myosin heavy chain (MHC) was evaluated in the TA muscle of both short-term and long-term TCAP-treated animals. In both cases, there was a significant (p < 0.01) 3- to 3.5-fold increase in the expression of the MHCI fibers in the TCAP-1-treated animals compared to the non-treated vehicle, although significant (p < 0.05) differences were also observed among MHCIIa, MHCIIx and MHCIIb expression among the treated and untreated animals (Figures 3E,F).
FIGURE 3. Expression of the teneurin/TCAP-LPHN immunoreactivity (ir) in rat skeletal muscle: (A). PCR expression of teneurins, TCAP and LPHNs in rat TA muscle. (B). Immunological expression of β-dystroglycan, teneurin and LPHN in rat skeletal muscle. Arrows indicate nodes of aggregation (Scale bar: 100 µM). (C). Enhanced examination of ir-LPHN regions in TA muscle cells. Left panel scale bar indicates 100 μM, whereas the right panel scale bar indicates 50 µM. Black arrows indicate cells with high LPHN-1 labelling, whereas white arrows indicate cells of low LPHN-1 labelling. (D). Quantification of ir-LPHN-1 as a function of muscle cell diameter (size) as shown in “C” (Student’s t-Test p < 0.0001; ****). (E). Changes in fiber type in short-term TCAP-1 administration (t-test indicated for each pair). (F). Changes in fiber-type over long-term TCAP-1 administration (t-test indicated for each pair).
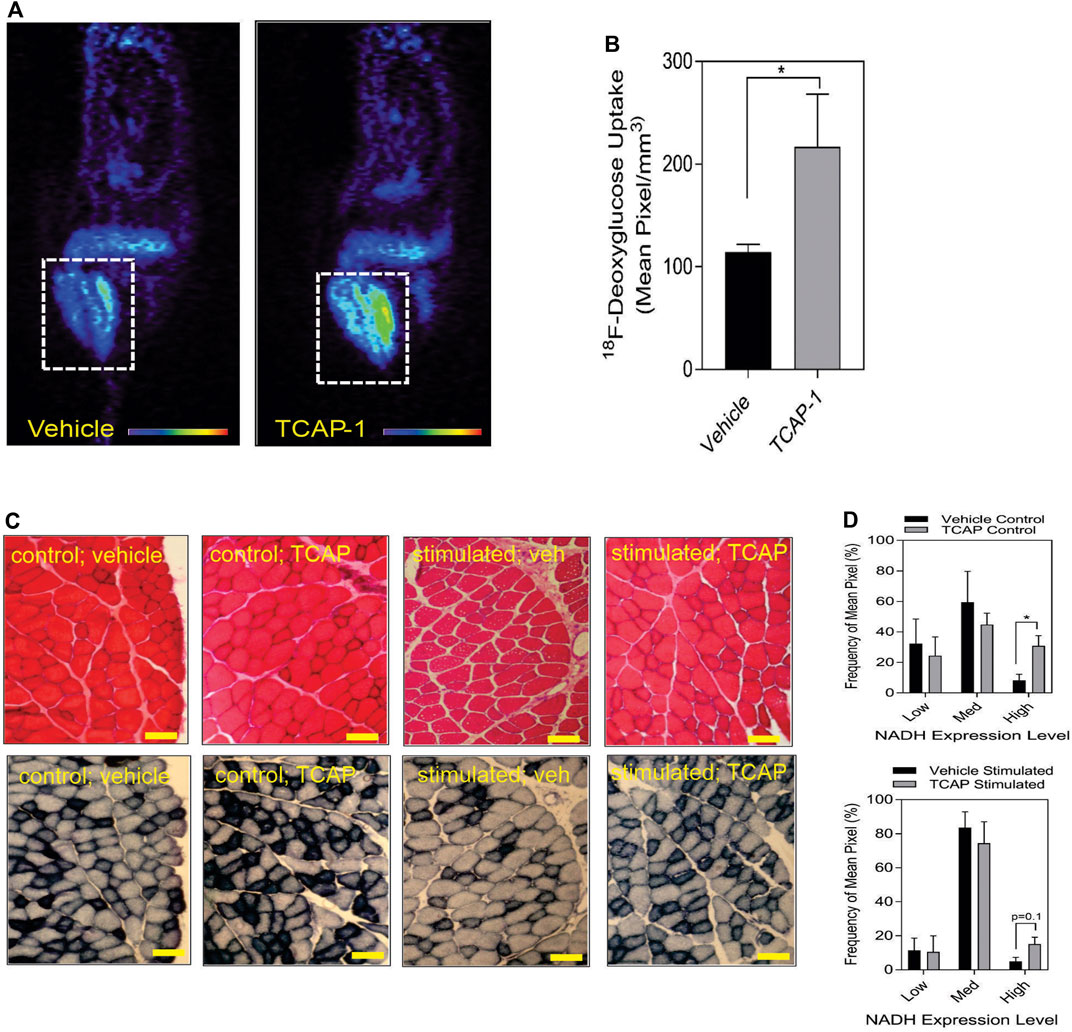
3.1.2 Glucose uptake and energy substrate studiesTaken together, these studies indicated that TCAP-1 may increase glucose transport into skeletal muscle. Therefore, TCAP-1-induced glucose uptake into the hind-limb was measured directly by fPET. Thus, using 18F-deoxyglucose (FDG), a single dose of TCAP-1-treatment induced FDG uptake in the hind-limb muscle by 2-fold (p < 0.05) (Figures 4A,B) after 3 days of treatment relative to vehicle treatment in contrast to the scTCAP-1 treatment. These data corroborated our supposition that TCAP-1 acted, in part, to increase glucose importation into skeletal muscle. If this was the case, then this increase in glucose importation initially should induce skeletal muscle NADH production as a result of 2-glyceraldehyde-3-phosphate conversion to 2–1,3 diphosphoglycerate and secondarily through elements of the tri-carboxycyclic (TCA) acid cycle of the mitochondria (MT) in the conversion to pyruvate. TCAP-1-treated muscle significantly (p < 0.05) increased static NADH-staining compared to vehicle (Figures 4C,D) supporting a role in increased TCAP-1-mediated-glucose transport and potential MT activity. These static NADH studies were corroborated by subsequent in vitro studies (see Section 3.2).
FIGURE 4. Glucose uptake and metabolism in rat hind-limb and TA muscle. (A) functional Positronic Emission Tomography of rat hind limb showing increase of 18F-deoxyglucose (18F-DG) uptake after 3 days from TCAP-1 administration. (B). Quantification of the 18F-DG uptake in hindlimb after 3 days. (n = 5; student’s t-test; p < 0.05). (C). Stimulation of NADH in TA muscle after administration of TCAP-1. Above panel, (hematoxylin and eosin stain), bottom panel, NADH activity (shown as black regions). Scale bar indicates 100 µM. (D). Quantification of the NADH-labelled cells shown in “C”. * p < 0.05; **p < 0.01; ***p < 0.001; ****p < 0.0001. Mean ± SEM indicated n = 4.
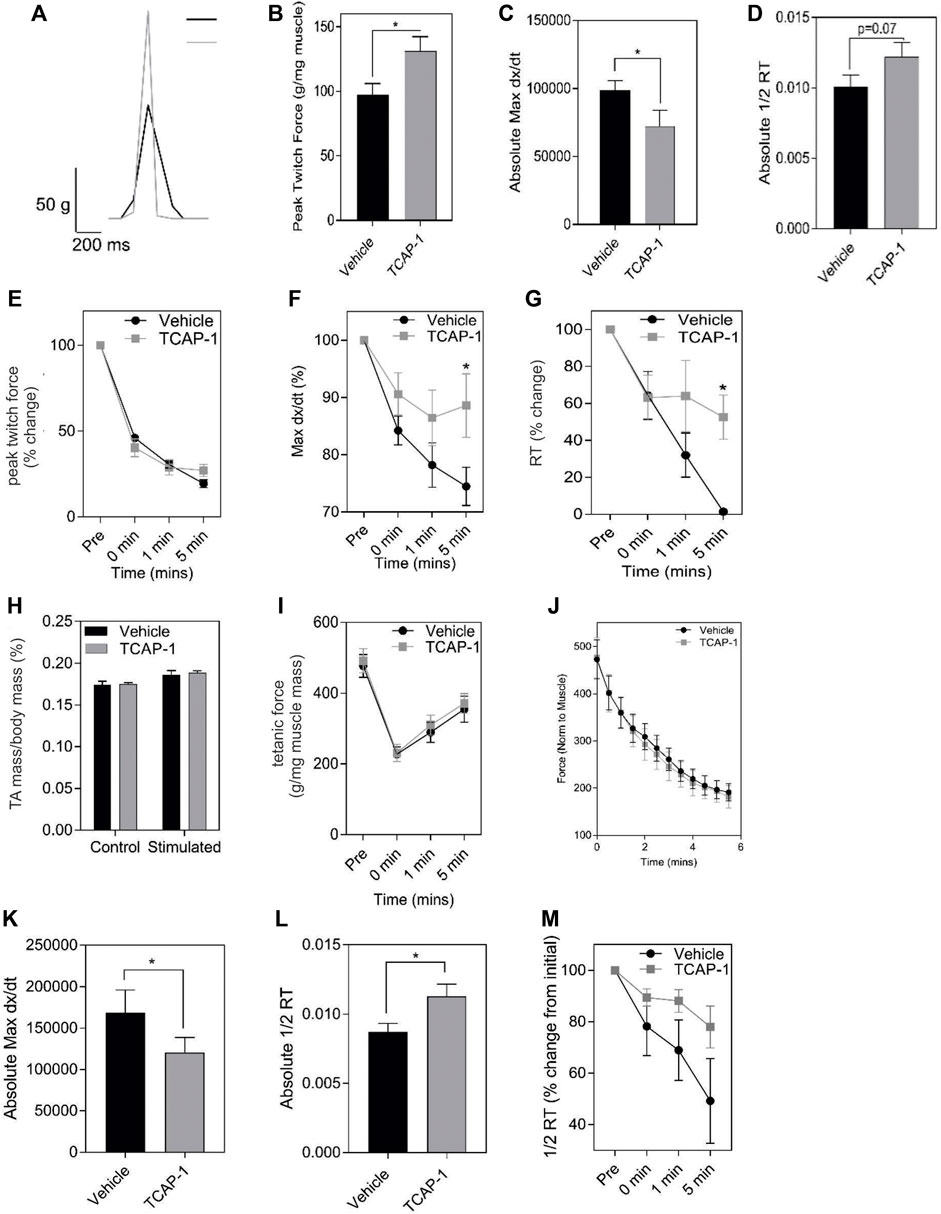
3.1.3 Muscle contractility and fatigueMuscle performance is related to the amount of energetic substrates available. Therefore, we examined the role of TCAP-1 on muscle activity in vivo in rats by determining the efficacy of TCAP-1-mediated contractility using electrical stimulation of the TA muscle. After a 5-day daily treatment of either vehicle or TCAP-1, following a 3-day washout period, muscle contractility was assessed. TCAP-1-treated animals showed improved muscle dynamics where TCAP-1-treated animals exhibited enhanced baseline contraction kinetics with respect to increased peak twitch force (p < 0.05) (Figures 5A,B), slower contraction velocity (p < 0.05) (Figure 5C), and potentially higher faster relaxation rates (Figure 5D) compared to vehicle-treated animals. Following baseline measurements, a 6-m fatigue protocol was induced to establish the time line of the contractive force in the muscle where contractile kinetics were recorded at 0, 1, and 5 m after the fatigue protocol. TCAP-1 enhanced recovery from the twitch stimulation (Figures 5E–G). Although TCAP-1 did not influence peak twitch force (Figure 5E), it significantly (p < 0.05) maintained twitch max dx/dt (Figure 5F) and 1/2RT (Figure 5G) over the course of the fatigue protocol which was diminished in vehicle-treated animals. All data were normalized to muscle mass. The treatment did not affect muscle mass (Figure 5H), tetanic force (Figure 5I) or the fatigue force curve (Figure 5J). Thus, TCAP-1 enhanced the efficiency of the existing muscle morphology, rather than increasing muscle mass, and maintained contraction cycling efficiency during fatigue. To assess the effects of a long-term (LT) treatment, rats were administered either vehicle or TCAP-1, for 3 months (1 injection/week). At 2w post-treatment, the TCAP-1-treated animals elicited a comparable peak twitch force to vehicle-treated animals (Figures 5J,K), however, had significantly (p < 0.05) slower contraction velocity and faster (p < 0.05) relaxation rate (Figures 5L,M).
FIGURE 5. In vivo actions of TCAP-1 on rat TA muscle kinetics. (A–J). Muscle twitch kinetics after animals treated with TCAP-1 once a day for 5 days before testing (A). Representative twitch traces (black, vehicle; gray, TCAP-1). (B). Baseline contraction kinetics (t-test). (C). Contraction velocity (t-test). (D). Relaxation rate (t-test). (E). Peak twitch force (2-way ANOVA). (F). Twitch max dx/dt (2-way ANOVA). (G). 1/2RT analysis (2-way ANOVA). TCAP-1 treatment did not affect muscle weight (t-test) (H), tetanic force (t-test) (I) or fatigue force over time (J) (n = 7–8). (K–M). Long term treatment of TCAP-1 on rat hind-limb twitch kinetics. (K). contraction max dx/dt. (L). 1/2RT rate. (M). Relaxation rate.
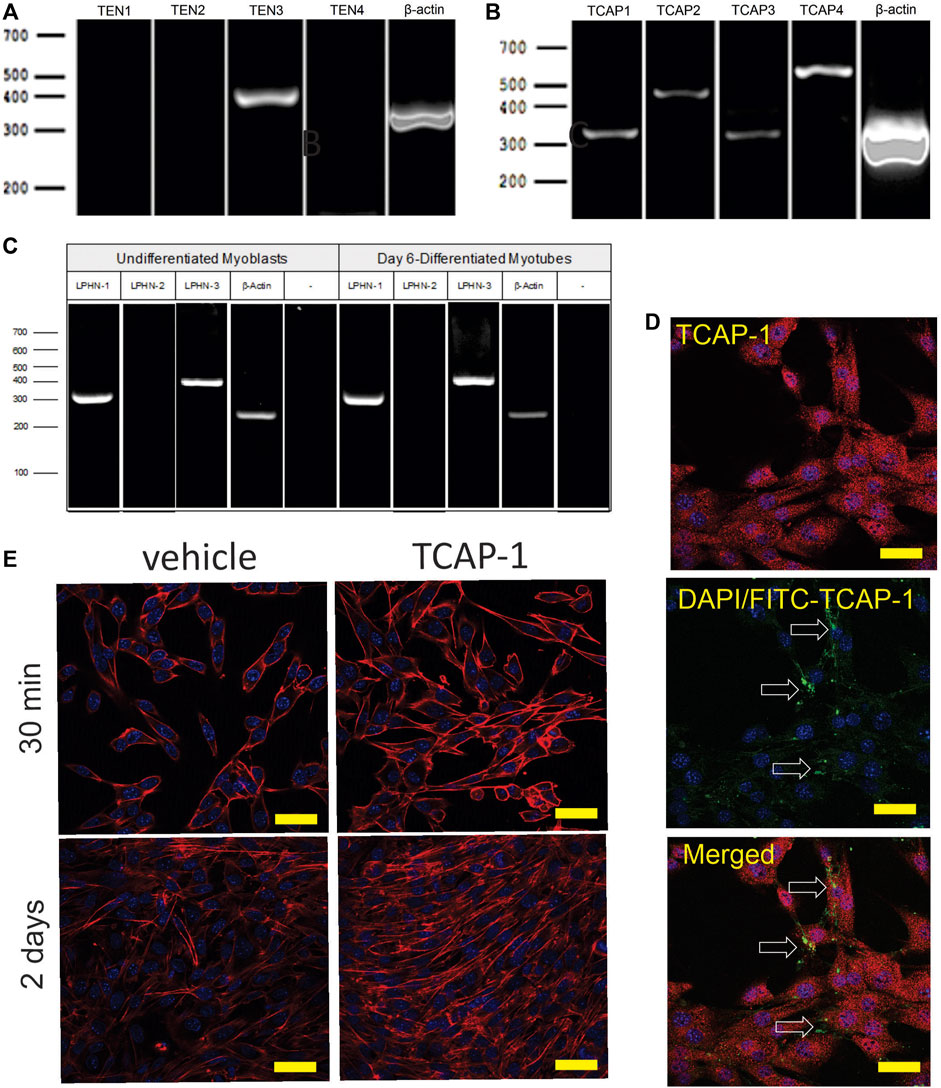
3.2 In Vitro mouse cell studies3.2.1 Molecular studiesThe initial PCR screen of C2C12 cells indicated that, although only teneurin-3 was highly expressed (Figure 6A), all 4 TCAP transcripts could be discerned (Figure 6B). In both undifferentiated C2C12 myoblasts, and 6-day myotubules, the transcripts for LPHN-1 and -3 were present (Figure 6C). ICC expression of TCAP-1 showed a similar punctate expression in the cytosol of the ir-TCAP-expressed C2C12 myoblasts (Figure 6D) as we have previously shown for neurons (Chand et al., 2012). In contrast, FITC-labelled TCAP-1 was present at several sarcolemmic regions consistent with the expected expression of the receptor but again similar to what was previously observed in neurons (Chand et al., 2012; Chand et al., 2013b; Husic et al., 2019). Moreover, because TCAP-1 regulates actin organization and polymerization in neurons (Chand et al., 2012), the C2C12 cells were treated with TCAP-1 and examined using the phalloidin stain to highlight actin fibers (Figure 6E). This treatment resulted in a major increase in actin polymerization in the TCAP-1-treated cells at both 30 m (p < 0.01) and 2 days (p < 0.001).
FIGURE 6. Expression of teneurin, TCAP and LPHN in C2C12 myoblasts. (A). PCR-based teneurin expression; (B). PCR-based TCAP expression; (C). PCR-based LPHN expression. (D). C2C12 cells labelled with TCAP-1 antisera showing the difference between the endogenous ir-TCAP and the presence of FITC-TCAP-1 localization. ir-TCAP-1 is indicated in red, whereas the DNA-associated DAPI labelling is indicated in blue. FITC-labeled TCAP-1 is shown in green. Arrows indicate regions of FITC-TCAP-1 uptake. Scale bars indicate 50 μM (E). Actions of TCAP-1 on the proliferation of the C2C12 myoblasts when treated with TCAP-1 at 30 min and 2 days. Actin is indicated in red, whereas the nuclei are indicated in the DAPI-based blue. Scale bars indicate 100 µM.
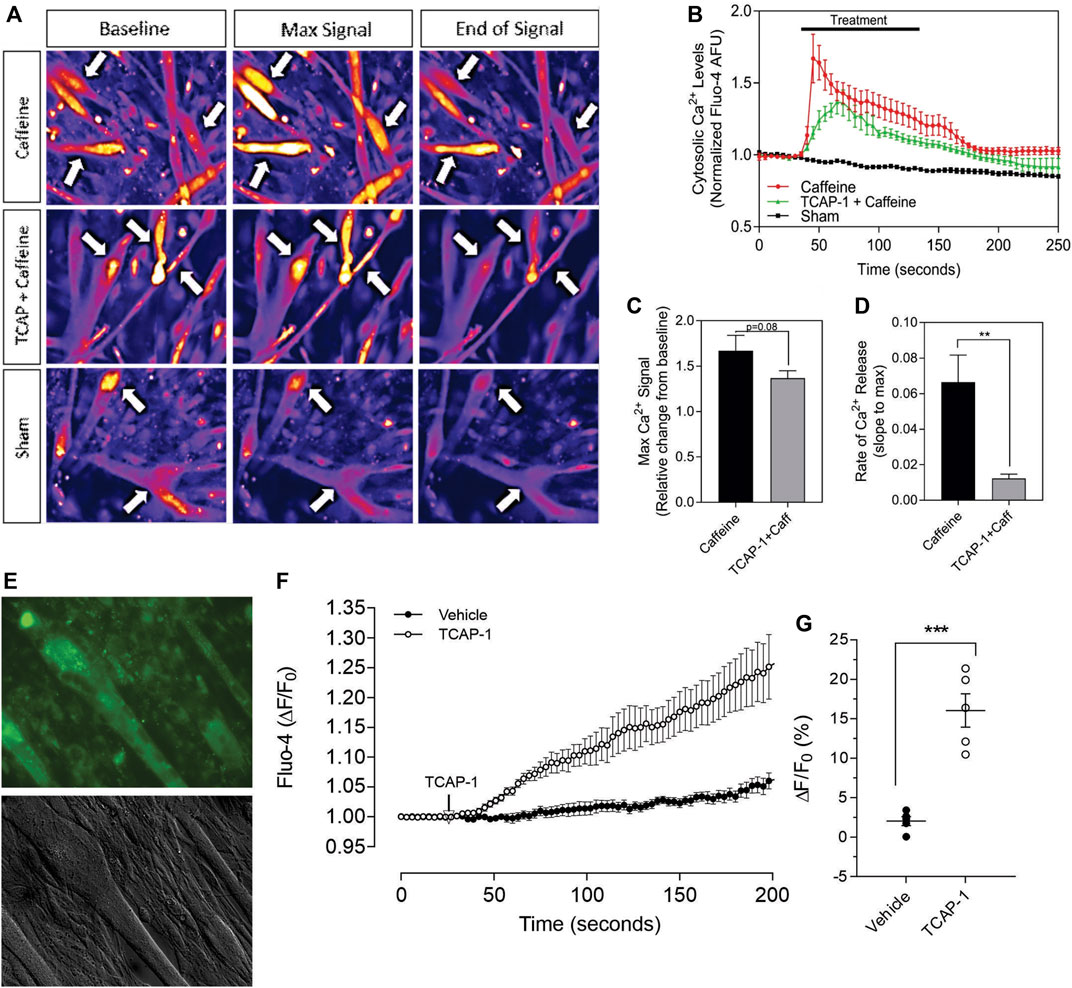
3.2.2 Caffeine C2C12 viability studiesHaving established that TCAP-1 behaved in a similar manner as previously shown in neurons, the viability of the Ca2+ response in the differentiated myotubules was evaluated to determine their efficacy before proceeding to further studies. Initially, caffeine was used to determine the potential limits of the Ca2+ response in the differentiated myotubules relative to the TCAP-1 response (Figures 7A–D). These studies indicated that the myotubules were active and viable, and with respect to the Ca2+ response, did not show an appreciable decrease in cytosolic Ca2+ concentrations (Figure 7B), although it did attenuate the rate of cytosolic Ca2+ concentrations (p < 0.01). Taken together, these studies indicated that the myotubules were viable with respect to our preparation, and that the attenuating TCAP-1 response indicated that additional regulating factors were likely present. Thus, given these observations, the direct action of TCAP-1 on Ca2+ flux in myotubules was examined (Figures 7E–H). TCAP-1 increased Ca2+ concentrations by almost 4-fold relative to the control-treated cells (p < 0.001).
FIGURE 7. Caffeine- and TCAP-1- mediated Ca2+ response in differentiated C2C12 myocytes. (A). Heat-map images showing the Ca2+ response induced by caffeine, TCAP-1 or vehicle. Mean and SEM is indicated. (B). Dynamic concentration changes over the period of analysis shown in “A”. Mean ± SEM is indicated. (C). Total concentration changes of the manipulations of the study period indicated in “A”. (D). Rate of Ca2+ release between caffeine and TCAP-1. (E). TCAP-1 mediated Ca2+ actions show normal morphology in cells. (F). Rate of increase in Ca2+-associated fluorescence after administration of TCAP-1. (G). Quantification of the change in TCAP-1 mediated intracellular Ca2+ concentrations indicated in “F”. Significance was determined by a Students t-test. (* p < 0.05; **p < 0.01; ***p < 0.001; ****p < 0.0001. Mean ± SEM indicated n = 4). Note that in this Figure, that F/F0 has been set to “1” for clarity.
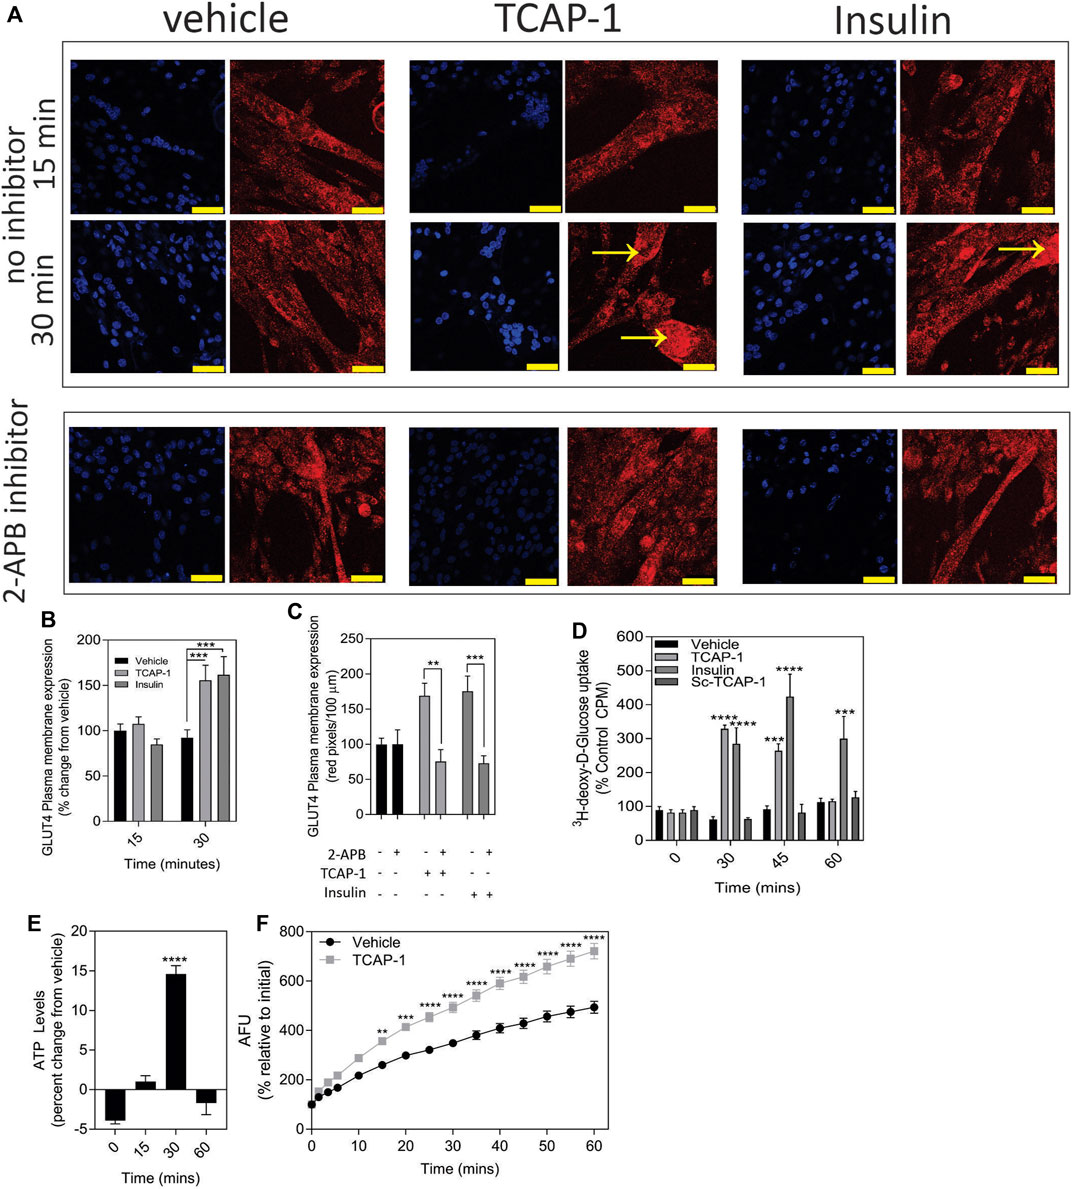
3.2.3 Glucose transporter studiesIn skeletal muscle, the predominant glucose transporter protein (GLUT) isoform is the insulin-sensitive GLUT4 protein. Using insulin as a control, a significant (p < 0.001) increase in the expression of the ir-GLUT4 transporters was observed for both TCAP-1 and insulin treatments over 30 m (Figures 8A,B) in C2C12 cells. To determine whether this ir-GLUT4 response was dependent on the TCAP-1-mediated Ca2+ release, the IP3R antagonist, 2-APB, that abolishes the TCAP-1 Ca2+ response, was investigated. In the presence of the inhibitor, both TCAP-1 (p < 0.01) and insulin (p < 0.001) inhibited the ir-GLUT4 expression (Figures 8A,C). This importation of glucose by TCAP-1 was further corroborated in C2C12 cells showing that TCAP-1 significantly (p < 0.0001) induced 3H-2-deoxyglucose increase into the cytosol over 30m, similar to that of insulin (Figure 8D). However, both peptides show distinct glucose-uptake profiles; whereas insulin induced a significant increase at 30 m (p < 0.001), 45 m (p < 0.001) and 60 m (p < 0.01), TCAP-1 increased glucose uptake at 30 m (p < 0.001) but was attenuated by 45 m (p < 0.01) and returns to baseline at 60 m. The scTCAP-1 treatment, used separately as a negative peptide control in this study, showed no significant change from the saline vehicle.
FIGURE 8. TCAP-mediated glucose metabolism in C2C12 cells. (A). Regulation of ir-GLUT4 by TCAP-1 and insulin myotubules. Red indicates ir-GLUT4 whereas blue shows DAPI staining of the nuclei. Arrows indicated regions of high immunoreactivity. Scale bar = 100 µM. (B). Quantification of ir-GLUT4 expression over 30 min. (C). Effect of the IP3R inhibitor, 2-APB on TCAP-1- and insulin-mediated ir-GLUT4 labelling. (D). Uptake of 3H-2-deoxyglucose in C2C12 myoblasts by TCAP-1 and insulin. (E). Changes in static ATP concentrations following treatment by TCAP-1. (F). NADH production increase as determined by a resourin assay following TCAP-1 treatment relative to the vehicle. Significance was determined by a t-test as indicated in (C, F), or one-way ANOVA shown in B D and E. (* p < 0.05; **p < 0.01; ***p < 0.001; ****p < 0.0001. Mean ± SEM indicated n = 6).
3.2.4 ATP and NADH turnover studiesIncreased glucose importation increases ATP and NADH turnover in cells due to glycolytic and tricylic acid (TCA) cycle activity. Therefore, this was examined with respect to TCAP-1 treatment. As a result, both ATP (p < 0.001) (Figure 8E) and NADH (p < 0.001) (Figure 8F) turnover were significantly increased after 30 m of TCAP-1 treatment, although NADH levels remained about 60% higher (p < 0.001) than vehicle levels after 60 m.
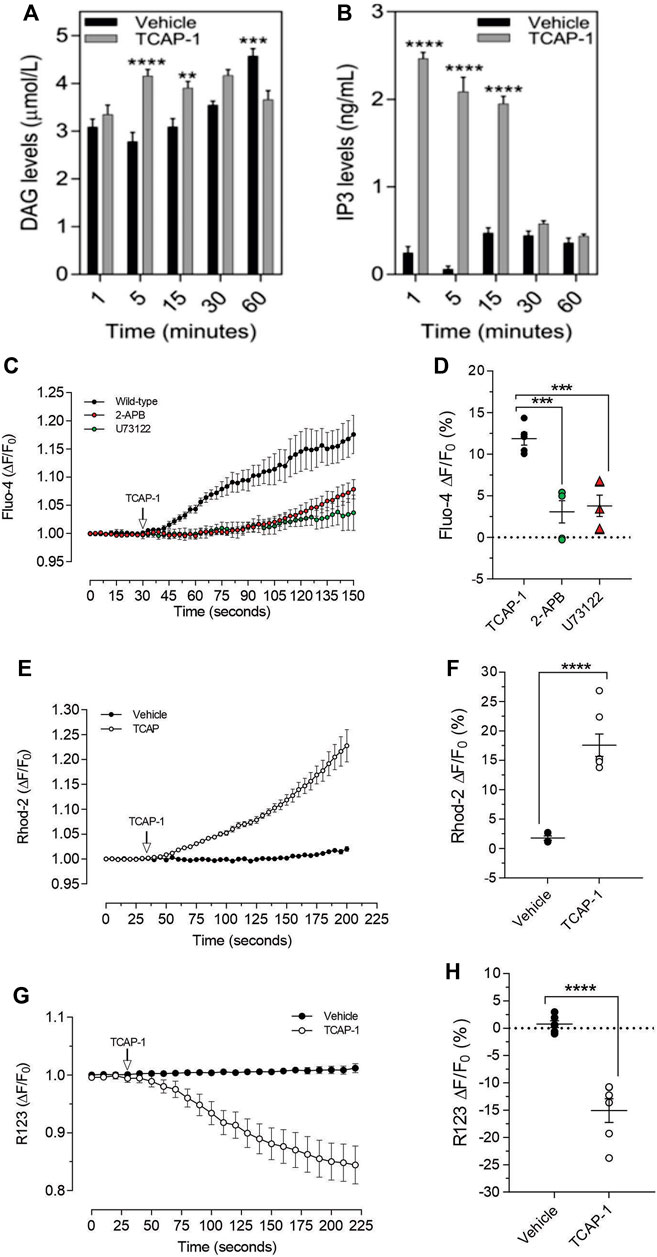
As we have previously established that the IP3-DAG pathway is important for TCAP-1-mediated intracellular Ca2+ flux in neurons, this pathway was examined in C2C12 cells. Relative to the vehicle, TCAP-1 induced a significant increase at 5 and 15 m (p < 0.001; Figure 9A) in intracellular DAG concentrations and a major increase between 1 and 15 m (p < 0.0001; Figure 9B) in IP3 concentrations. To confirm this action, TCAP-1-treated C2C12 cells were blocked with either the IP3R antagonist, 2-APB, or the phospholase C inhibitor, U73122. The 2-APB and U73122 treatment reduced TCAP-1-mediated Fluo-4 concentrations to about 30% (p < 0.01) of their original values indicating that the IP3-DAG pathway plays an active role in increase of TCAP-1-mediated intracellular Ca2+ flux (Figures 8C,D). Because this TCAP-1-mediated rise in intracellular Ca2+ concentrations can target the MT (Hogg et al., 2018), the MT Ca2+ dye, Rhod-2 was utilized to determine the concentration of Ca2+ sequestration in MT. There was a 5-fold increase (p < 0.001) in Rhod-2-associated Ca2+ labelling over 200s (Figures 9E,F). Related to this, Rhod-123, was used to determine the level of MT polarization. TCAP-1 treatment significantly decreased Rhod-123 fluorescence (p < 0.001) relative to vehicle indicating depolarization of the MT membrane (Figures 9G,H).
FIGURE 9. TCAP-1 mediated calcium regulation in C2C12 cells. (A). TCAP-1 mediated increase in intracellular DAG concentrations (mean and SEM shown; n = 6). (B). TCAP-1 mediated increase in intracellular IP3 concentrations (mean and SEM shown; n = 6). (C). Increase in intracellular TCAP-1 mediated Ca2+ concentrations and inhibition by the IP3 receptor (2-APB) and phospholipase C (U73122) antagonists; (D). Quantification of data shown in C (n = 6). (E). Uptake in Ca2+-mediated Rhod-2 into mitochondrial membranes. (F). Quantification of data shown in “E” based on the change at 200 s. (G). Decrease in Rhod-123 immunofluorescence in mitochondrial membranes as a result of TCAP-1 administration. This decrease in Rhod-123 indicates a decrease in mitochondrial membrane depolarization. (H). Quantification of the data indicated in G based on the changes at 225 s (* p < 0.05; **p < 0.01; ***p < 0.001; ****p < 0.0001.) Note that in this Figure, that F/F0 has been set to “1” for clarity.
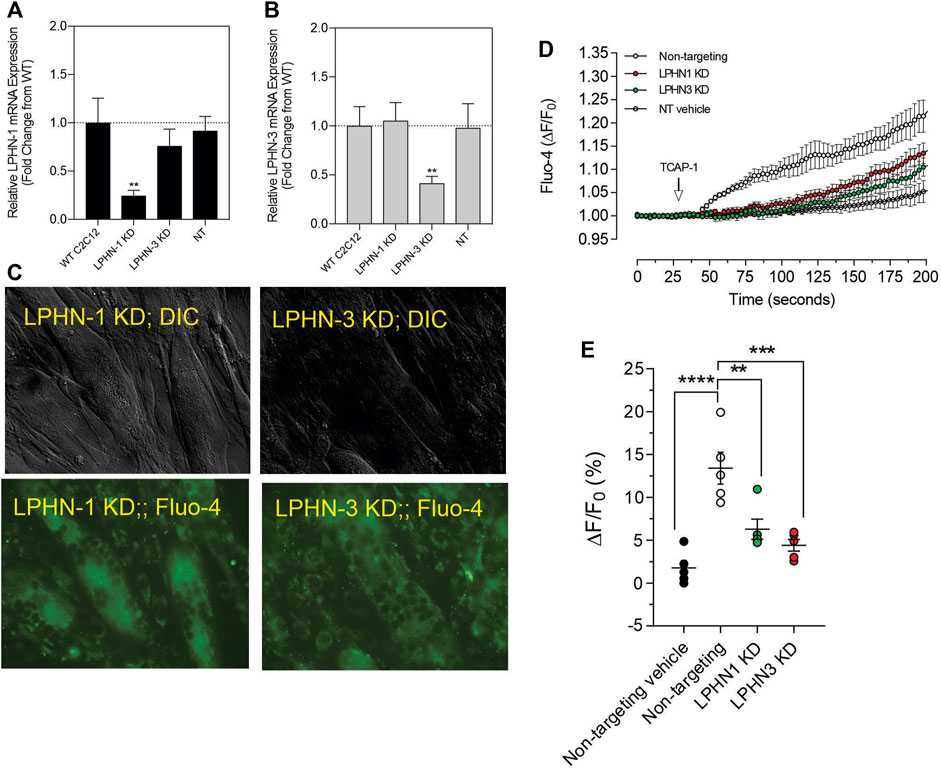
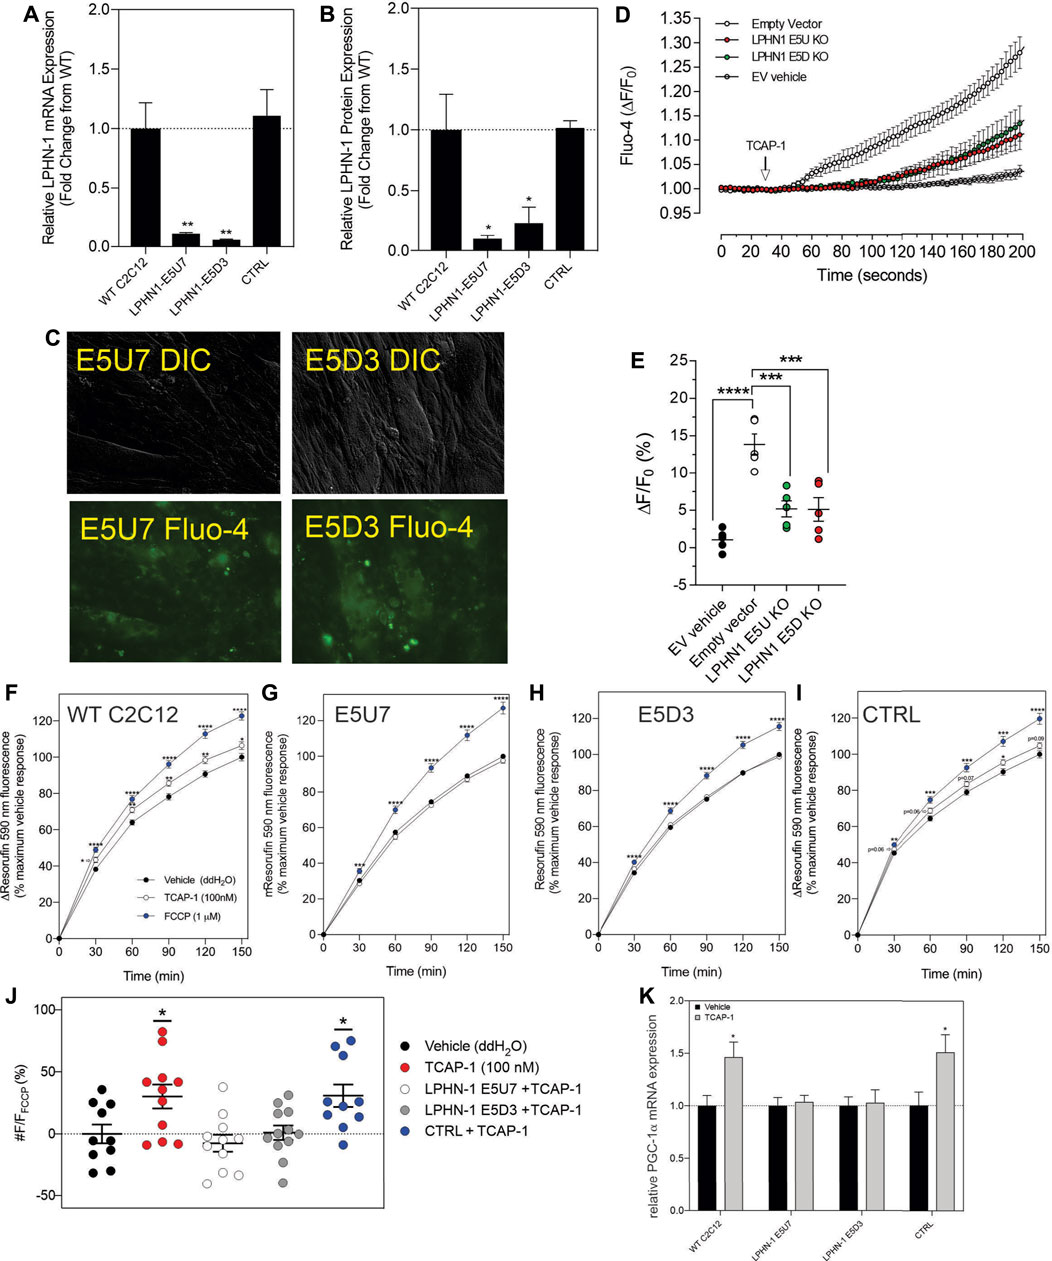
3.2.5. Attenuation of LPHN by siRNA and CRISPR methodsAlthough these studies are similar with previous investigations of teneurins, TCAPs and LPNHs in neurons, this is the first study to examine teneurin/TCAP and LPHN activity in skeletal muscle function. To determine whether the TCAP-1 activation was dependent upon the LPHN receptors, these genes were knocked-down (KD) using siRNA oligonucleotides, or knocked-out (KO) using CRISPR in the C2C12 cells. Despite the modification of receptor expression in these methods, cell morphology was essentially identical to the morphology of the cells indicated in Figure 7. Using the C2C12 cells, the LPHN-1 and -3 expression was reduced using the siRNA oligonucleotides. The LPHN-1 receptor mRNA was reduced about an 80% (p < 0.01) relative to the WT cells. Transfection with either the LPHN-1 siRNAs or the null-vector (NT) did not significantly change mRNA expression relative to the WT control (Figure 10A). Similarly, the LPHN-3 siRNA-associated oligonucleotides significantly (p < 0.01) decreased its mRNA expression about 65% relative to the WT cells. There were no significant changes in mRNA expression of the LPHN-1 transcript in either the LPHN-1 KD or the NT cells (Figure 10B). Despite the reduced expression of these receptors, cell morphology was normal (Figure 10C). TCAP-1 increased cytosolic Ca2+ in cells transfected with the NT control, however, relative to the NT control, TCAP-1 did not increase Ca2+ in either the LPHN-1 and -3 siRNA-transfected cells, which showed a significant decrease (p < 0.01 and p < 0.001, respectively) in intracellular Ca2+ concentrations (Figures 10D,E). However, because both LPHN-1 and -3 siRNA oligonucleotides unexpectedly reduced intracellular Ca2+ concentrations by similar amounts, we repeated this study by ablating the LPHN-1 and -3 receptors using CRISPR methods. The E5U7 target reduced LPHN-1 expression by about 90% (p < 0.01) whereas, the E5D3 target reduced mRNA levels by about 95% (p < 0.05) relative to the WT cells (Figure 11A). A significant decrease (p < 0.05) in LPHN-1 mRNA levels were present in both sets of transgenic cells (Figure 11B). Importantly, cell morphology was normal in the transgenic cells (Figure 11C). CRISPR-based KOs of the LPHN-3 gene were unsuccessful after numerous attempts hence studies were performed with the LPHN-1 KOs only. Similar to that achieved using the siRNA knock-down cells, both CRISPR-associated KO transgenic cells (E5U and E5D) reduced intracellular Ca2+ levels by about 60% (p < 0.001) (Figures 11D,E). Taken together, both the siRNA- and CRISPR-associated methods to reduce mRNA expression indicate that the TCAP-1 associated intracellular Ca2+ flux was mediated primarily by its interactions on LPHN-1 and -3.
FIGURE 10. siRNA knockdown of LPHN-1 and -3 in C2C12 cells. (A). Cells transfected with the LPHN-1-targetting siRNAs showed a significant reduction (p < 0.01) in LPHN-1 mRNA expression. (B). Cells transfected with the LPHN-3 targeting mRNA significantly (p < 0.01) reduced LPHN-3 mRNA expression. (C). Cells treated with either siRNAs showed normal morphology. (D). Changes in Ca2+ accumulation in cells transfected with either LPHN-1 or -3 siRNA oligonucleotides. (E). Quantification of the data shown in “D” at 200 s.
FIGURE 11. CRISPR-based knockouts of the LPHN-1 and -3 genes in C2C12 cells. The two clones (E5U7) (A) and (E5D3) (B) significantly reduced LPHN-1 expression relative to NT and WT cells. (C). The morphology of the C2C12 cells were normal in both transfected cell lines. (D). Changes in cytosolic Ca2+ accumulation in the various cell types. (E). Quantification of the data shown in “D” after 200 s. (F–I). Changes in NADH production as determined by the resasurin assay where the WT cells show a significant increase in the NADH-mediated resorufin fluorescence but is ablated in the E5U7 (G) and E5D3 (H) KO clones, but is retained in the null vector (NT) clone (I). (J). Quantification of the data shown in (F–I), (K). Reduction in PGA-1α mRNA expression by PCR in E5U7 and E5D3 clones. * p < 0.05; **p &
留言 (0)