Study population and data collection
This study was a two-point repeated cross-sectional survey with a nested longitudinal subsample. The first data collection wave was before the “Double Reduction” Policy and the second wave was after the “Double Reduction” Policy. Before this survey, all participants and their caregivers signed the electronic informed consent form. Our team designed a specialized platform for this project to protect data safety. The local education bureau and the department of mental health services of each school assisted in recruiting participants. All students used an anonymized student number that was assigned based on their registration status at school to log in to the platform to complete questionnaires. They were informed that they could feel free to withdraw from the study at any time. This study was approved by the Human Research Ethics Committee of South China Normal University (SCNU-PSY-2021-094). We also open a free psychological distress hotline named “Xinqing” to provide psychological services when participants needed.
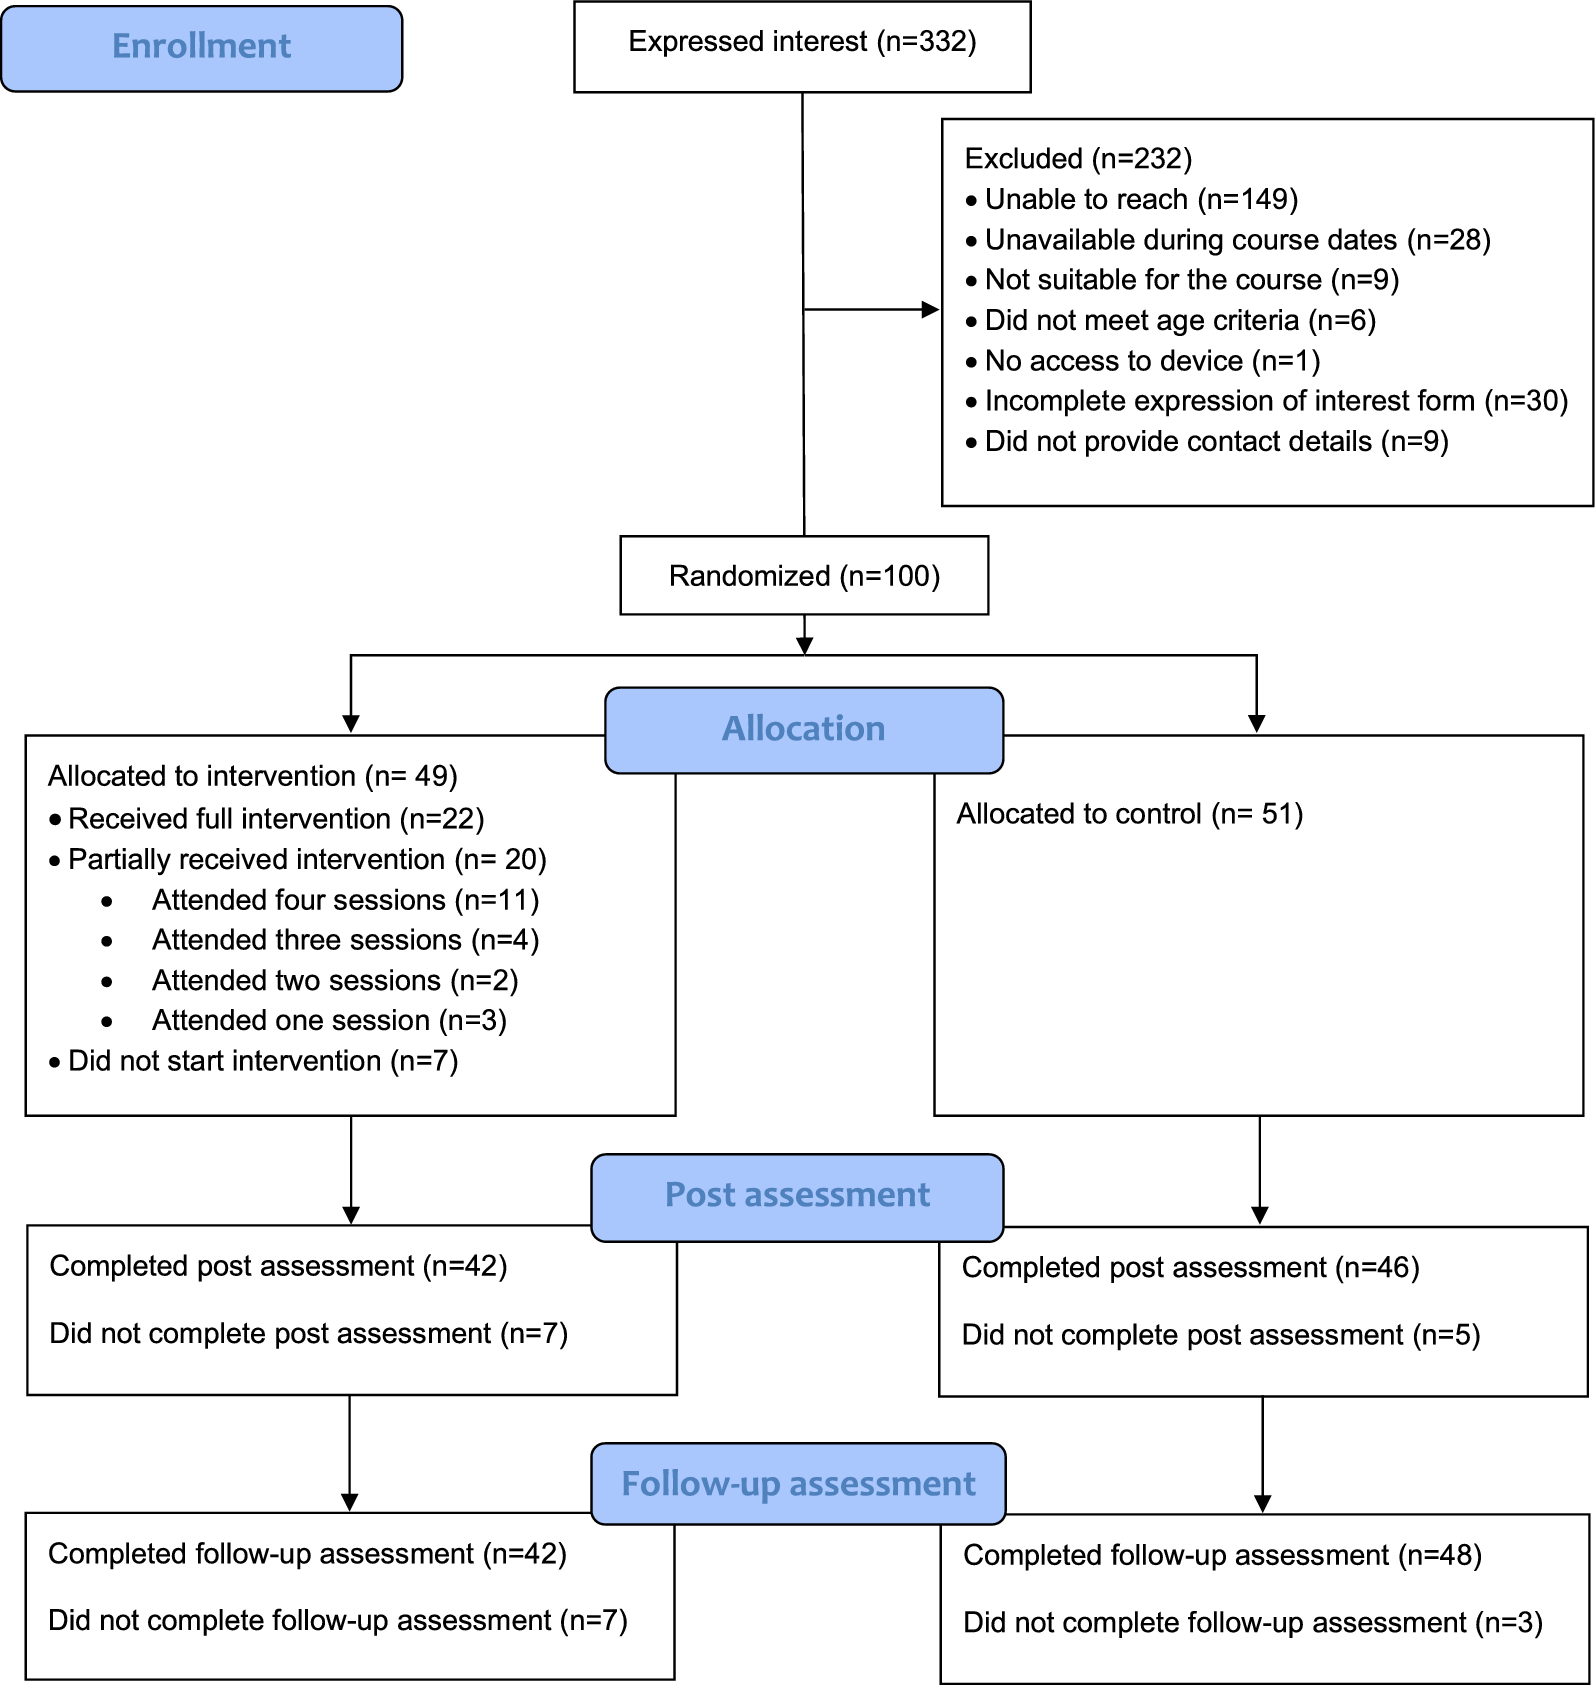
The subjects of this study were Chinese students (primary, grades 1–6; junior high school students, grades 7–9) receiving compulsory education from 152 schools in Guangdong province. We did not include grades 1–4 with the concern that they may not well understand the questionnaire due to their young age. The 9th graders were also excluded so as to follow the students for at least 2 waves before they graduated from schools. A total of 89,283 students (grades 5–8) were recruited in the first timepoint (T1), and 77,236 students (grades 5–8) were recruited in the second timepoint. In T2 survey, the students of 5th graders did not participate in T1 survey, because they were still in 4th grade when T1 survey started. Through data integration, a total of 28,542 students participated in all two web-based surveys and provided complete data on all measures. The following exclusion criteria were used to improve data quality: (a) abnormal response time; (b) inconsistent survey contents (e.g., different demographic information); and (c) having current or history of mental health illness that were identified by the caregivers or teachers. We further excluded 144 participants based on the above-mentioned criteria. Consequently, 28,398 participants were included in the analyses. We used χ2 tests to compare the prevalence of depression and anxiety at T1 between participants who provided available data for both periods and those who had missing data at T2. There was a small but significant difference between these two groups (depression: 12.6% vs 10.2%, χ2 = 106.24, p = 0.034, Cramer’s V = 0.012; anxiety: 9.0% vs 7.7%, χ2 = 42.92, p < 0.001, Cramer’s V = 0.022).
MeasuresMental health indicators
Depressive symptoms were assessed using the Patient Heath Questionnaire (PHQ-9) [11]. It consists of 9 items, responses to which range from 0-not at all, 1-several days, 2-more than half the days, to 3-nearly every day. Higher summed scores indicate higher levels of depressive symptoms. Previous work has suggested 10 as a cut-off to screen clinical depressive symptoms [12]. Psychometric properties of the PHQ-9 have been described in the Chinese population [13]. In this study, PHQ-9 showed good internal consistency in the two surveys, and the Cronbach’s α was 0.90 and 0.92, respectively.
Generalized Anxiety Disorder Scale (GAD-7) was used for screening and diagnosis of anxiety [14, 15]. Seven items were assessed from 0 (not at all) to 3 (nearly every day), with a higher total score indicating greater anxiety symptoms. A cut-off score of 10 was suggested to identify the clinically significant anxiety symptoms [16]. In the present study, Cronbach’s α of the GAD-7 was 0.94 and 0.94 at T1 and T2, respectively.
“Double Reduction” policy related measures
Five self-devised questions were used to assess students’ study and living conditions after the “Double Reduction” Policy (i.e., T2) (1) reduced homework, (2) more extracurricular activities, (3) increased physical activity, (4) more time with parents, and (5) reduced academic stress. Each item is scored from 1 (significantly increase/decrease) 3 (no changes). In this study, we recorded the five items into two categories, with the original categories 1 and 2 being combined into a new category (1 = yes, 2 = no). The Cronbach’s α of the five items was 0.82. In addition, sleep duration was assessed with an item (“How much time do you sleep every day during the past 2 weeks?”). This item included five choices: 1 ≤ 5 h, 2 = 5–6 h, 3 = 6–7 h, 4 = 7–8 h, and 5 ≥ 8 h. Sleep duration > 8 h per night was considered as sleep sufficiency in this study [17, 18].
Covariates
Demographic information included sex (boys/girls), age, grade (grade 5–8), school types (public school/private school), boarding at school (yes/no), ethnicity (Han [the major ethnic group in China]/others), whether one child or not (yes/no), parental marital status (good/poor [included separated, divorced and widowed]), family income (monthly) (< ¥12,000/¥12,000–¥30,000/ > ¥30,000/unknown), caregivers’ education (below junior high school/senior high school/college or above), chronic physical illness (yes [having at least one of the following: arthritis, angina, asthma, diabetes, visual impairment or hearing problems [19]]/no), and family history of mental disorders (yes/no).
Negative life events over the past 6 months were assessed using the Chinese version of the Adolescent Self-Rating Life Events Checklist (ASLEC) at T2 [20]. The Checklist consists of 27 items covering interpersonal conflicts, academic stress, being punished, personal loss, physical health problems, and others. Participants rated each item on a five-point scale, from 1 (not at all) to 6 (extremely severe). A higher total score indicates the greater severity of stressful life events. The Cronbach’s α of the ASLEC was 0.97 in the current sample.
Statistical analysis
Analyses were performed using IBM SPSS Statistics for Version 23.0. The McNemar’s test was used to examine differences in the prevalence of depression and anxiety between T1 and T2. The Chi-square test was used to compare the prevalence rates of depression and anxiety between different groups of demographic characteristics. Based on the cut-off scores (i.e., 10) of the PHQ-9 and GAD-7 at T1 and T2, four patterns of symptoms trajectories were established: (1) Persistent: those scores at T1 and T2 were both above the cut-off value, (2) Remission: those scores were above the cut-off value but were below the value at T2 below the cutoff at T2; (3) New-onset: those did not have mental health problems but presented at T2; (4) Resistance: those did not have mental health problems across two periods. This classification has been used in some previous studies [21,22,23]. Multivariate logistic regressions were used to examine predictors for the occurrence and patterns of depression and anxiety. Our major aim was to explore the risk and protective factors associated with increased likelihood of developing non-resistance. We set the resistance group as the referent group and compared it with the new-onset group. We also explored the influential factors associated with the decreased likelihood of developing remission. Thus, we set the persistent group as the referent group and compared it with the remission group. In the multivariate logistic regression model, odds ratio (OR) and 95% confidence interval (CI) were used to quantify the strength of the association. Considering that our sample size was relatively large, all statistical significance was set to be p < 0.001 (2-sided tests). Adjusted odds ratios in 1.2–1.5 (or 0.7–0.9) and > 1.5 (or < 0.7) were regarded as weak/moderate and strong associations, respectively [24].

留言 (0)