


記住我
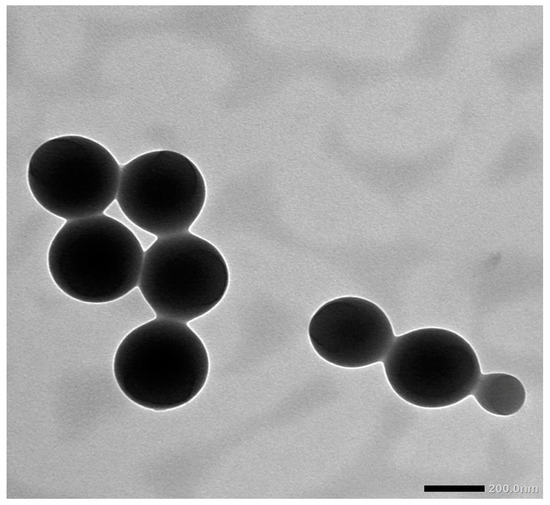
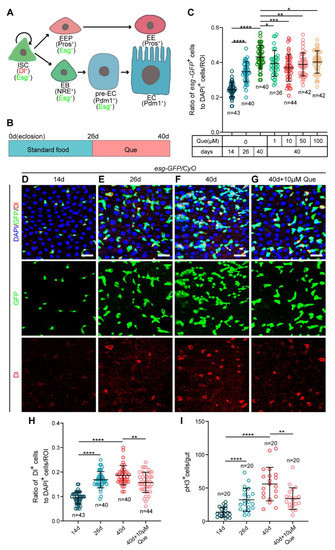
Figure 1. The diagram of the mediation hypothesis framework.
Figure 2. Relationship between composite amplitude score and indoxyl sulfate (A) and between composite amplitude score and TBARS (B) in patients with chronic kidney diseases.
Table 1. Baseline characteristics of patients with diabetic and non-diabetic chronic kidney diseases.
Table 1. Baseline characteristics of patients with diabetic and non-diabetic chronic kidney diseases.
Diabetic CKD (n = 27)Non-Diabetic CKD (n = 27)p-ValueBaseline characteristics Age (year)69.7 ± 12.467.0 ± 10.20.22Sex (male/female)16/1118/90.57Diabetes duration (year)16.2 ± 11.1- Height (cm)163.3 ± 8.0161.5 ± 8.30.42Body mass index26.5 ± 5.426.5 ± 5.40.11Waist circumstance (cm)96.8 ± 14.890.0 ± 10.30.10Systolic blood pressure (mmHg)140.5 ± 23.2151.9 ± 25.60.09Diastolic blood pressure (mmHg)75.3 ± 14.981.9 ± 16.50.13ACE inhibitor or angiotensin II receptor blocker20220.51Beta-blocker13131.0Calcium channel blocker 18140.27Diuretics810.02Alpha-blocker431.0Antiplatelet medications 1390.27Lipid-lowering medications22150.04Table 2. Baseline biochemical data of patients with diabetic and non-diabetic chronic kidney diseases.
Table 2. Baseline biochemical data of patients with diabetic and non-diabetic chronic kidney diseases.
Diabetic CKD (n = 27)Non-Diabetic CKD (n = 27)p-ValuePeripheral blood studies WBC counts (×103/mL)7.5 ± 2.56.0 ± 1.60.02RBC counts (×106/mL)4.0 ± 0.64.0 ± 1.00.93Hemoglobin, g/dL12.0 ± 1.712.0 ± 2.10.96Hematocrit36.0 ± 4.836.0 ± 6.80.98Platelet counts (×103/mL)236.2 ± 55.1195.7 ± 55.50.02UACR (mg/g)258.9 (78.3, 1052.5)276.6 (18.0, 758.6)0.43eGFR (mL/min/1.73 m2)31.2 ± 9.830.6 ± 11.40.08Creatinine (mmol/L)2.0 ± 0.82.3 ± 0.70.1Albumin (mg/dL)4.5 ± 0.34.6 ± 0.30.49Total cholesterol l(mmol/L)160.9 ± 38.5183.3 ± 57.80.11Triglyceride (mmol/L)117.5 ± 65.3118.2 ± 53.70.97HDL-C (mmol/L)45.5 ± 11.047.5 ± 13.40.56LDL-C (mmol/L)88.3 ± 30.6111.2 ± 44.80.03Glycohemoglobin (%)6.9 ± 1.15.5 ± 0.3<0.0001 * Uric acid (mg/dL)6.6 ± 1.96.9 ± 1.50.57Calcium (mmol/L)9.3 ± 0.49.4 ± 0.40.48hs-CRP, mg/L2.2 ± 1.41.7 ± 1.00.47Potassium (mmol/L)4.5 ± 0.84.5 ± 0.70.91Sodium (mmol/L)139.7 ± 4.3139.4 ± 3.50.78Phosphate (mmol/L)3.7 ± 0.83.6 ± 0.60.65CO229.2 ± 22.731.7 ± 24.60.74iPTH (pg/mL) 125.5 ± 87.8156.3 ± 94.00.6Biomarkers for endothelial dysfunction sICAM-1 (ng/mL)242.2 ± 69.1245.1 ± 29.60.93sVCAM-1 (ng/mL)1083.0 ± 259.5971.1 ± 94.00.36Biomarkers for oxidative stress TBARS, μmol/L13.4 ± 7.99.9 ± 2.60.09Thiols, μmol/L1.0 ± 0.51.1 ± 0.40.57Protein-bound uremic toxin Free-form Indoxyl sulfate (μg/mL)0.24 ± 0.170.21 ± 0.150.54Free-form p-Cresol sulfate (μg/mL)0.50 ± 0.490.45 ± 0.410.73Total-form Indoxyl sulfate (μg/mL)4.0 ± 3.33.9 ± 2.30.88Total-form p-Cresol sulfate (μg/mL)11.6 ± 10.410.4 ± 9.80.65Table 3. Clinical score and the results of the nerve conduction study and electrochemical skin conductance between patients with diabetic and non-diabetic chronic kidney diseases.
Table 3. Clinical score and the results of the nerve conduction study and electrochemical skin conductance between patients with diabetic and non-diabetic chronic kidney diseases.
Diabetic CKD (n = 27)Non-Diabetic CKD (n = 27)p-Value Toronto Clinical Neuropathy Score5.7 ± 4.13.4 ± 3.00.02 *Composite amplitude score5.3 ± 3.23.2 ± 2.80.008 *Median nerve, motor DML4.4 ± 0.64.1 ± 0.70.12CMAP8.5 ± 2.19.6 ± 2.90.12MNCV51.1 ± 4.352.9 ± 4.20.12Ulnar nerve, motor DML3.1 ± 0.43.0 ± 0.40.17CMAP7.9 ± 2.39.8 ± 2.60.004 *MNCV51.3 ± 5.554.6 ± 4.90.02 *Peroneal nerve, DML4.1 ± 0.63.8 ± 0.60.03 *CMAP2.4 ± 1.84.2 ± 2.70.004 *MNCV41.4 ± 4.346.0 ± 5.10.001 *Tibial nerve DML4.2 ± 0.64.0 ± 0.50.06CMAP7.4 ± 5.38.7 ± 4.30.29MNCV41.3 ± 5.344.5 ± 3.30.01 *Median nerve, sensory Latency3.3 ± 0.43.1 ± 0.50.04 *SNAP23.2 ± 13.230.4 ± 15.60.06SNCV42.6 ± 5.846.2 ± 7.80.04 *Ulnar nerve, sensory Latency2.6 ± 0.42.4 ± 0.30.04 *SNAP17.8 ± 12.227.7 ± 13.50.004 *SNCV46.8 ± 6.449.8 ± 5.30.07Sural nerve Latency3.1 ± 0.42.9 ± 0.30.07SNAP4.0 ± 2.79.9 ± 7.00.001 *SNCV44.8 ± 4.848.3 ± 5.30.04 *Sudoscan Hand ESC, µS40.6 ± 19.745.7 ± 18.50.30Feet ESC, µS44.4 ± 18.248.4 ± 23.60.54Table 4. Correlation analysis of composite amplitude score on cardiometabolic parameters in patients with diabetic and non-diabetic chronic kidney diseases.
Table 4. Correlation analysis of composite amplitude score on cardiometabolic parameters in patients with diabetic and non-diabetic chronic kidney diseases.
VariablesComposite Amplitude Scoresrp-ValueAge (year)0.270.04 *Height (cm)0.180.23Body mass index0.120.43Waist circumstance (cm)0.140.39eGFR (mL/min/1.73 m2)−0.0080.96UACR (mg/g)0.290.046 *Free-form Indoxyl sulfate (μg/mL)0.390.009 *Free-form p-Cresol sulfate (μg/mL)0.260.10Total-form Indoxyl sulfate (μg/mL)0.280.07Total-form p-Cresol sulfate (μg/mL)0.310.05sICAM-1 (ng/mL)0.310.02 *sVCAM-1 (ng/mL)0.44<0.0001 *TBARS, μmol/L0.350.002 *Thiols, μmol/L−0.280.045 *Total cholesterol(mmol/L)−0.190.22Triglyceride(mmol/L)−0.200.18HDL-C (mmol/L)−0.160.28LDL-C (mmol/L)−0.080.6Uric acid (mmol/L)−0.040.8hs-CRP (mmol/L)0.180.3HbA1c (%)0.040.82Table 5. Effects of the variables on composite amplitude scores in patients with diabetic and non-diabetic chronic kidney diseases according to correlation analysis.
Table 5. Effects of the variables on composite amplitude scores in patients with diabetic and non-diabetic chronic kidney diseases according to correlation analysis.
Model Regression Coefficient Standard Errorp-ValueConstant 0.560.940.56TBARS, μmol/L0.170.060.007Indoxyl sulfate (μg/mL)5.042.650.035Table 6. A simple mediation model of uremic toxin (Indoxyl Sulfate [X]) on the severity of Peripheral Nerve Dysfunction (Composite amplitude scores [Y]) through endothelial dysfunction (sVCAM-1 [M]) effort.
Table 6. A simple mediation model of uremic toxin (Indoxyl Sulfate [X]) on the severity of Peripheral Nerve Dysfunction (Composite amplitude scores [Y]) through endothelial dysfunction (sVCAM-1 [M]) effort.
Path CoefficientStandard Error p-ValueTotal effects (total relationship, path c) Ω The relationship between the IS (independent variable) and CAS (dependent variable)7.872.500.003Direct effects, path c′ The relationship between the IS (independent variable) and CAS (dependent variables) by including the sVCAM-1 (mediator) into the model5.062.560.45Indirect effect, path a The effect of the IS (independent variable) on the sVCAM-1 (mediator)704.08235.260.004Indirect effect, path b The effect of the sVCAM-1 (mediator) on the CAS (dependent variable by controlling the effect for the IS (independent variable)0.0040.0010.01
留言 (0)