
記住我


Background: The current global monkeypox virus (MPXV) outbreak has disproportionately affected gay, bisexual and other men who have sex with men (GBMSM). Given that many jurisdictions have been faced with limited supplies of MPXV vaccine, we aimed to explore optimal vaccine allocation between 2 linked GBMSM transmission networks over a short-term time horizon, across several epidemic conditions.
Methods: We constructed a deterministic compartmental MPXV transmission model. We parameterized the model to reflect 2 representative, partially connected GBMSM sexual networks ( cities), using 2022 data from Ontario. We simulated a roll-out of 5000 vaccine doses over 30 days that started 45 days after epidemic seeding with 10 imported cases. Within this model, we varied the relative city (network) sizes, epidemic potentials (R0), between-city mixing and distribution of seed cases between cities. For each combination of varied factors, we identified the allocation of doses between cities that maximized infections averted by day 90.
Results: Under our modelling assumptions, we found that a limited MPXV vaccine supply could generally avert more early infections when prioritized to networks that were larger, had more initial infections or had greater R0. Greater between-city mixing decreased the influence of initial seed cases and increased the influence of city R0 on optimal allocation. Under mixed conditions (e.g., fewer seed cases but greater R0), optimal allocation required doses shared between cities.
Interpretation: In the context of the current global MPXV outbreak, we showed that prioritization of a limited supply of vaccines based on network-level factors can help maximize infections averted during an emerging epidemic. Such prioritization should be grounded in an understanding of context-specific risk drivers and should acknowledge potential connectedness of multiple transmission networks.
The emerging outbreak of monkeypox virus (MPXV) worldwide included 1435 cases in Canada as of Oct. 28, 2022.1 A third-generation replication-deficient smallpox vaccine (Imvamune) has been licensed for use against MPXV and related orthopoxviruses in Canada since 2020, for the purpose of national security.2 Shortly after cases were reported in Canadian cities, rapid pre-exposure prophylaxis vaccination efforts were started to help reduce acquisition, infectivity and disease severity among communities disproportionately affected by MPXV, including gay, bisexual and other men who have sex with men (GBMSM).3–6 However, jurisdictions across Canada and beyond were faced with a limited local supply of vaccines during the first few weeks of the MPXV outbreak.
It is well established that prioritizing a limited supply of vaccines to subpopulations with a disproportionately higher transmission risk (i.e., acquisition and/or transmission at the individual level and/or network levels) can maximize infections averted.5–8 Such networks may have different characteristics that shape the epidemic potential within the network itself.9 This potential is often quantified via the basic reproduction number R0, which reflects the expected number of secondary infections generated by a person who is infected in a fully susceptible population.10 A network’s connectedness to other networks further shapes if and how many cases are imported by the time vaccine allocation decisions and rollout begin.11
We sought to explore the optimal allocation of a fixed supply of MPXV vaccine across 2 partially connected transmission networks (reflecting jurisdictions) of GBMSM (reflecting the community with the most cases of MPXV infection currently) under different epidemic conditions. Specifically, we explored differences between 2 jurisdictions in GBMSM population size, epidemic potential (R0), imported or seed cases, and connectedness of the 2 jurisdictions. Our goal was to produce fundamental and generalizable insights into the prioritization of MPXV vaccine in the context of interconnected sexual networks, using jurisdictions (cities) within Ontario as an example, to guide policy-makers in allocating scarce vaccines to maximize infections averted.
MethodsStudy designWe constructed a deterministic compartmental model of MPXV transmission. Although stochastic network-based models can capture uncertainty and complex contact patterns better, deterministic compartmental models can estimate expected epidemic dynamics and have smaller data requirements, which are attractive during an emerging epidemic.12 Risk heterogeneity and associated mixing patterns can also be captured in compartmental models via risk-based population stratification.13
Setting and populationThe modelled population represents 2 partially connected, sexual transmission networks of GBMSM, although the model captures both sexual and nonsexual transmission. For the purpose of this study, we interpreted the 2 networks as 2 cities ( cities A, B), having a combined GBMSM community size of 100 000 people.
To ground our analyses in a plausible epidemic context in Canada, we used the early MPXV situation in Ontario. The first reported case in Ontario occurred May 20, 2022;14 therefore, we posited possible exposures up to 21 days before in Toronto. Pre-exposure prophylaxis vaccination began June 12, 2022.15 At the time of initial vaccination rollout, about 5000 doses were available in Ontario and decisions were underway about optimal allocation of this limited supply across health units and cities in the province (S.M.: personal communication, 2022).
Model structure and parameterizationOur model included 6 health states: susceptible, vaccinated, exposed, infectious, isolating and recovered (Figure 1A). Each city was further stratified by levels of sexual risk (higher or lower defined by the numbers of sexual partners) to reflect vaccine prioritization2 and observed differences in the risk of MPXV infection.16 Table 1 summarizes the default model parameters. The definitions of higher and lower levels of sexual risk are outlined in Appendix 1, available at www.cmaj.ca/lookup/doi/10.1503/cmaj.221232/tab-related-content.
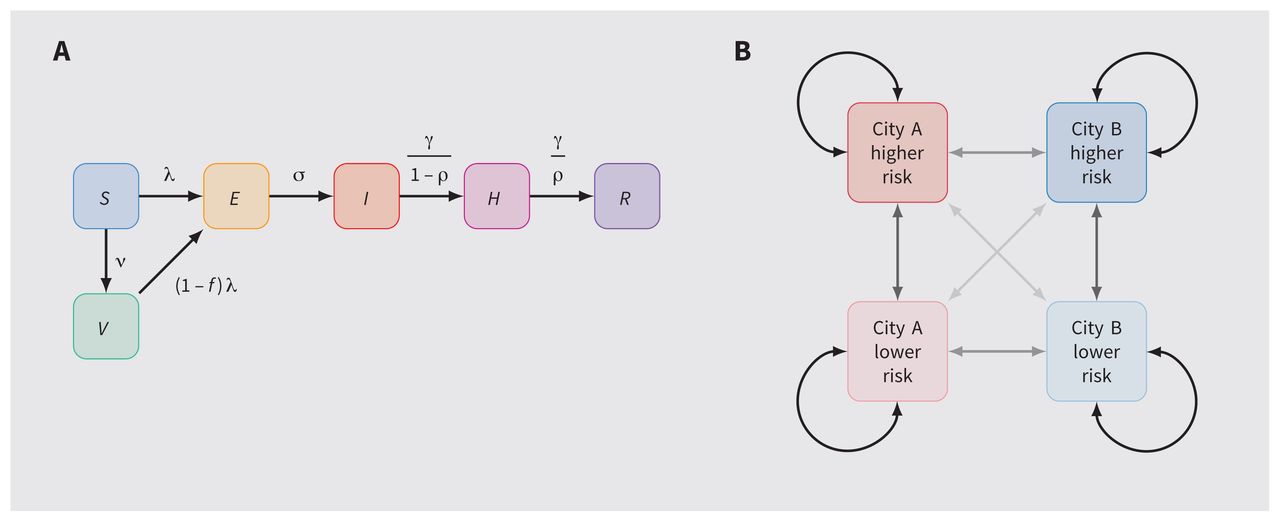 Figure 1:
 Model structure. (A) Health states and transitions. (B) Cities, risk groups and contact networks. Note: E = exposed, H = isolating, I = infectious, R = recovered, risk = risk of monkeypox virus infection or transmission, defined by numbers of sexual partners (definitions in Appendix 1, available at www.cmaj.ca/lookup/doi/10.1503/cmaj.221232/tab-related-content), S = susceptible, V = vaccinated. Arrow opacity is qualitatively related to the chance of sexual contact formation from any group to another (higher opacity reflects a greater chance of contact). Rate definitions can be found in Appendix 1, Section A (model details).
Table 1:Model parameters, including default values and ranges evaluated via grid sweep
To parameterize the model, we drew on previous analyses of GBMSM sexual networks in Canada17,20 and emerging MPXV epidemiological data in the context of the current epidemic.22–24,26,31 We calibrated the average numbers of sexual partners among the higher-risk group to obtain city-specific R0 that ranged from 1 to 2. Appendix 1 provides additional details about the model implementation and parameterization.
We initialized all simulations with 10 imported or seed cases in the higher-risk groups, distributed across the 2 cities as described in the Analysis subsection, and across the exposed, infectious and isolating stages proportionally by mean stage duration.
AnalysisWe simulated the distribution of 5000 vaccine doses over 30 days, starting 45 days after initial cases were imported (although not necessarily detected). Doses were imperfectly prioritized to the higher-risk group with 90% sensitivity (i.e., 4500 doses reached the higher-risk group and 500 reached the lower-risk group), which reflected early risk-based eligibility criteria in some jurisdictions.3
With this fixed timeline and risk-based prioritization, we explored optimal vaccine allocation between cities A and B over a range of epidemic conditions. For a given set of conditions, we defined the optimal vaccine allocation as that which resulted in the fewest cumulative infections by day 90 in both cities. We identified optimal allocation using the optimize (https://www.rdocumentation.org/packages/stats/versions/3.6.2/topics/optimize) function in R.
We chose this 45-day time horizon and fixed 5000 vaccine doses to reflect a plausible medium-term optimization problem relevant to the early MPXV situation in Ontario. In reality, multiple changing time horizons may require consideration, different numbers of doses may become available and different rates of vaccination may be possible. We aimed to obtain generalizable insights about the relations between specific epidemic conditions and efficient geographic prioritization of a limited supply of vaccines during an outbreak.
As an example of 1 setting we analyzed, we chose parameters representative of a Toronto-like city (A) and another medium-sized Ontario city (B), with GBMSM population sizes of 80 000 and 20 000, respectively,17 and 10% sexual and social network connectivity (ɛc = 0.9).20 We also modelled R0 = 2.0 in city A versus 1.5 in city B, which reflects differences in density of sexual networks as suggested by differential prevalence of bacterial sexually transmitted infections across Ontario cities.32,33 We simulated 100% imported or seed cases in city A, which reflects observed early MPXV case distribution in Ontario.14 We then compared 2 strategies of vaccine allocation by city: proportional to population size and “optimal” (fewest infections by day 90).
Next, we performed an uncertainty analysis of the following epidemic conditions, and identified the optimal vaccine allocation between cities A and B for each combination of conditions: relative size of city A versus city B (1/4 to 4 times); relative epidemic potential in city A (R0 = 1–2 in city A v. fixed R0 = 1.5 in city B), which we adjusted via the sexual activity of the higher-risk group in city A; between-city mixing (0%–30% of all contacts formed randomly between cities); and fraction of imported or seed cases in city A versus city B (0%–100%). We calculated city-specific R0 assuming no between-city mixing.
Ethics approvalBecause this study involved the use of publicly available data, approval by a research ethics board was not required.
ResultsFigure 2 illustrates modelled MPXV incidence and cumulative infections in city A versus city B under different strategies for vaccine allocation. Because of the larger population size, greater epidemic potential (R0) and having all imported or seed cases in city A in this scenario, allocating all 5000 vaccine doses to city A yielded the fewest infections (550; solid line) by day 90 (optimal strategy). Allocating vaccines proportionally to city size yielded 615 infections (broken line), whereas no vaccination yielded 1020 infections (dotted line) (Figure 2I; corresponding incidence rates in Figure 2J).
 Figure 2:
 Modelled monkeypox virus (MPXV) cumulative infections and incidence rate in 2 cities under 3 different vaccine allocation scenarios. Gray bar indicates the period of vaccine roll-out (days 45–75). City A reflects a Toronto-like city and city B reflects a medium-sized city in Ontario. For vaccine allocation, proportional allocation (to city size) was 75% to city A and 25% to city B, and optimal allocation (most infections averted by day 90) was 100% to city A. Note: Risk = risk of MPXV infection or transmission, defined by numbers of sexual partners (definitions in Appendix 1, available at www.cmaj.ca/lookup/doi/10.1503/cmaj.221232/tab-related-content).
Allocating most or all doses to city A allowed infection incidence to rise exponentially in city B (Figure 2D and Figure 2H). However, this approach can still avert more infections overall over shorter time horizons, after which more doses may become available. Appendix 1, Supplemental Figure B.1, illustrates the opposite case (using the default model parameters in Table 1): 2 identical cities with equal seeding, where the optimal allocation is equal between cities.
Figure 3 illustrates optimal vaccine allocation between cities A and B across different epidemic conditions. Appendix 1 provides absolute and relative numbers of infections averted under optimal allocation versus no vaccination (Appendix 1, Supplemental Figure B.2, Supplemental Figure B.3) and versus vaccine allocation proportional to city size (Appendix 1, Supplemental Figure B.4, Supplemental Figure B.5), showing under what conditions optimal allocation is most important.
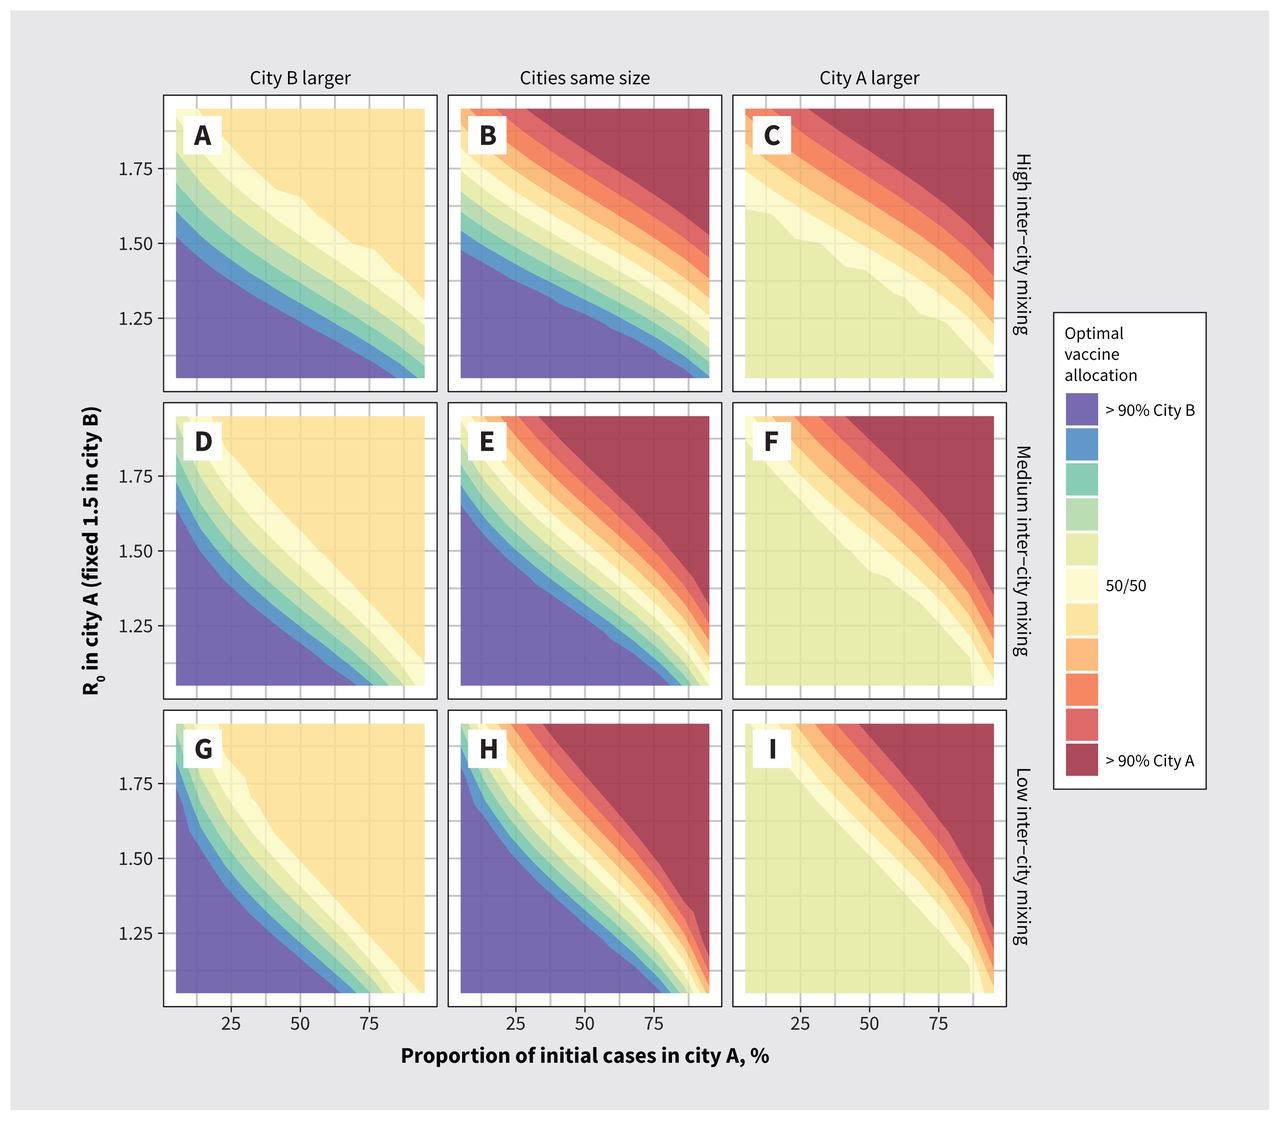 Figure 3:
 Optimal monkeypox vaccine allocation between 2 cities under different epidemic conditions. Epidemic potential (R0) in city A varies via the sexual activity among the higher-risk group in city A. We defined optimal vaccine allocation as the fewest cumulative infections by day 90. The larger city is 3 times the size of the other city. We used city assortativity (ɛc) values of 0.80, 0.90 and 0.95 for high, medium and low between-city mixing, respectively.
We found that the strongest determinants of optimal vaccine allocation were relative R0 between cities, the share of seed cases and city size, although the size of the higher-risk group was proportional to city size under our modelling assumptions. Thus, if a larger city had a large R0 and most of the seed cases, it was best to allocate most or all doses to that city in our analysis (solid red or blue corners in Figure 3).
For smaller cities with a large R0 and most of the seed cases, it was sometimes possible to vaccinate the entire higher-risk group; in such instances, the remaining doses were best allocated to the higher-risk group in the other city, yielding the plateaus (solid yellow triangles) in Figure 3 (upper right in panels A, D and G, and lower left in panels C, F and I). The plateaus show how priority populations can change if or after high levels of coverage are achieved in other populations.
When cities with most or all of the seed cases had smaller R0, doses were shared between cities under the optimal allocation strategy (to varying degrees), which suggests that both risk-based (reflecting R0) and proximity-based (reflecting initial cases) prioritization strategies worked together to minimize transmission. In such instances, the other city necessarily had few or no seed cases but a larger R0, to which the same findings apply. These conditions are represented by the yellow diagonal segments in all panels of Figure 3.
Increased levels of mixing between cities mainly acted to reduce the influence of initial seed cases and increase the influence of R0 on optimal allocation of vaccines to each city (shown by the stronger vertical gradients [contours are relatively more horizontal] in Figures 3A, 3B and 3C with more between-city mixing, v. stronger horizontal gradients [contours are relatively more vertical] in Figures 3G, 3H and 3I with less between-city mixing).
InterpretationWe sought to explore how different epidemic conditions could affect optimal allocation of a fixed supply of MPXV vaccine across 2 partially connected transmission networks (e.g., cities or jurisdictions). Under our modelling assumptions, we found that vaccines could generally avert more infections when prioritized to a larger network, a network with more initial infections and a network with greater epidemic potential (R0).
Although our study, for simplicity, focused on 2 partially connected networks, it highlights the importance of measuring outcomes for a population overall, by considering that geographies comprise interconnected networks. That is, while cities across Canada, and globally, feature important within- and between-city differences in size and configuration of transmission networks,34,35 and in access to interventions and services,33,36,37 these cities ultimately remain connected with respect to transmission and cannot be considered in isolation over longer time horizons.20,35,38 We grounded the 2 networks as “cities,” but the implications would hold across geographic scope via vaccine allocation across health units, provinces or even countries.
Within such interconnected settings, our findings are consistent with previous studies that showed that prioritizing limited vaccine supply and/or resources to communities or settings with the highest epidemic potential (shaped by density and other features of the contact network) generally yields the greatest benefit for the population overall.5,6,39 We also identified how key factors, such as number of imported cases and connections between networks, shape efficient early vaccine rollout.
Although our model parameterization reflected GBMSM sexual networks in Ontario, our findings have wider implications for MPXV vaccine rollout globally. The persistent absence of vaccine supply and rollout in regions already endemic for MPXV outbreaks across West and Central Africa, including (although not yet reported) in the context of GBMSM and sexual minorities,40 reflects another failure to uphold principles of equity in global health, paralleling missed opportunities in achieving COVID-19 vaccine equity;41 such failures also undermine efforts to control and mitigate MPXV globally.42
Prioritization based on risk also requires understanding risk. Early MPXV vaccine rollout in Ontario started in Toronto, where cases were already detected, the population size was large and rates of bacterial sexually transmitted infections suggested a potentially denser sexual network and, thus, greater epidemic potential.19 Our model implemented differential R0 between cities via contact rates; however, epidemic potential may also be linked to intervention access, including access to diagnoses and isolation support.36,43 Thus, our findings suggest that characterizing the drivers of epidemic potential across jurisdictions and communities is important, including participatory, community-based surveillance and research into the contexts that lead to disproportionate risks at a network level, not just at an individual level.44,45
LimitationsOur study aimed to provide fundamental and generalizable findings using a broad sensitivity analysis to identify conditions that can shape optimal short-term vaccine allocation with a limited supply. As with any modelling study, our results depended on our modelling assumptions and parameter values; for some of these, limited data were available. We did not evaluate population-level benefits balanced with potential adverse effects, given the existing data on high safety with the smallpox vaccines used in Canada.46,47
We used a simple compartmental model, with only 2 risk groups; future research would benefit from more nuanced representations of risk (e.g., using individual-based sexual network models). Our study also explored only 2 representative GBMSM transmission networks (cities) with a fixed number of doses. Incorporation of the wider population, additional transmission networks or calibration to observed data on cases, service availability and vaccine uptake in specific cities or relevant jurisdictions, could yield more interesting prioritization findings. However, we expect that our findings using these 2 networks would apply across different networks and conditions.
Finally, we restricted our study to a limited vaccine supply with a fixed rollout approach, and future research would benefit from exploring the sensitivity of results to different amounts of finite supply, time–variant vaccination rate and number of imported or seed cases, as well as timing of vaccine availability in relation to epidemic phase.
ConclusionStrategic prioritization of a limited vaccine supply by network-level risk factors can maximize infections averted over short time horizons in the context of an emerging epidemic, such as the current global MPXV outbreak. Notable factors include the network size, distribution of initial cases, relative epidemic potential within a given network and connectivity between networks. Such epidemic potential is defined not just by possible modes of transmission but by network configuration, access to prevention and care, and by underlying social and structural contexts. Efforts to understand and anticipate epidemic potential across and between different networks before outbreaks occur can support rapid response. Such efforts should be paired with resource prioritization to eliminate existing disparities in health care access and outcomes.
AcknowledgementsThe authors thank Kristy Yiu (Unity Health Toronto) for research coordination support; Huiting Ma, Linwei Wang, Oliver Gatalo and Ekta Mishra (Unity Health Toronto) for support with conceptualizing and parameterizing the model; and Mackenzie Hamilton (Unity Health Toronto) for her feedback on the manuscript. We also thank Toronto Public Health and members of the MPox Community Mobilization Group for their insights, ongoing engagement and feedback on preliminary results.
FootnotesCompeting interests: None declared.
This article has been peer reviewed.
Contributors: Jesse Knight and Sharmistha Mishra conceptualized and designed the study, and drafted the manuscript. Jesse Knight developed the model, conducted the analyses and generated the results. Sharmistha Mishra and Darrell Tan provided key interpretation of the results. Darrell Tan contributed critical review of the manuscript. All authors contributed to addressing revisions, gave final approval of the version to be published and agreed to be accountable for all aspects of the work.
Funding: The study was supported by the Natural Sciences and Engineering Research Council of Canada (NSERC CGS-D), and the University of Toronto Emerging and Pandemic Infections Consortium (EPIC) MPXV Collaborative Rapid Research Response. No funder had any direct role in the research. Sharmistha Mishra is supported by a Tier 2 Canada Research Chair in Mathematical Modeling and Program Science. Darrell Tan is supported by a Tier 2 Canada Research Chair in HIV Prevention and STI Research.
Data sharing: All analysis code is available at github.com/mishra-lab/mpox-model-compartmental. Figures and numeric results can be obtained directly from this code using R.
Accepted November 1, 2022.This is an Open Access article distributed in accordance with the terms of the Creative Commons Attribution (CC BY-NC-ND 4.0) licence, which permits use, distribution and reproduction in any medium, provided that the original publication is properly cited, the use is noncommercial (i.e., research or educational use), and no modifications or adaptations are made. See: https://creativecommons.org/licenses/by-nc-nd/4.0/
留言 (0)