
記住我

A common fridge housing was modified to a climate chamber. The temperature in the climate chamber is regulated with an external waterbath, which guides warm water through a cupper heat exchanger inside the climate chamber, and a strong ventilator, which homogeneously distributes the heated air in order to maintain a constant temperature of 37 °C and prevent condensation. The new exposure system was then set up inside the climate chamber. An additional external waterbath set to 37 °C was installed for an independent temperature control of the Vitrocell® exposure module (Vitrocell® GmbH, Waldkirch, Germany) to guarantee optimal conditions for the cells. Clean, particle-free compressed air was generated with a scroll compressor (Atlas Copco Kompressoren und Drucklufttechnik GmbH, Essen, Germany) attached to a catalytic air purifier (Aadco instruments, Inc., Village of Cleves, OH, USA).
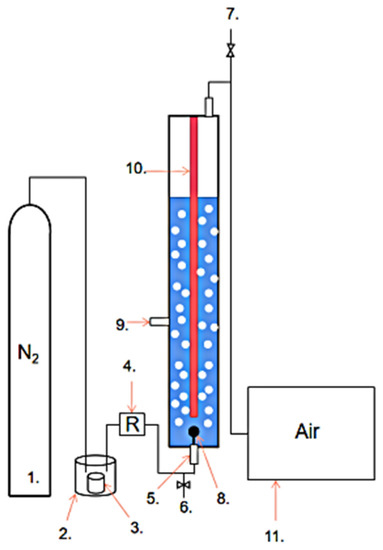
For separate exposures to gas and particle phases, glass fiber filters with high particle retention and wet strength (1.0 µm, 13 mm, binder free, Type A/E, SKC Inc., Eighty Four, PA, USA) and squared structured denuders consisting of activated carbon and ceramic (62 channels/cm2, Mann+Hummel Molecular filtration, Gefrees, Germany) were used, respectively. To minimize evaporation of particle phase after removal of the gaseous fraction, the denuders were installed as close as possible to the ALI exposure cell layer. Therefore, the dimensions of the denuders were adjusted to fit inside the Vitrocell® module trumpet inlets (Figure 1b). Afterwards, any organic remainders on the denuders were removed in a gas chromatography oven under continuous nitrogen gas supply for 2 h at 200 °C. For pure gas phase exposures, special filter holders were crafted in our workshop. The holders harboring the glass fiber filters were installed directly in front of the Vitrocell® module trumpet inlet (see Figure 1b,c).The aerosol flow is guided to the new system, where it passes the humidification unit, is split into two separate tubing channels (one for exposure and one for particle online measurements), and subsequently equally distributed among four positions in the Vitrocell® module. The first position receives a denuder (particle phase exposure), the second a filter (gas phase exposure), the third no installation (aerosol exposure), and the fourth with filter and denuder in series (clean air (CA) control). Additional independent clean air (iCA) receives an independent clean air supply line with an independent humidification unit. A detailed description of the exposure system is shown in Figure 1c. To achieve a relative humidity (RH) > 90% for cell exposures, two humidification units were installed inside the chamber. Both humidification units consisted of glass tubes with two lateral pipe attachments connected to a 250 mL Schott flask, which served as an ultrapure sterilized water reservoir (Milli-Q®, Merck, Germany). A centrifugal water pump (M400, RS PRO, RS Components, Frankfurt, Germany) continuously supplied water to the humidification units. A dialysis membrane (Spectra/Por® 4 Dialysis Membrane, MWCO: 12–14 kD, diameter 6.4 mm, Standard RC Tubing, Spectrum LabsTM, San Francisco, CA, USA) was installed inside the glass tubes through which the airflow was guided and consequently humidified. One glass tube served for the humidification of the iCA (short humidifier glass tube, 20 cm length, ID 8 mm) and the other for the humidification of the aerosol flow (long humidifier glass tube, 65 cm length, ID 8 mm). The RH and temperature were directly measured at the Transwell® insert positions inside the exposure module with sensors purchased from Vitrocell GmbH. Additionally, the denuders and filters for gas/particle discrimination of DBP were humidified at least 30 min prior to use in the exposure system.Each cell position of the Vitrocell® module received a perpendicular flow of 100 mL/min, which was guided with Iso-Versinic® tubing. These tubes are generally used in Vitrocell® ALI systems due to their conductivity, classification as USP-class VI, and biocompatibility according to ISO 10993. An aerodynamic particle sizer (auxiliary flow 1 L/min, APS, 3321, TSI Inc., Aachen, Germany) was installed inside the climate chamber after the humidification unit to measure particle size distribution and particle number concentration during exposures. For the aerosol-exposed positions, a four-way distributer (TSI Inc., Aachen, Germany) equally distributed the aerosol flow. The respective flow rates of 100 mL/min were adjusted with flow control needle valves. At each exhaust position of the Vitrocell® module a nylon filter was installed upstream of the flow control valves. Two charcoal filters were installed at the aerosol exit lines to prevent contamination of the lab environment. The pressure gauge of the vacuum pump was set to −0.8 bar. To prevent possible leakage of the system, the tightness of the tubing system was verified with a negative pressure manometer. Two ball valves were installed that allowed for an easy handling of the cell exposures: the first one was set before the flow distributer (after the humidification unit), and the second one was installed after convergence of the individual exhausts of each cell exposure position before the vacuum pump. The iCA was controlled with two independent ball valves. For details of the climate chamber and the installed exposure system, see Figure 1c. 2.3. Activated Carbon Denuder TransmissionA modified Gormley–Kennedy equation for cylindrical denuders was used to estimate the theoretical working range of the activated carbon denuders [23,24,25] to guarantee minimal particle loss and nearly complete removal of gaseous DBP. The adsorption respective transmission efficiency is a function of the flow rate and denuder length. Size-dependent particle diffusion coefficients, as well as SVOC diffusion coefficient and vapor pressure are the component parameters controlling transmission/adsorption processes. The gas adsorption and particle transmission efficiency were previously validated with complete cylindrical denuder by using toluene as vapor phase component and hexadecane droplets with 2 µm hexadecane droplets as 2µm particles, respectively. 2.4. Exposure of Human A549 Cells at the Air–Liquid Interface (ALI)Human A549 adenocarcinoma cells were purchased from the American Type Culture Collection (ATCC CCL-185). Cells were cultured in DMEM/F-12 + GlutaMAXTM medium (Gibco, Paisley, UK) supplemented with 5% inactivated fetal bovine serum (FBS, Sigma-Aldrich, St. Louis, MO, USA), and 100 U/mL penicillin–100 µg/mL streptomycin (Sigma-Aldrich, St. Louis, MO, USA). A total of 300.000 cells were seeded on a porous polyester membrane of 6-well Transwell® inserts (Product Nr. 3450, 24 mm diameter, 0.4 µm pore size, Corning, Kennebunk, ME, USA). Twenty-four hours after seeding, cells were further cultured at ALI for 24 h, and afterwards exposed to DBP (Sigma-Aldrich, St. Louis, MO, USA) over a 4 h period in the new exposure system. Briefly, cells grown on Transwell® supports were placed into the Vitrocell® exposure module inside the exposure system (37 °C) containing exposure medium consisting of the complete medium without FBS supplemented with 15 mM 4-(2-Hydroxyethyl)Piperazine-1-Ethanesulfonic Acid (HEPES, Gibco, Paisley, UK). A negative control kept in exposure medium in the incubator without CO2 during exposure was used in each experiment as a reference to distinguish possible toxic effects derived from the exposure procedure. After exposure, cells were directly harvested for toxicological analysis or post-incubated for further 20 h with complete medium at 37 °C and 5% CO2 at ALI until further analysis. Positive controls were used according to the performed assay.
2.5. Toxicity Evaluation 2.5.1. Cytotoxicity, Cell Viability, and Live Cell Imaging AssaysPotential cytotoxic effects of the new exposure system itself—together with the applied installations of denuders and filters —as well as the SVOC compound DBP were evaluated by several assays. First, the new exposure system was evaluated with clean air exposures. Live cell imaging gave an overview on the integrity of the ALI cell layer and was conducted as a qualitative control of the Resazurin assay (see below). Cells were stained with 5 µg/mL bisbenzimide Hoechst 33342 trihydro-chloride (H 33342, Sigma-Aldrich, St. Louis, MO, USA) to stain the nuclei and 2.5 µg/mL propidium iodide (Biotium, Fremont, CA, USA) to selectively stain dead cells. Pictures were taken with a fluorescence microscope (BioTek, Lionheart FX, 4× magnification) with the respective fluorescence filters. For Hoechst staining, a DAPI filter (excitation/emission wavelength 377/447 nm) was used, and an RFP filter (excitation/emission wavelength 531/593 nm) was used for PI staining. After exposure, cytotoxicity and cell viability were evaluated in terms of lactate dehydrogenase (LDH) release and cellular metabolic activity with a resazurin solution. Lactate dehydrogenase (Cytotoxicity Detection Kit, Roche, Mannheim, Germany) and Resazurin (CellTiter-Blue® Cell Vialbility Assay, Promega, Madison, WI, USA) assay were performed according to the manufacturer’s instructions. To determine the LDH release, the basolateral medium as well as the apical cell wash with Hanks’ Balanced Salt Solution (HBSS, Gibco, Paisley, UK) were collected. Cells treated with 2% Triton X-100 (Sigma-Aldrich, St. Louis, MO, USA) for 20 min before harvest served as positive controls and were used to determine the maximum LDH release. Normalization to the positive control gave the percentage of cytotoxicity. Resazurin assay was performed after exposures by incubating negative control and exposed cells with 10% resazurin solution in complete medium at 37 °C and 5% CO2 in a humidified incubator. Absorbance for LDH was detected with measurement/reference wavelengths of 493/620 nm and fluorescence for Resazurin assay was measured at 565/590 nm with a Thermo Scientific™ Varioskan™ LUX multimode microplate reader (Thermo Fisher Scientific, Schwerte, Germany).
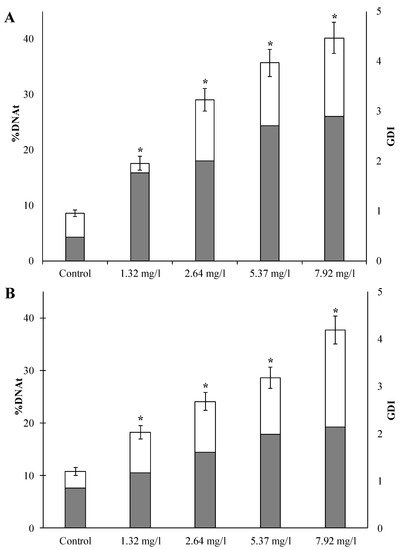
2.5.2. Evaluation of DNA Damage via Alkaline and Enzyme Version of Comet AssayThe mini-gel version of the alkaline comet assay was performed according to a previously published method [26] to detect DNA damage derived from strand break lesions. A detailed description of the procedure and buffers of the alkaline comet assay can be found elsewhere [22]. Additionally, the enzyme version of the comet assay with Formamidopyrimidine DNA glycosylase (Fpg) was conducted (4040-100-FM, Fpg FLARE™ Assay Kit, Trevigen, Gaithersburg, MD, USA) according to Di Bucchianico et al. (2017). Briefly, exposed A549 cells and controls were harvested by trypsinization (0.25% Trypsin–EDTA, Sigma-Aldrich, St. Louis, MO, USA) and diluted to a final concentration of 250.000 cells/mL. Two different positive controls were used: Cells treated with 30 μM hydrogen peroxide (H2O2) (EMSURE® Merck, Darmstadt, Germany) for 5 min served as the positive control for the alkaline comet assay, while cells treated with 1.5 mM potassium bromide (KBrO3) (Acros Organics, Geel, Belgium) for 90 min served as the positive control for the enzyme version of the comet assay as suggested previously [27]. Mini-gels on microscopy slides were created with 1% low-melting-point agarose (Sigma-Aldrich, St. Louis, MO, USA). After 1 h of lysis, slides for the enzyme version of the comet assay were washed with washing buffer over 15 min. Afterwards, the samples were either subjected to Fpg enzyme (1:5 diluted) or FLARE buffer treatment for 30 min at 37 °C in a small chamber with a humid tissue. Slides for the alkaline comet version were kept in the lysis solution during this step. Finally, all slides were subjected to 40 min of alkaline unwinding and subsequent electrophoretic separation of 25 min (270–300 mA, 1.2 V/cm2). After neutralization, the slides were air-dried at least overnight. Comet pictures of the stained nucleoids (1:10,000 SYBR™ Gold Nucleic Acid Gel Stain (Invitrogen, Eugene, OA, USA)) were taken with a LionheartFX fluorescence microscope (10× magnification, BioTek, Germany). CometScore 2.0 software (TriTek Corp) was used to manually score at least 100 nucleoids per sample. Two replicate gels per sample were made (≥ 50 nucleoids per mini-gel scored) and at least three independent biological replicates were represented for statistical analysis. The results were depicted as mean % DNA in tail corresponding to the mean of the mean replicate mean ± SD. 2.6. Modelled and Measured DBP DepositionThe deposited particle mass per area in Vitrocell® ALI exposure systems is calculated with Equation (1),deposited mass per area = (η × Q × N × T × ρ × Vp)/A
(1)
in which η is the deposition efficiency, Q is the aerosol flow, N is the particle number concentration (particle count per volume), T is the duration of the exposure, ρ is the particle density, A is the area of the deposition plate, and Vp is the particle volume assuming spherical particles. The size-dependent deposition efficiency of particles η in ALI exposure systems is calculated using the theory described in [17] and is a function of various parameters, including particle size and density, aerosol flow, geometry of the system, temperature, and pressure conditions in the system. The calculated deposition efficiency as a function of particle diameter is given in Appendix A Figure A1. In the model, the deposition of particles is controlled by diffusion and sedimentation mechanisms. Small particles deposit by diffusion and large particles by sedimentation. The particle number concentrations during exposures were measured by an APS. Density of DBP particles was set to 1.05 g/cm3. Density influences the calculations in two ways. Firstly, in determining the deposition efficiency and secondly and most critically in changing the deposited number of particles to deposited mass. The area of the deposition plate (ALI cell layer) was set to 4.7 cm2 according to the surface area of the 6-well Transwell® inserts used (see Section 2.6). The aerosol flow and temperature over each position were set to 100 mL/min and 37 °C, respectively. This method was used in previous studies to calculate the deposited dose [28,29,30].The experimental analysis of DBP deposition on the ALI cell layer was performed according to the following procedure. Immediately after cell exposure, the Transwell® inserts were transferred to 6-well NunclonTM plates kept on an ice-cold metal cooling block. Quickly afterwards, ice-cold methanol (LC–MS-grade, Sigma-Aldrich, St. Louis, MO, USA) was added to the apical compartment of the inserts, followed by addition of the internal standard Phthalic acid 3,4,5,6-d4-dibutyl ester (DBP-d4, Sigma-Aldrich, St. Louis, MO, USA). Cells were scraped off and the whole cell suspension was collected, followed by a wash of the insert membrane with methanol, resulting in a final DBP-d4 concentration of 1 µg/mL. The samples were extracted in an ultrasonic bath for 3 min and centrifuged at 10,000× g for 5 min to get rid of remaining cell debris. The supernatant was directly transferred to HPLC vials (Agilent Technologies, Santa Clara, CA, USA) and stored at −80 °C until analysis via liquid chromatography tandem mass spectrometry (LC–MS/MS). The LC–MS/MS system comprises an Agilent 1290 UHPLC (Agilent Technologies, Santa Clara, CA, USA) including a degasser, a binary pump, an autosampler, and a column compartment, coupled to an Agilent 6470 MS/MS system equipped with an ESI Source. The amount of deposited DBP was measured for three independent experiments. A Kinetex C18 column (2.6 μm, 100 × 3 mm i.d., Phenomenex, Macclesfield, UK) was used for separation and the column compartment was set to 20 °C. A sample volume of 5 µL was injected at 20 °C. The measurement was performed in multiple reaction monitoring in positive ion mode using a gradient separation starting with 50% 0.1% acetic acid (mobile phase A) and 50% methanol (mobile phase B) with a constant flow of 300 µL/min going up to 100% methanol in 15 min. DBP m/z 279 → 149 and DBP-d4 m/z 283 → 153 transitions were used for quantification, and DBP m/z 279 → 205 and DBP-d4 m/z 283 → 209 transition ions served as qualifier ions. For quantification, an external calibration curve with DBP from 12 to 500 ng/mL was established.
2.7. Statistical AnalysisStatistical analysis was performed with GraphPad Prism 5. Statistical significances in the results were calculated by one-way analysis of variance, followed by Tukey’s multiple comparison post-hoc test. All comparisons were considered significantly different when p was <0.05. Data are shown as mean ± SD.
4. DiscussionOur current study aimed to develop an exposure system for evaluating the toxicity of the different aggregation states of semi-volatile organic compounds (SVOCs) using dibutyl phthalate (DBP) as a model compound. The newly designed exposure system had to fulfill certain requirements including installations not affecting humidity or the integrity of the ALI cell layer, stable and homogeneous temperature conditions to avoid condensation, and a stable airflow. The importance of a preconditioned aerosol air flow with an adequate temperature and RH for ALI cell exposures was shown previously [34]. From a toxicological point of view, neither the activated carbon denuder, nor the glass fiber filter installation affected the ALI cell layer. Additionally, the CA position, which incorporated both installations, showed no genotoxic impact compared to the gas phase, aerosol, and particle phase-exposed positions and exhibited a similar basal DNA damage as the iCA, indicating that both installations efficiently remove the gas and particle phase fractions during exposure and guarantee exposure to clean air.While the genotoxic effect of the distinct SVOC phases of DBP regarding induced single and double DNA strand breaks and alkali labile sites were comparable to each other, major differences between the different DBP fractions could be observed in terms of oxidative DNA damage. Aerosol exposure led to the highest increase in oxidative DNA damage and only the particle phase was inducing oxidative DNA lesions at a comparable level. Critically, the gas phase did not increase oxidative DNA damage compared to the (i-)CA, indicating that the genotoxicity induced by DBP in alveolar cells may mainly be attributed to the particle phase fraction. The oxidative DNA damage was found significantly increased in the aerosol after both time points and encountered an even higher increase after an additional 20 h of post-exposure, indicating a persistent oxidative stress induction by DBP. Though not significant, the same effect applied to particle phase exposure. It may hence be suggested that the gas and particle phases of DBP or any given SVOC may infer genotoxicity by distinct modes of action. This outcome in turn indicates that the physical state of SVOCs implies an additional crucial parameter in the prediction of hazard and exposure risk assessment, together with particle size-associated SVOC adsorption and total mass. The importance of considering gas phase SVOCs for risk assessment has been nourished by the high contribution of gas phase mass concentrations to total polycyclic hydrocarbon yield in the atmosphere [21].It has to be noted that the generated particles represent droplets in a rather big size range characteristic for workplaces [35]. Given the fact that the toxic effects of a compound may rather be exerted by UFPs than fine particles or gas phase [15], the overall picture of the observed particle-induced toxic effects may change profoundly upon shifting the exposure to smaller particle size fractions, which would ultimately result in a higher particle number concentration to accomplish an equal mass concentration. To be able to compare the respective concentrations of the gas and particle phases, the mass concentrations of both phases were approximated to be equal during the conducted experiments. Further studies should hence incorporate an aerosol generation unit that allows for UFP exposures and a subsequent elevated local dose due to the introduction of solid particles rather than liquid droplets, which may generate a liquid film on top of the ALI cell layer. In this context, it would be helpful to switch to a distinct condensation core for the SVOC compound, such as soot [28]. In addition, the use of solid particles would allow for the visualization of the time-resolved transmission electron microscopy deposition and cellular uptake analysis.With a geometric mean particle diameter of 2.0 ± 0.05 µm and a mean number concentration of 320 ± 8 #/cm3, the calculated particle deposition resulted in 680 ± 100 ng/cm2 over a period of 4 h exposure time. These model results are in excellent agreement with the LC-MS/MS measurements (530 ± 200 ng/cm2 for total aerosol and 480 ± 190 ng/cm2 for particles). However, the model cannot be used to calculate gas phase deposition. Particle phase exposure resulted in a minor decrease (~11%) in deposited DBP compared to the aerosol-exposed group. This reduction might correspond to the amount of gas phase. Since we implemented a relatively high stagnation flow rate of 100 ± 10 mL/min, the efficient delivery of the gas components with less variability can be assumed [18]. On the other hand, we were not able to quantify the deposited gas phase via LC-MS/MS, indicating that the deposited gas phase or its contribution to the total aerosol is rather small. According to the Henry’s law constant and the air/water partition coefficient of DBP reported in [36], we expect the gas phase of DBP to remain in the air rather than partitioning into the aqueous cell layer. In our initial estimation, the gas and particle phase mass concentrations were assumed to be equal. Indeed, we might have overestimated the gas phase mass concentration, since a saturation gas phase concentration of around 0.5 mg/m3 was previously measured at 35 °C [33], whereas in our calculations the saturation gas phase concentration amounted to around 1.8 mg/m3 at 37 °C. Besides, the gas phase may adsorb to the conductive tubing, resulting in a rather small gas phase fraction compared to the assumed calculated value. Additionally, gas phase exposure might result in an enhanced fraction of gas phase DBP reaching the cytosol, where the enzymatic conversion of esterases and unspecific lipases may readily result in the conversion of DBP to its monoester form monobutyl phthalate (MBP) [37]. Given the fact that the potency of MBP to induce DNA damage is decreased compared to the parental compound DBP [38], this might explain the absence of oxidative DNA damage induced by the gas phase. However, the small fraction of pure gas phase was still sufficient to inflict considerable DNA damage. This is coherent with our previous study, where even small amounts of DBP (0.02 to 20 ng/cm2) induced a significant increase in DNA strand lesions upon DBP exposure in A549 cells in the ALI CLOUD Vitrocell® system [22].While the modular set-up of the system follows the idea of current ALI systems [16], the simplicity of the newly developed system provides for several advantages. These include a straightforward aerosol flow preconditioning at homogeneous temperatures without the requirement of turbulent premixing in a heated reactor for humidification [39], which leads to reduced system-derived changes in aerosol physicochemical properties [16], the easy cleaning and maintenance of the new system, respective reuse with other emission sources by quick and simple tube exchange, as well as the easy implementation of the system in individual labs. It has to be mentioned that the first version of the new ALI system implements only one Vitrocell® exposure module, corresponding to one technical replicate per exposure. To confirm repeatability and reproducibility, additional exposure modules should be installed, which in turn requires the adequate adjustment of the tubing alignment and aerosol distribution unit to guarantee equal exposure conditions in the respective module positions.Our results indicate that the new exposure system can be used to investigate the distinguishing effects of the gas and particle phase toxicity of the compounds with higher volatility. For those compounds, gas phase exposure becomes more relevant in terms of inhalation toxicology. Hence, the gas phase concentration and vapor pressure of a given organic compound should be pre-experimentally validated to enable exposures to similar mass concentrations of gas and particle phase. For model evaluations, DBP reveals not be the optimal SVOC of choice due to its low volatility and resulting low gas phase contribution in the experiments. Nevertheless, the modular construction of the system allows for the selection of the distinct types of aerosol emission sources that represent more complex airborne material.
Additionally, 24 h exposures to clean air showed that it is feasible to perform exposures that consider the real exposure scenario, including the adequate time resolution. In combination with more advanced cell models, this application may significantly contribute to elucidating the pathophysiological mechanisms that initiate or promote disease-related processes occurring due to chronic exposure.
In addition, the online measurements of aerosol characteristics can be efficiently employed to estimate the deposited dose over longer exposure durations (4 h exposures), which is supported by the good agreement of the model calculations and the empirically measured particle deposition. Furthermore, the relatively high flow rates of 100 mL/min may result in an efficient deposition of gas phase pollutants on the ALI cell surface [18].Most of the studies that investigate airborne toxicity by employing ALI exposure systems focus on particle-induced effects and respective deposition efficiency [16]. Recently, ALI systems were developed that address the toxicity and deposition efficiency of gaseous pollutants, including volatile organic compounds (VOCs) or trace gases (i.e., ozone, carbon monoxide, nitric oxide, etc.) [18,19,20]. Our newly developed system complements the available systems by the possibility to study the effects of both the gas and particle phases, as well as the total aerosol of airborne pollutants including VOCs and SVOCs. The consideration of both the gas and particle phases of chemical pollutants for toxicological risk assessment is critically important. Otherwise, airborne exposure and the associated potential adverse health effects may be severely underestimated [14,21]. In the future, the current ALI system can be employed to attribute potential adverse health effects to the specific aerosol composition of gaseous- and particle-associated airborne pollutants and consider the toxicological effects that derive from both physical states.
留言 (0)