
記住我
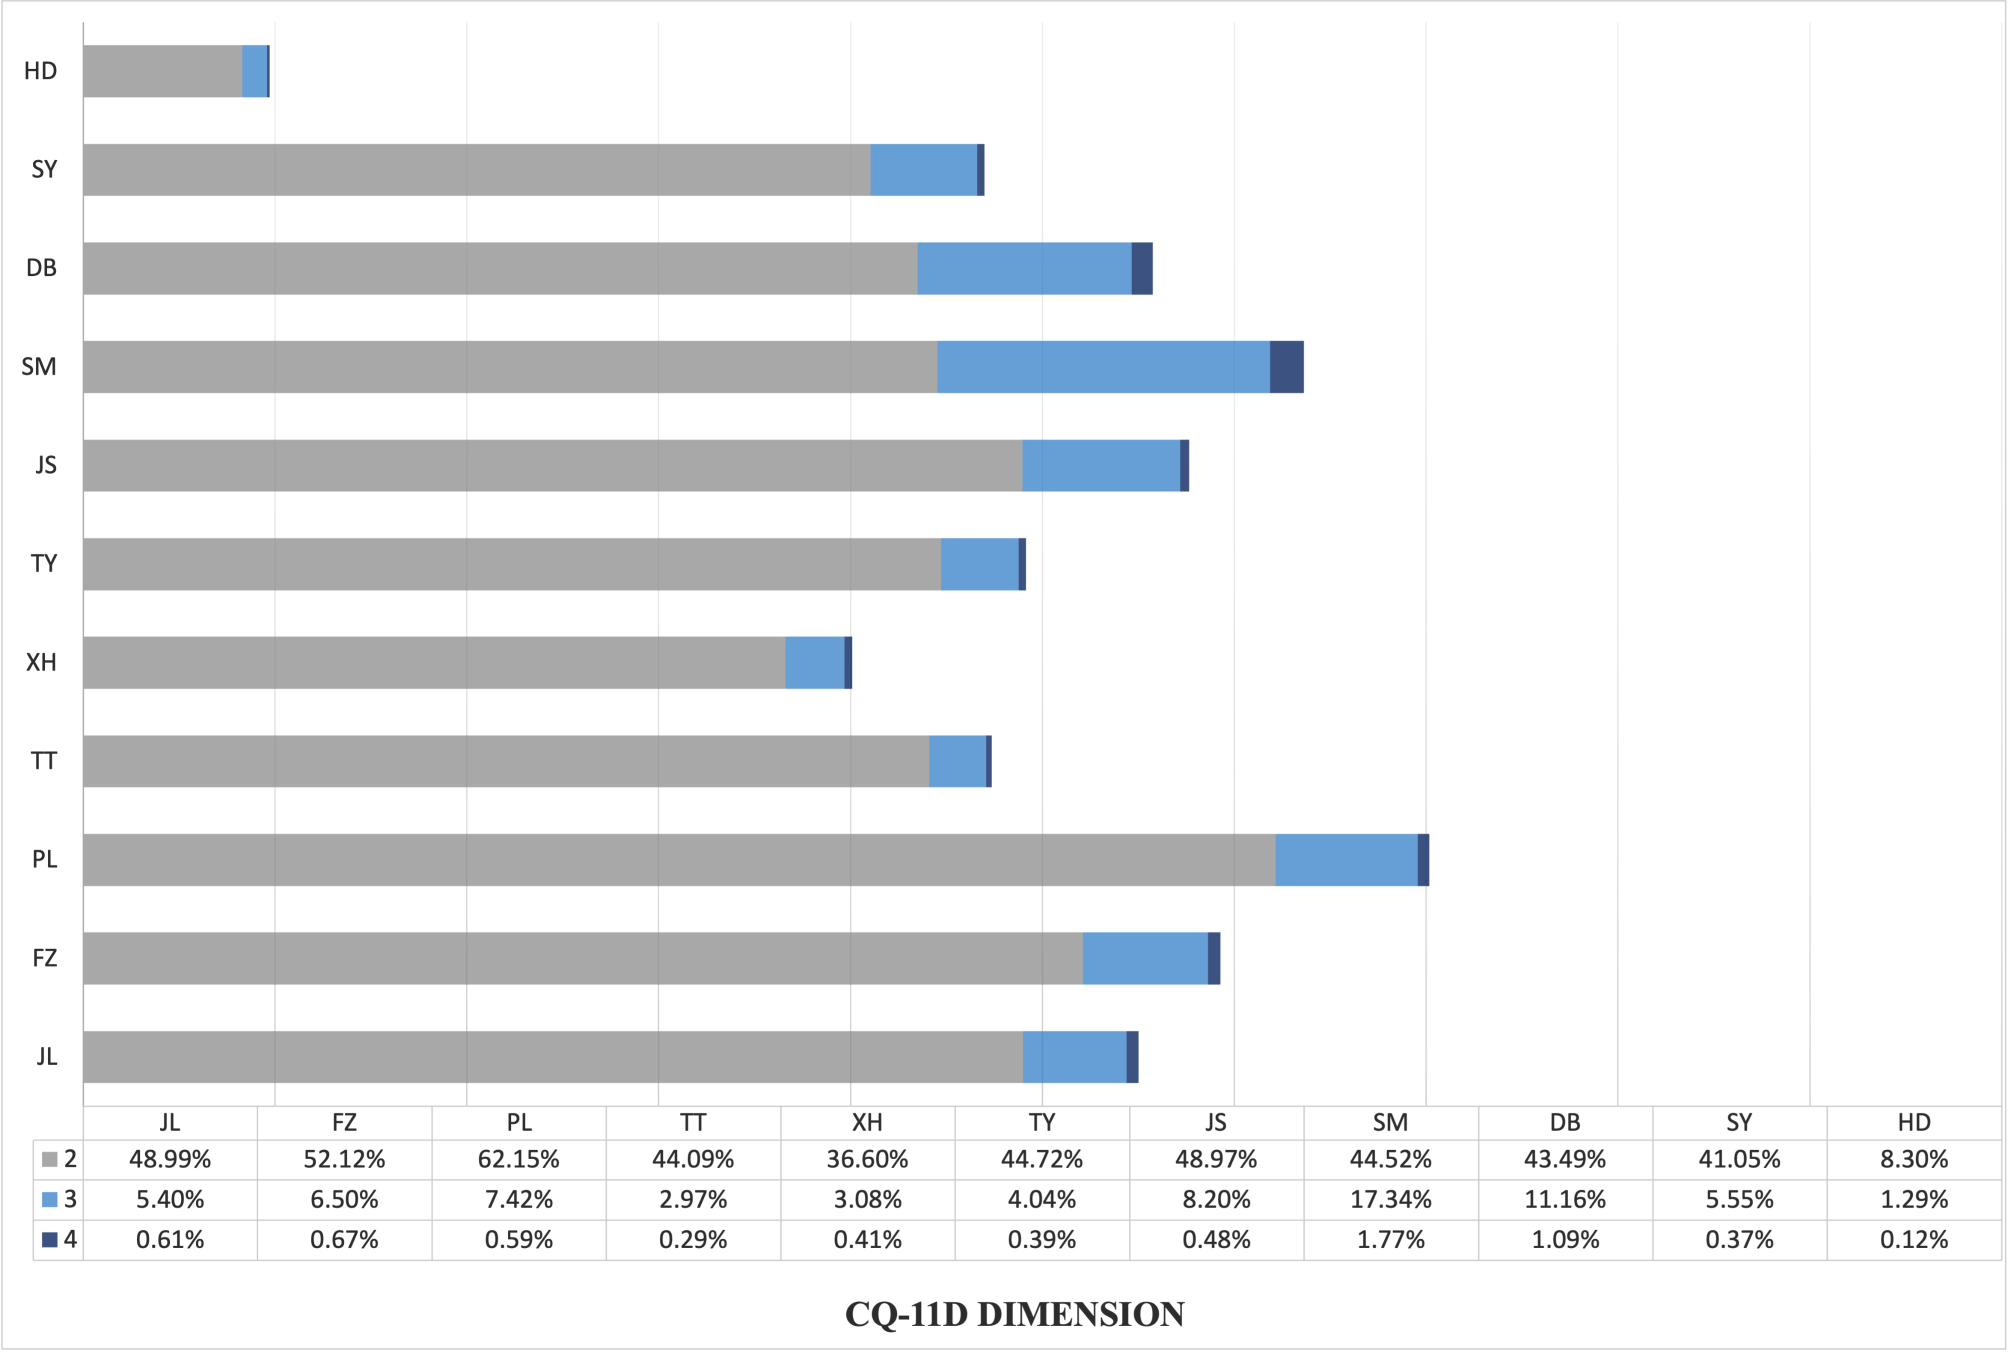
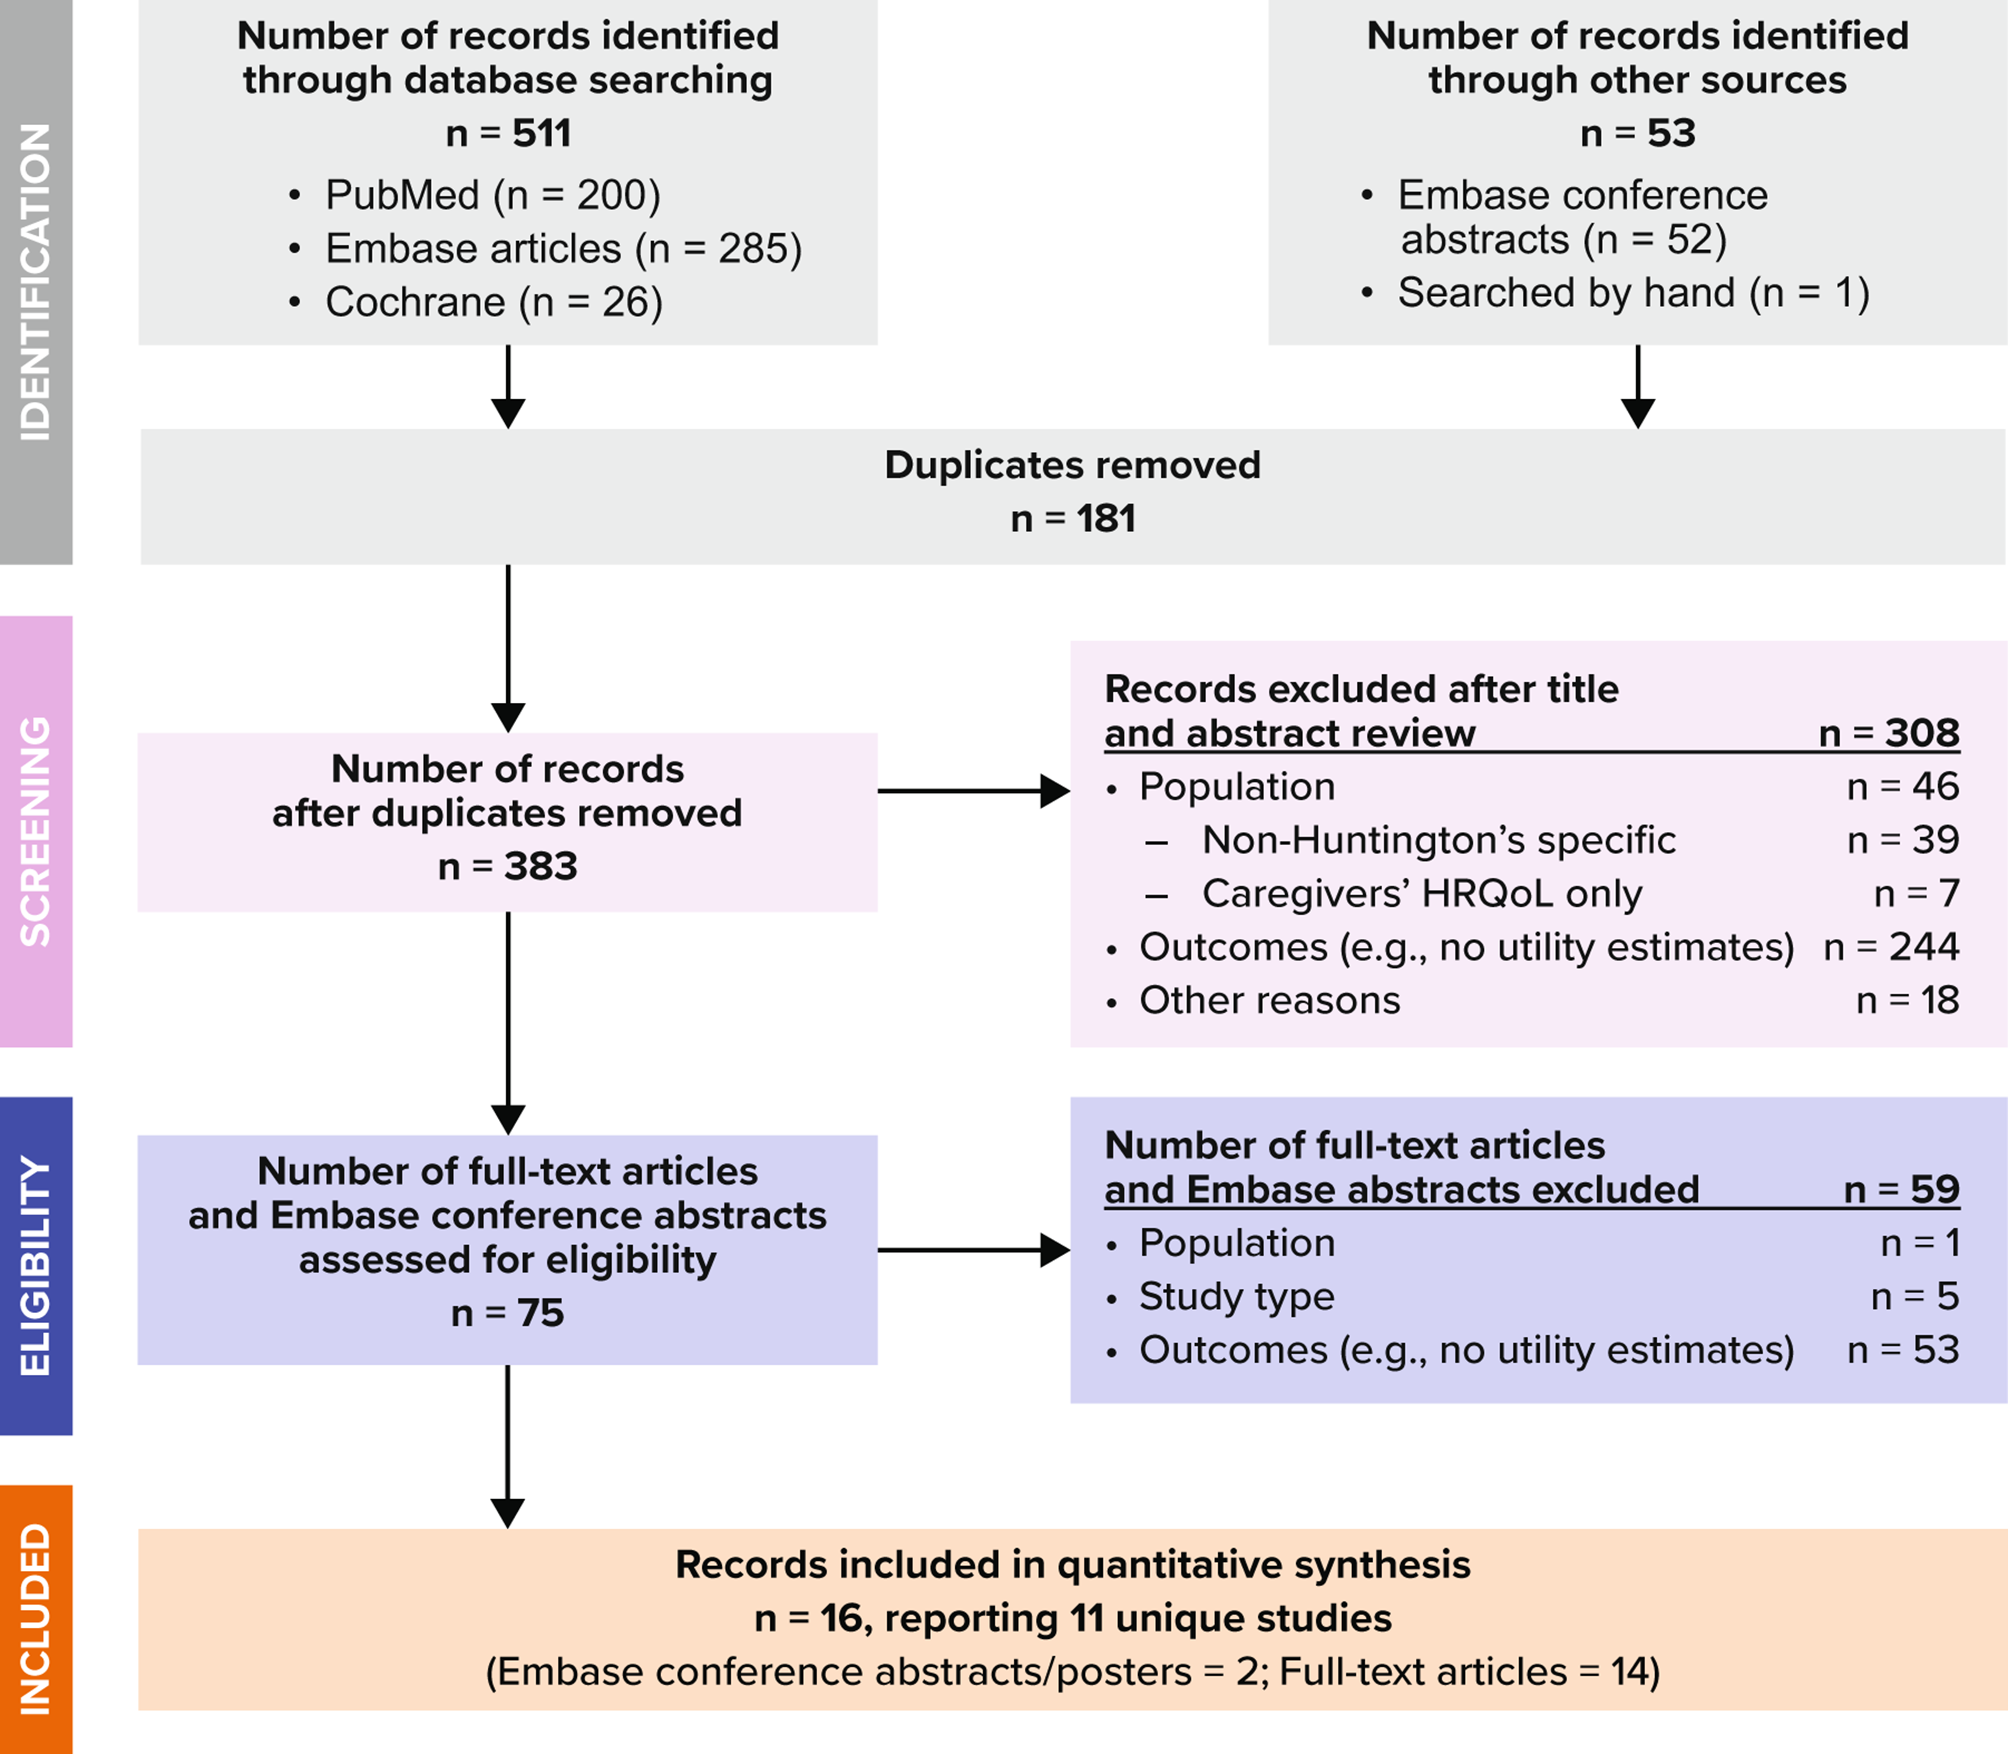
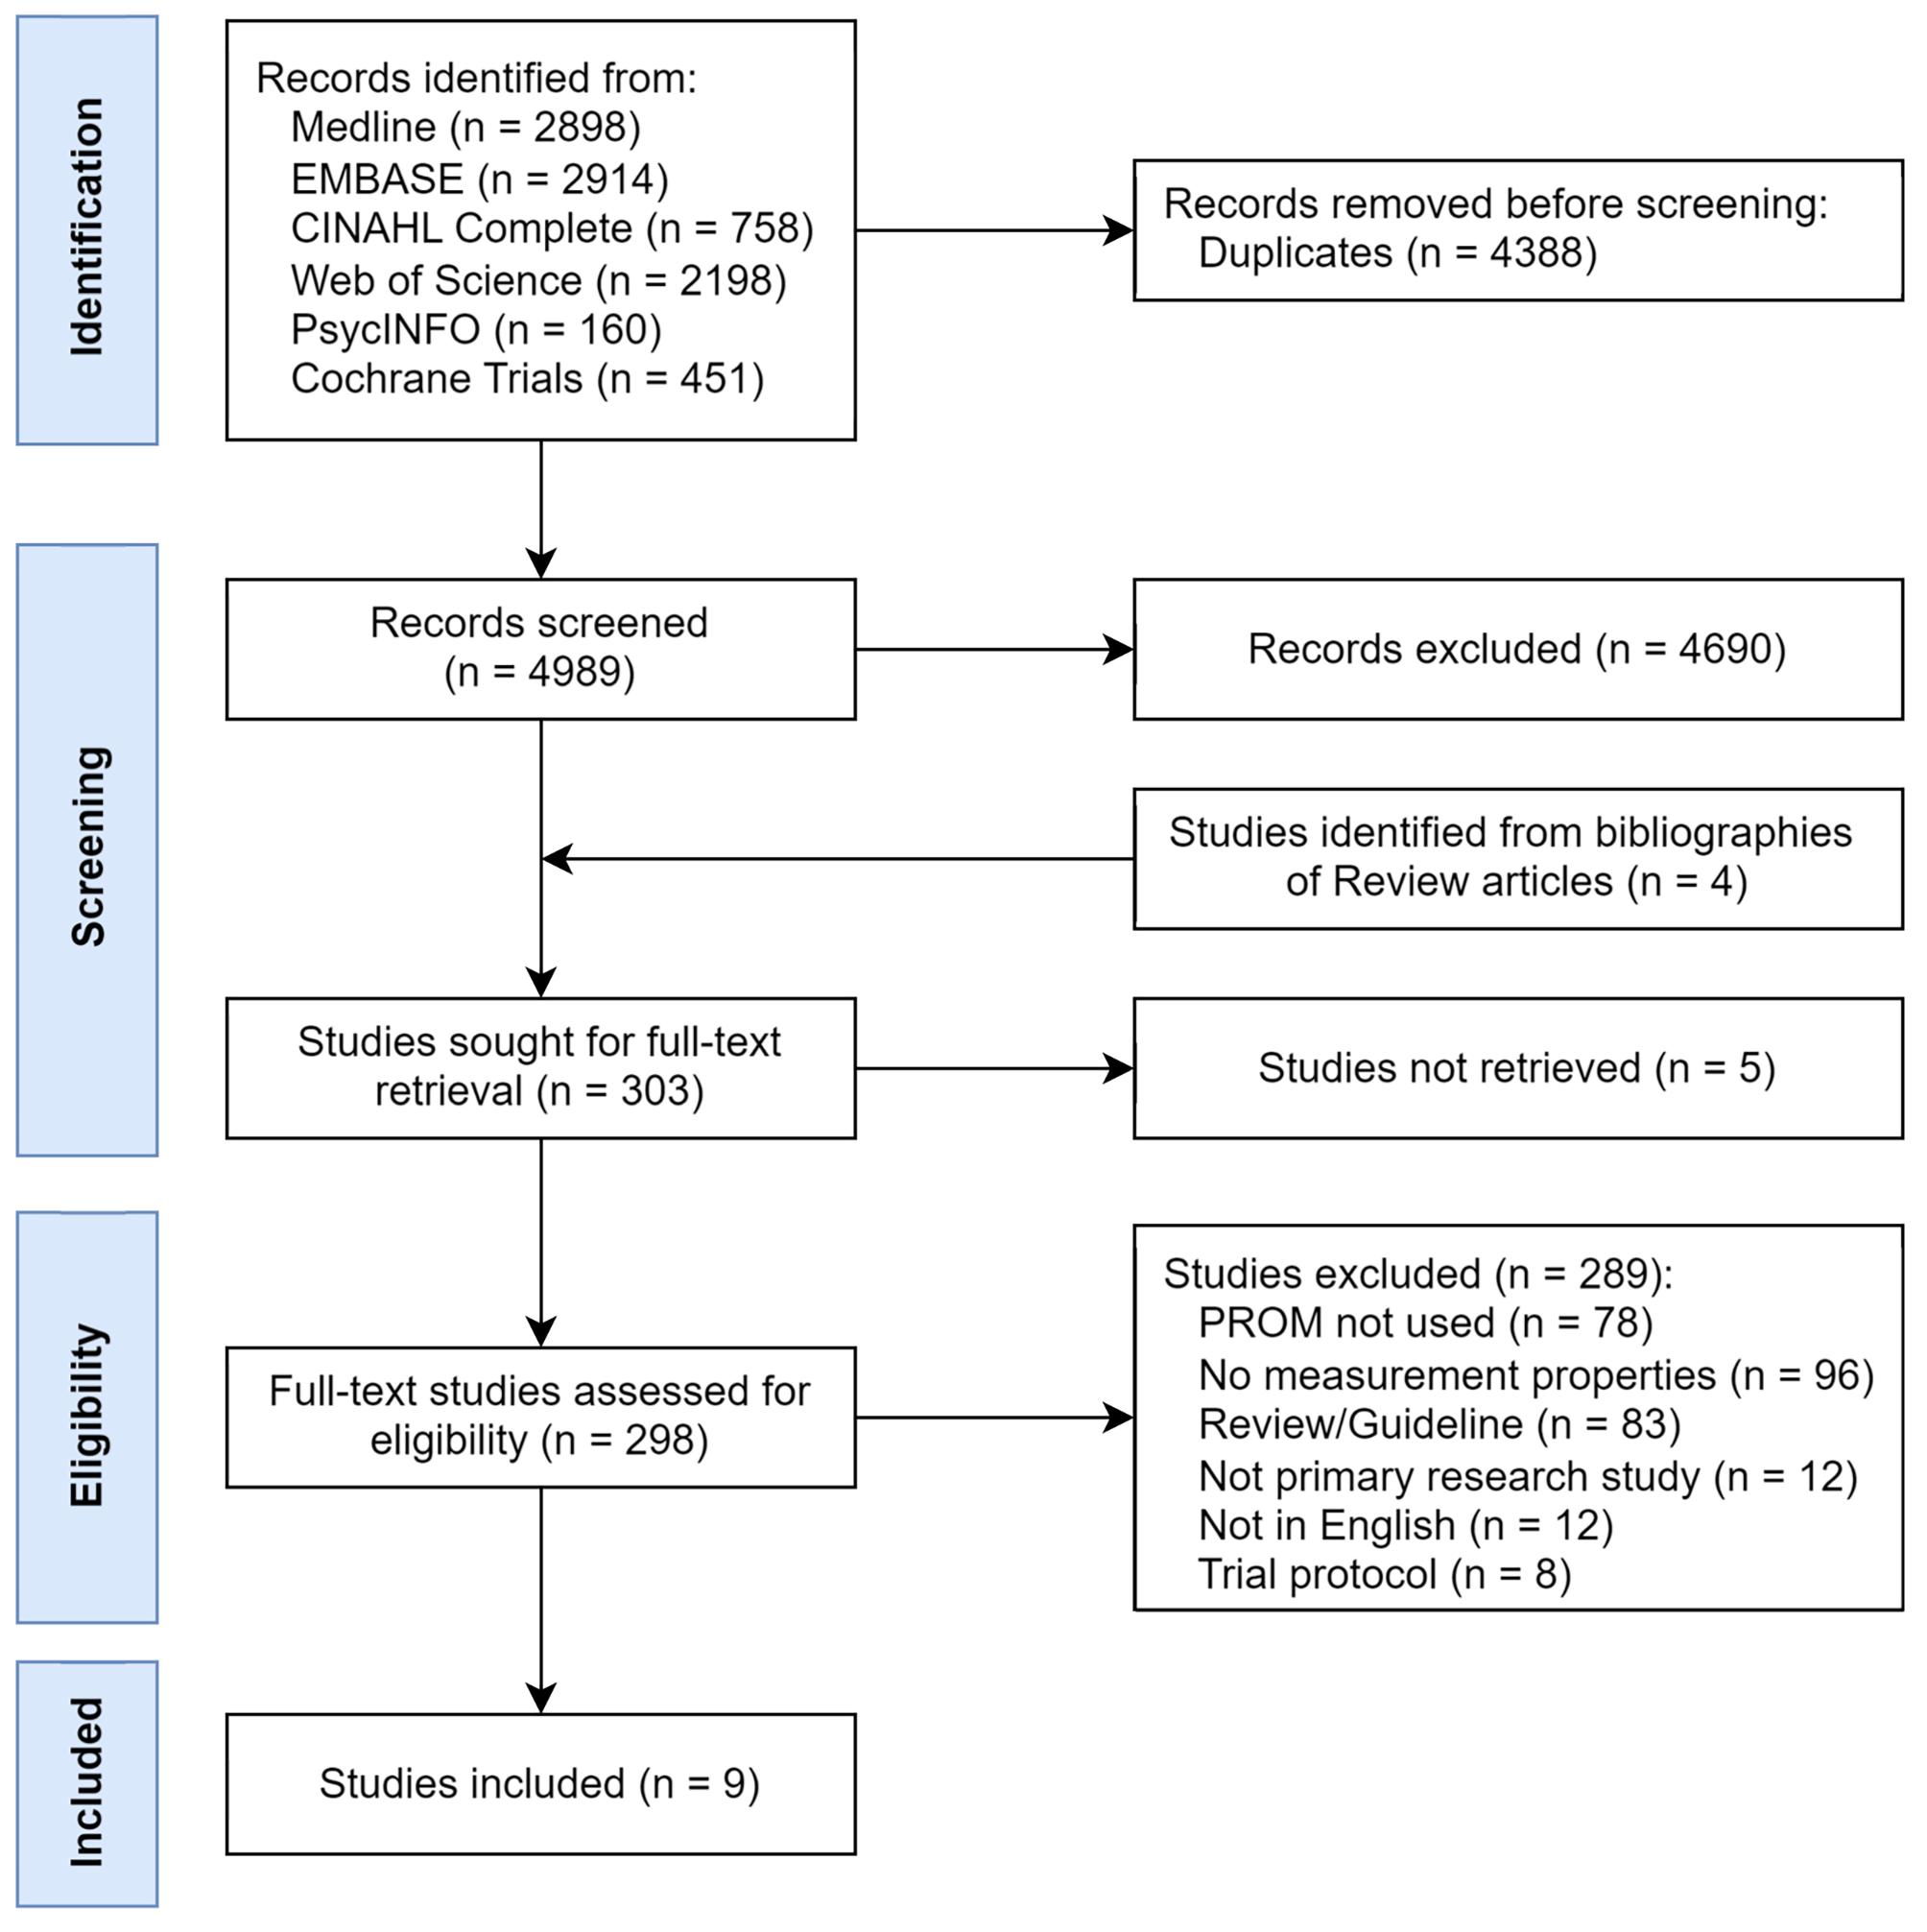
A total of 1664 references were identified from the database search, and an additional 14 references were obtained from manual searches. After removing the duplicates (n = 762), 902 references were retained. The full texts of 310 references were screened, and 43 studies met the inclusion criteria. Therefore, 57 studies were included in this systematic review [37,38,39,40,41,42,43,44,45,46,47,48,49,50,51,52,53,54,55,56,57,58,59,60,61,62,63,64,65,66,67,68,69,70,71,72,73,74,75,76,77,78,79,80,81,82,83,84,85,86,87,88,89,90,91,92,93]. the full selection process is presented in Fig. 1.
Fig. 1
PRISMA flow chart of study selection
Study characteristicsThe included studies were published between 1996 and 2021, with 70% of studies published after 2010 and 33% of studies published after 2016. The highest proportion (35%) of included studies were conducted in the USA (n = 20) [40, 41, 47–49, 51–53, 59, 60, 63, 74, 81, 83–86, 88, 91, 93] followed by 28% in Europe (n = 16; Belgium, Italy, Netherlands, Slovenia, Denmark, Germany, Turkey, Finland, Norway and Switzerland) [39, 42, 43, 45, 46, 50, 55, 61, 62, 64–66, 68, 71, 73, 77], 16% in Asia (n = 9; Iran and India) [55, 57, 58, 69, 70, 72, 75, 82, 92] and 9% in both Australia (n = 5) [55, 56, 78–80] and UK (n = 5) [38, 67, 76, 89, 90]. In total, 70% (n = 40) of included studies were of experimental study designs of which 85% (n = 34) were RCT's [38, 43–46, 50, 51, 53–56, 59, 60–63, 66–76, 83, 84, 86, 88–91]. The remaining 30% of studies were of an observational study design including case–control (n = 8) [40, 41, 52, 65, 71, 81, 92, 93], cohort (n = 7) [37,
留言 (0)