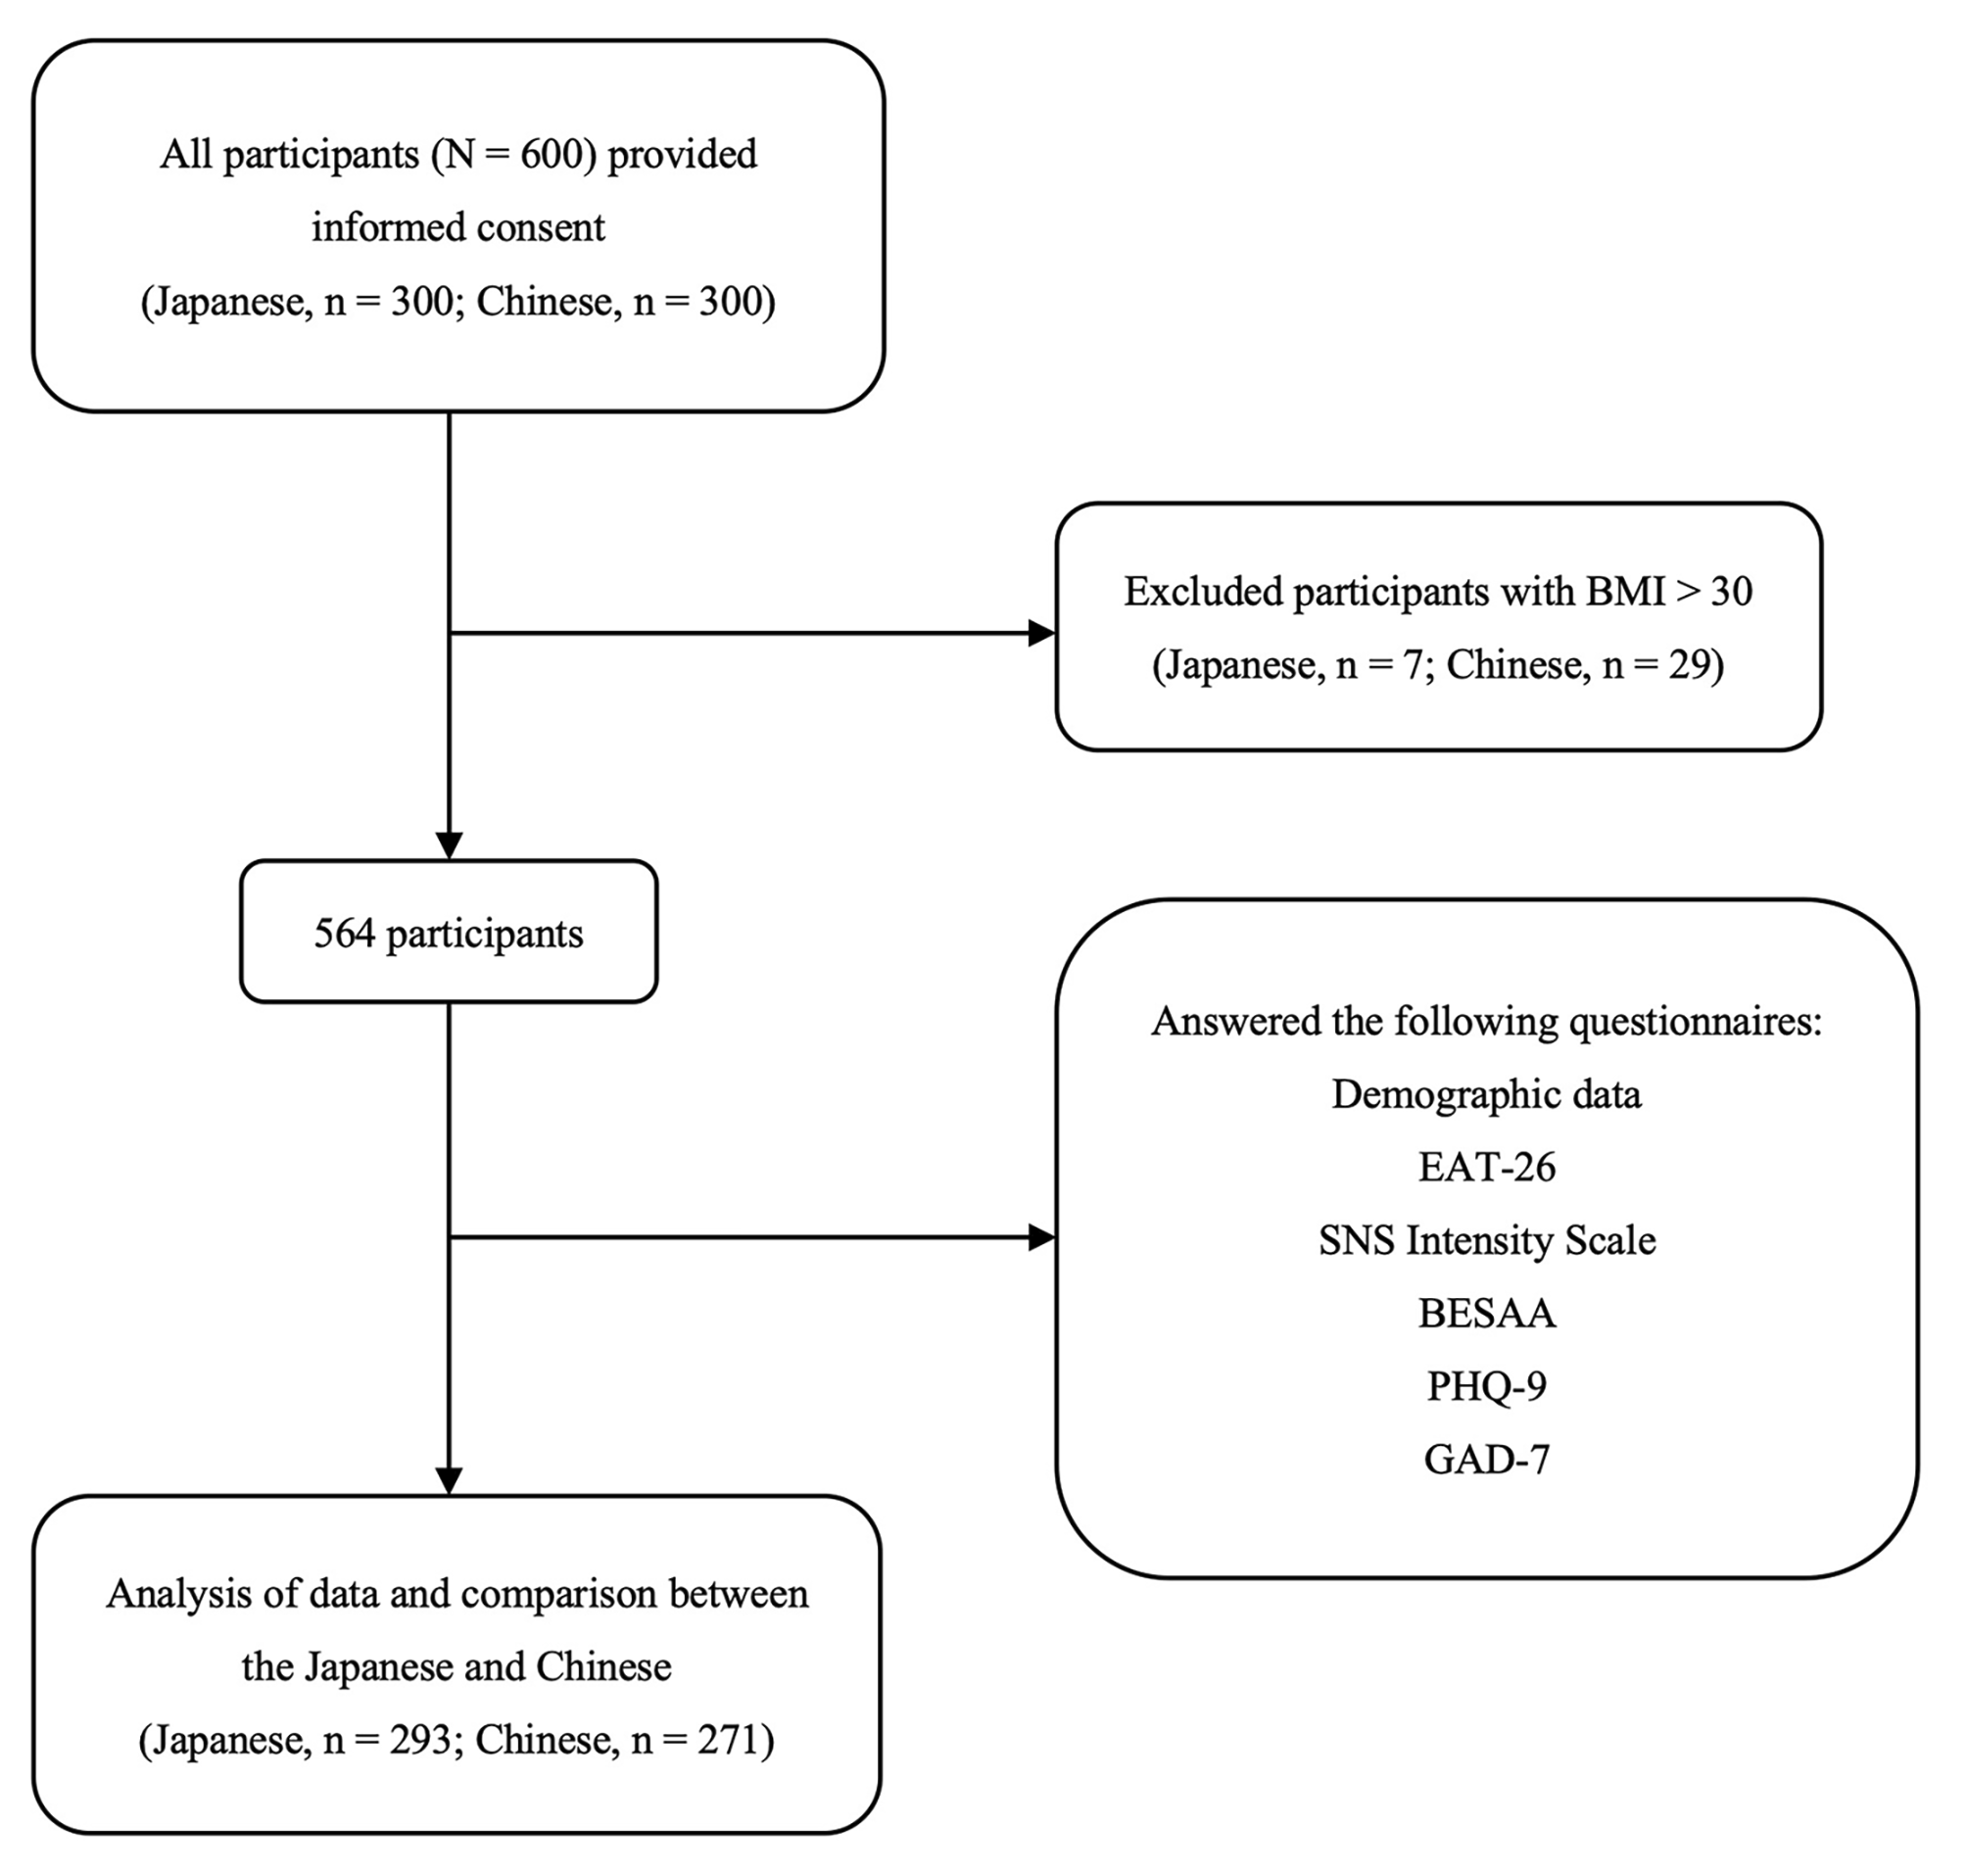
Participants
Table 1 provides demographic characteristics of the sample. We recruited participants with ARFID (n = 42, ages 14–40 years) from two NIMH-funded studies (R01MH108595, investigating the neurobiology of ARFID; and R01MH103402, examining low-weight eating disorders), as well as consecutive referrals to the Eating Disorders Clinical and Research Program at the Massachusetts General Hospital. Neurobiology study participants were diagnosed with ARFID via the PARDI [8], and clinic patients were diagnosed with ARFID via routine clinical interview by their treating psychologist or psychiatrist according to DSM-5 criteria [16]. Because the purpose of the current study was to evaluate the performance of the PARDI-AR-Q in identifying full-threshold cases of ARFID, only individuals diagnosed with full-threshold ARFID via clinical interview were included; we excluded subthreshold cases. Furthermore, given that the PARDI-AR-Q is meant for ages 14 and up, we excluded participants below the age of 14 from both recruitment sources. We excluded individuals over the age of 40 as there were none in the neurobiology study and very few in the clinic sample.
Table 1 Demographic characteristics of the avoidant/restrictive food intake disorder (ARFID) group and healthy control participants (HC)We recruited HC (n = 29, ages 14–40 years, to match the age range of the ARFID group) who had either served as healthy controls from the neurobiology study (n = 1), learned about the study from Rally (a Mass General Brigham-wide recruitment platform; n = 4), or participated via Amazon Mechanical Turk (MTurk, an online recruitment platform for survey research; n = 24). Healthy controls from the neurobiology study did not meet criteria for any current psychiatric disorder on the Kiddie Schedule for Affective Disorders and Schizophrenia (KSADS) [17]. Adults and children from MTurk and Rally were classified as HC through a self-report battery; they had to score below clinical cut points including < 2.3 on the Eating Disorder Examination-Questionnaire [2], < 44 on the State–Trait Anxiety Inventory trait scale [18], < 16 on the Center for Epidemiological Studies Depression Scale [19], and < 10, 9, and 10, respectively, on the Picky Eating, Appetite, and Fear subscales of the Nine-Item ARFID Scale [10, 11]. To ensure data quality for individuals recruited through MTurk, we set our survey such that individuals could not participate twice. Additionally, and in line with recommendations for analyzing MTurk data [20], we ensured there were no duplicate entries by collecting MTurk worker IDs. Participant compensation varied by recruitment source. Clinic participants received no compensation as they completed the necessary measures as part of routine care. Participants drawn from one of our team’s neurobiology of ARFID study received up to $550 (because the broader study included several multi-hour visits over a period of two years, including not just questionnaires but also fMRI scans, test meals, and blood draws). MTurk participants received $1 for completing a pre-screener and $15 for completing a battery of questionnaires.
MeasuresDemographics
All participants reported their age, sex, race, and ethnicity on a standard self-report form or via clinical interview.
Pica, ARFID and rumination disorder interview ARFID questionnaire (PARDI-AR-Q)
All participants completed the PARDI-AR-Q, which asks individuals to report on their own symptoms. (A parent version in which parents report on their child’s symptoms is also under study but was not investigated in the current study). The full 32-item questionnaire and scoring algorithm appear in Additional file 2 as well as online at mccaed.slam.nhs.uk and are freely available for use.
The PARDI-AR-Q begins with five general demographic and anthropomorphic questions. The anthropomorphic items are included so that the assessor can calculate body mass index for adults or body mass index percentile for youth (when combined with demographic data), if desired. Next, 12 dichotomous (yes/no) items assess the presence of DSM-5 diagnostic criteria for ARFID, including the presence of an eating problem (two items), low weight or faltering growth (five items), nutrition deficiency (one item), supplement dependence (three items), and psychosocial impairment (one item). Given that several diagnostic criteria for ARFID are polythetic, the PARDI-AR-Q includes multiple items per criterion for comprehensiveness. For example, criterion A1 can be met by endorsing items 8, 9, 11, 12, and/or 13. Of note, four of the dichotomous diagnostic items include free-text follow-up questions (e.g., amount of weight lost, type of supplements used) to provide additional context for the assessor to confirm why and how specific diagnostic criteria are being fulfilled. Based on the pattern of response on these yes/no items, respondents can score positive or negative for possible ARFID based on the PARDI-AR-Q diagnostic algorithm (see Additional file 3 for scoring). “Yes” ratings should be followed up with a clinical interview to confirm diagnosis. Finally, the PARDI-AR-Q presents 11 Likert-scale items (scored 0 to 6, with higher scores indicating greater severity) designed to assess the presence and severity of each ARFID profile (i.e., avoidance based on sensory characteristics of food, lack of interest, concern about aversive consequences) as well as severity of impact.
Pica, ARFID and rumination disorder interview (PARDI)
A subset of participants with ARFID only (n = 27, 93%) also completed the PARDI [8], a structured interview designed to confirm the presence of an ARFID diagnosis as well as to provide a detailed assessment of the severity of each ARFID profile (i.e., avoidance based on sensory characteristics of food, lack of interest, or concern about aversive consequences) and the severity of overall impact. Like the PARDI-AR-Q, some questions on the PARDI were yes/no questions with follow-up questions asking the interviewee to elaborate on their response, while others were rated on a Likert scale of 0 to 6, where 6 represented the highest level of symptom severity for that question.
We scored the PARDI according to updated guidelines from a recent psychometric paper [21]. In the current study, we used the PARDI to (1) confer ARFID diagnoses among participants from the neurobiology study; and (2) evaluate concurrent validity of the three PARDI-AR-Q subscales and the severity score by assessing their degree of correlation with comparable subscales on the PARDI interview. Inter-rater reliability of the ARFID diagnosis in randomly selected subsets of the neurobiology sample have been reported previously (100% agreement; kappa = 1.0 [22, 23]). Cronbach alphas for each of the three subscales in the current sample were 0.81 (avoidance based on the sensory characteristics of food), 0.88 (lack of interest in food or eating), 0.88 (concern about aversive consequences).
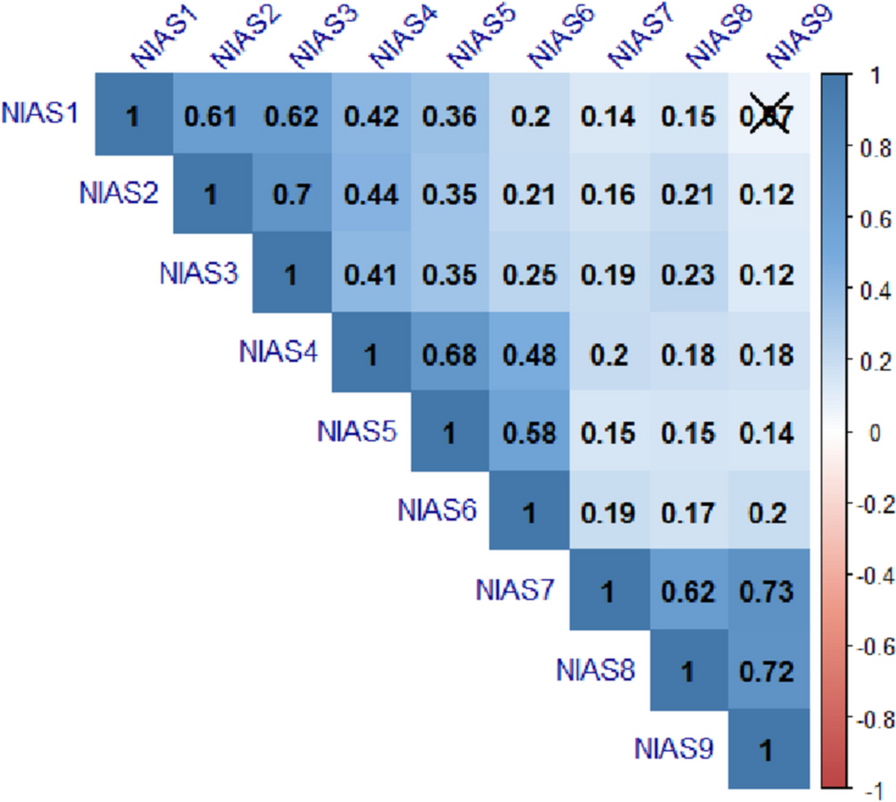
Nine-item ARFID screen (NIAS)
A subset of participants (15 [36% of] ARFID and 26 [90% of] HC) completed the NIAS [10], a 9-item self-report questionnaire designed to measure each of the three ARFID phenotypes described in DSM-5 including “picky eating” (3 items), “low appetite” (3 items), and "fear" (3 items). All items in the NIAS are rated on a 5-point Likert scale from 0 (“Strongly disagree”) to 5 (“Strongly agree”). The NIAS was originally validated for use in adults ages 18 and up but has also been used in adolescents [11]. In the current study we used the NIAS to evaluate the convergent validity of PARDI-AR-Q subscales. Cronbach alphas in our sample were: for the whole sample: 0.89 for picky eating, 0.91 for low appetite, and 0.92 for fear; for the ARFID sample: 0.31 for picky eating, 0.83 for low appetite, and.88 for fear; and for HC: 0.65 for picky eating, 0.71 for low appetite, and 0.82 for fear.
Food neophobia scale (FNS)
A subset of participants (28 [66% of] ARFID and 26 [90% of] HC) completed the FNS [24], a self-report measure of reluctance to try novel foods. All items in the FNS are rated on a 7-point Likert scale from “Disagree extremely” to “Agree extremely”, where “Agree extremely” represented the greatest severity in some items and the least severity in other, reverse-scored items. The FNS was originally validated for use in adults ages 18 and up but has also been used in adolescents [22]. In the current study, we used the FNS to evaluate convergent validity with the PARDI-AR-Q avoidance based on sensory characteristics subscale. Cronbach alphas in our sample were: 0.97 for the whole sample, 0.84 for the ARFID sample, and 0.94 for HC.
Clinical impairment assessment (CIA)
All participants with ARFID and 26 (90% of) HC completed the CIA [25], a self-report measure of the functional impairment associated with eating disorders. All CIA items are rated on a 4-point Likert scale from “Not at all” to “A lot”, where “A lot” represented the greatest severity. Although the CIA has not yet been validated for use with ARFID specifically, we evaluated the degree to which it was correlated with the PARDI-AR-Q severity of impact score, as a proxy measure of convergent validity. Cronbach alphas in our sample were: 0.96 for the whole sample, 0.95 for the ARFID sample, and 0.84 for HC.
Eating disorder examination-questionnaire (EDE-Q)
All participants in both the ARFID and HC groups completed the EDE-Q [2], which measures the specific psychopathology of eating disorders—particularly anorexia nervosa, bulimia nervosa, and binge-eating disorder—including frequency of key symptoms as well as dietary restraint, eating concern, weight concern, and shape concerns. All items in the EDE-Q are rated on a 7-point Likert scale from 0 (“No days” or “Not at all”) to 6 (“Every day” or “Markedly”), where 6 represented the greatest severity. In the current study, we used a cut-off score of 2.3 on the EDE-Q [26] to rule out other eating disorders (apart from ARFID) in both the ARFID and HC groups. Cronbach alphas in our sample were: 0.85 for the whole sample, 0.93 for the ARFID sample, and 0.71 for HC.
Data analysis
We conducted all analyses in R [27]. First, to test our hypothesis that we would identify three PARDI-AR-Q factors reflecting avoidance based on sensory characteristics of food, lack of interest, and concern about aversive consequences, we conducted an exploratory factor analysis (EFA) of the continuously scored items that were intended to be comparable to the three subscales in the PARDI (i.e., items 24–32). Our rationale for subjecting just the nine ARFID presentation items to the primary EFA was two-fold. First, severity of impact varies across ARFID presentations. Thus, we expected the severity of impact items to correlate with all other items on the PARDI-AR-Q. Second, our team’s recently published factor analysis of the PARDI interview (Cooper-Vince et al., 2022) also analyzed only ARFID presentation items together in a single EFA; thus we took a similar analytic approach here to enhance the comparability of psychometric properties for the interview and self-report measures. (However, Additional file 1: Table S1 provides the results of an EFA that includes the severity of impact items as well.) Given that ARFID presentations often overlap clinically [28, 29], we used a promax rotation that allowed factors to inter-correlate. Given our expectation that the HC would show very low variance on these items, we included only the ARFID group in this analysis. We had no missing PARDI-AR-Q data at the participant or item level. Although the sample size for EFA was modest, the Kaiser–Meyer–Olkin measure of sampling adequacy was > 0.80 (i.e., 0.82 in our sample), and the Bartlett’s test of sphericity was significant (X2 [36] = 250.33, p < 0.001), suggesting that EFA was appropriate. To evaluate the internal consistency of each subscale, we calculated Cronbach alphas for each of the ARFID-only group, the HC-only group, and the full sample.
Second, to evaluate convergent validity, we evaluated the strength of correlations between PARDI-AR-Q subscales and related constructs, including the corresponding NIAS subscales, the FNS, and the CIA. To evaluate divergent validity, we evaluated the strength of correlation with EDE-Q, which should not be conceptually related to PARDI-AR-Q scores as weight and shape concerns are not central to the ARFID diagnosis. To evaluate concurrent validity, in the subset of individuals with ARFID for whom PARDI interview data were also available, we evaluated the strength of intraclass correlation coefficients between subscale scores on the PARDI-AR-Q and their analogous scores on the PARDI interview.
Third, to test our hypothesis that individuals with ARFID would score significantly higher than HC on all PARDI-AR-Q subscales, we conducted a Mann–Whitney-Wilcoxon test (given the non-normal distribution of subscale scores). We also calculated Wilcoxon r values to determine effect size [30]. Wilcoxon r effect sizes range from 0 to 1, with r < 0.3 indicating a small effect, 0.3–0.5 indicating a moderate effect, and > 0.5 indicating a large effect.
Lastly, we evaluated the percentage of participants with ARFID as well as HC who scored positive versus negative on the PARDI-AR-Q diagnostic algorithm. We then qualitatively reviewed responses of ARFID participants who scored negatively as well as HC who scored positively to evaluate the reasons for any discrepancies.

留言 (0)