
記住我

The tested device was a Tesla Invader III with a KangerTech SubTank Mini atomizer with operational power of 15–30 W, single bottom coils with a 1.26 Ω and 50:50 PG/VG e-liquids, tested at 11, 13, 17 and 24 W. Sessions of 20 puffs with two protocols: CORESTA (3 s puff duration, 30 s puff interval, 55 mL puff volume) and two Custom Square Mode (3 s puff duration, 30 s puff interval, 21 and 198 mL puff volume), flow rates of 18.3, 7.0 and 36 mL/s, respectively. Analytic determination by quantitative NMR (qNMR).
While testing at 11–17 W showed toxicants with concentrations below LOQ and LOD, the authors argue that the main hazard to end users is the excessive exposure to the solvents, particularly PG. The tested device at 24 W and 18.3 ml/s emits 18.5 mg/puff of PG/VG, assuming a 50:50 PG/VG partition as in the e-liquid and 25 puffs/h leads to 115.6 mg/h of inhaled PG. The authors compare this value with 75 mg/h inhaled PG, the dose from the 1 h inhalation threshold of the Spacecraft Maximum Acceptable Concentration of the NASA, concluding that PG inhalation poses a serious harm to users. This risk assessment is highly questionable, as the cited SMAC document warns that its threshold values are only applicable to a spacecraft environment (an extremely enclosed and isolated environment that bears no relation with real life vaping scenarios). Using a more reliable source looking at respiratory effects of PG aerosol inhalation in healthy human subjects [94], mild exposure related symptoms only occur at 871 mg/m3 which (for 20 m3 daily air breathing by adults) implies an inhalation of 725 mg/h of PG, 7 times above the inhaled PG from the tested device.El Hellani et al. This study [15] assesses nicotine and carbonyl yields in popular low-powered devices in the U.S. market as of 2017: they tested 27 devices, disposables, pr-filled cartridges and tank models of 10 brands. E-liquids were in three flavors: tobacco and menthol a third different one, with 7.11–20.90 mg/mL nicotine concentration and a wide variation of VG/PG ratios and power ranges around a 5 W average. Sessions of 15 puffs were conducted, with puffing parameters selected to “represent an experienced user”: 4 s puff duration and 10 s inter-puff duration with a puff velocity of 1.5 L/min. However, this excessively high puffing frequency is unrepresentative of EC users (though it may be representative of smoking breaks of cigarette smokers). It also increases the possibility of high carbonyl yields and even dry puffs [11,16].In total 12 carbonyls in the gas phase were targeted for HPLC analysis, including formaldehyde, acetaldehyde, acetone, acrolein. However, the way the authors report and compare carbonyl yields and concentrations is misleading. They report a range 3.72–48.85 μg/15 puffs of carbonyl yields (also in the abstract), without mentioning that (from their Table 2 and Figure 2), the high end value of this range corresponds to only two unrepresentative outlier values (in 27 measurements) with 24 quantifications below 11 μg/15 puffs. As the authors recognize, such outliers are necessarily produced by dry puffs, and thus denote abnormal usage. They report formaldehyde concentrations of 0.58–5.05 mg/m3, again without mention that the high end of this range corresponds to the same 2 unrepresentative outliers. These concentrations are lower than those in tobacco smoke (4.6–148.9 mg/m3), but above measured human breath (<0.5 mg/m3) and the short term 15 min exposure limit (REL of NIOSH) 0.123 mg/m3. However, comparison with formaldehyde in human breath is irrelevant to assess exposures from ECs and the right occupational marker to compare EC emissions is not the 15 min SREL-NIOSH, but the PEL-NIOSH 0.92 mg/m3 (or 0.75 ppm) for time averaged 8 h lifetime exposure, which is above the representative quantified formaldehyde concentrations around 0.6 mg/m3.
6.2. Studies Published in 2019Beauval et al. The authors [16] show that, together with multiple other factors (power, temperature, device architecture, e-liquid composition, flavorings), the choice of puffing parameters (specially puff duration and interpuff frequency) significantly influences aerosol yields and outcomes of aldehydes, a fact that complicates an objective comparison between studies and interpretation of their results. They also provide a summary of reported concentrations (in ng/puff) of formaldehyde, acetaldehyde, acetone, acrolein, propionaldehyde and methyl-glyoxal, reported in 20 studies published between 2013 and 2017 (all of which were reviewed by Farsalinos and Gillman).Aerosol was generated from a single e-liquid (PG:VG 65/35, mint flavour; 16 mg/mL nicotine) by operating two devices from the French manufacturer NHOSS: a second generation “Lounge” model, 2.8 Ω nichrome top-coil, 4.6 W and a third generation “Mod box TC” model with Air Tank claromiser, 0.5 Ω kanthal bottom-coil and power supply 7–50 W, tested at ranges recommended by the manufacturer 18–30 W. They used DNPH cartridges for carbonyl collection and HPLC-UV for analysis. Aerosol temperature at the mouthpiece was measured by a NTC 3950 thermistor in separate tests under same conditions. Overheating and dry puff were controlled by monitoring also e-liquid consumption and replacing atomizers after each 20 puff session. Environmental contamination controlled by blank collections before each experiment.
Seven puffing regimes were defined for the tests, the standard CORESTA regime (puff volume: 55 mL, puff duration 3 s, puff frequency: a puff every 30 s) by the following modified parameters: puff volumes 35 and 100 mL (PV− and PV+, airflow 0.21 and 0.6 L/min), puff duration: 2 and 6 s (PD− and PD+) and puff frequency: 1 puff every 60 and 14 s (PF+ and PF−). The alteration of EC components after 480 puffs was also considered (the initial and final CORESTA, IC AND FC).
For the Lounge and TC 18 W consumed e-liquid was 5–10 mg/puff, with largest values produced by longer puff PD+, while the TC 30 W consumed 15–25 mg/puff with largest values produced by larger puff volume PV+. Regarding carbonyl outcomes, if we remove unrealistic PD+ and TC 30 W (a sub-ohm device tested with a low airflow) then concentrations are negligible (well below 1 μg/puff). Concentrations ranges (ng/puff): 20–255 (formaldehyde), 29–364 (acetaldehyde), 4.4–28 (Acetone), ND-40 (acroleine), 1.0–32 (propionaldehyde) and 4.5–141 (methyl-glyoxal).
The measured temperatures at the mouthpiece show smooth logarithmic-like curves that increase during the fist 5 puffs and reach a sort of plateau. These temperature measurements were not validated and are not reliable, since aerosol temperature time variation must be sensitive to the puffing sequence, producing saw teeth profiles. Nevertheless, it is interesting to qualitatively compare the temperature curves between the different graphs, as all were obtained with the same instrument and method. This comparison shows higher plateau temperatures for longer and more frequent puffs (PD+ and PF+) for both tested devices and all power settings. Also, the largest plateau temperatures occurs for the TC 30 W, which provides qualitative support to the inadequacy of testing a sub-ohm tank model at its higher power level with a low flow rate of at most 0.6 L/min.
Ooi et al. The authors [17] first sample emissions with a device made of an Innokin Iclear 30 S (Shenzhen, China) atomizer with a Kanthal coil and an Istick 30 W battery with a variable voltage of 2.0–8.0 V (no information is provided on power levels and coil resistance). E-liquids with various VG/PG ratios were used for GC-MS analysis, with the E-cig was operated at 4.80 V and vaped at 3 s per puff for a total of 12 puffs, with 30 s interpuff lapse and airflow 2.0 L/min (they refer their puffing parameters to their reference [14] published in 2014, which did not not use this airflow). The authors only report increasing presence (through GC-MS spectra) of carbonyls in aerosol emissions from e-liquids with a higher VG/PG ratio, but do not quantify the analytes, reporting only carbonyl outcomes from old studies published between 2010 and 2014.After describing the limitations of the GC-MS analytic technique (analyte condensation inside sampling bags absorption into the aerosol phase prior to sample analysis), the authors sample and analyze the vapor phase by Fourier Transform Infrared Spectrometry (FTIR) in the emissions of a sub-ohm device Joyetech eVic-VT E-cig device with variable temperature control (ranges 200–600 F), at two temperatures: 500 F (260 °C) and 600 F (316 °C). No information is supplied on the puffing protocol. Emissions were generated for immediate analysis by FTIR, and thus (according to the authors) the obtained concentrations were much higher than the nondisclosed ones obtained with GC-MS and the other device: 1236±361 mg/m3 at 260 °C and 3250±449 mg/m3 at 315 °C, as well as 8.91±0.07 mg/m3 for CO at 315. However, these concentrations are meaningless without knowing the puffing parameters used for the Joyetech eVic-VT, a sub-ohm device that can run to high power up to 230 W and that they tested at its maximal temperature. The authors remark that their CO emissions were lower than those reported by El Hellani et al. [36] which surpass National Ambient Air Quality Standard, but (as we show in our comments on that study in Section 7) these outcomes correspond to unrealistic puffing parameters and thus are irrelevant for end users.Balushkin et al. This comprehensive study [18] was funded by Philip Morris International. Thirty-four samples were tested of commercial devices purchased in 2015, 2017, and 2018: closed disposable “cigalike”, cartridge systems and open tanks models (brands listed in supplementary file) and analyzed with 57 e-liquids brands and flavors, together with an internally prepared reference e-liquid (39.1% PG, 39.1% G, 1.8% nicotine, and 20% water) used in testing open tank systems.The authors focus on carbonyls, specially: acetaldehyde, acrolein, and formaldehyde, though other HPHCs (nitrosamines, metals) were also targeted and generally found not quantifiable. The devices were tested from maximal e-liquid levels until full depletion, in horizontal position and at the highest temperature or power setting (for devices with variable temperature or power). Carbonyl compounds were analyzed using HPLC-UV. The study follows the CORESTA method 81 standardized aerosol generation and collection protocol, though slight variations of this protocol were used only for 9 closed systems, but these small puffing protocol deviations had little effect in their carbonyl emissions.
The authors define the “end of life” criterion for e-liquid depletion (12.5 mg mass loss per blocks of 50 puffs) to allow for a direct comparison of products and avoidance of dry puffs. Outcomes are reported on a per-puff basis computed from the lifetime average yields. The study shows that generally low-powered closed systems produce the lowest levels of lifetime average yields of carbonyl emissions (18.9–10,700, formaldehyde (see their Table 3), while these emissions are in general higher in open tank systems (538–53,400 ng/puff, formaldehyde (see their Table 4). However, these outcomes might be overestimations with respect to real life usage, as users might feel a foul flavor well before high lifetime percentages arise. Also, some of the tested devices were acquired as far back as 2015, which does not rule out corrosion and leaching effects, given the lack of information on their storage conditions.
Some of the results of the study provide very useful information to consumers. As shown in the examples displayed in Figures 4 and 5 of Baluskin et al., outcomes of formaldehyde in a closed system increase by an order of magnitud as the device reaches 50% of its lifetime, thus suggesting the need to avoid toxicants as best as possible by using the devices with high e-liquid levels in cartridges and tanks. Also, as shown in the supplementary file, usage of the device at 45 degrees inclination in general produces less carbonyl yields. The authors also stress the use of air blanks to avoid misrepresentation of the data in laboratory testing.
The study confirms facts that follow from the considerations we have presented in Section 2 on an optimal regime for aerosol generation and the realistic usage of devices, namely: negligible to low carbonyl yields occur in low-powered devices tested with an appropriate verification of absence of dry puffs, under CORESTA or CORESTA-like puffing protocols that are appropriate for the design of these devices. The authors do recognize that such puffing protocols are inadequate for testing sub-ohm open tank systems, which as we have stated, drastically reduce the power ranges of the optimal regime and do not provide (specially at high power settings) sufficient airflows and puff volumes that these devices require for an efficient aerosol generation to be used for DTL vaping.Reilly et al. The authors [19] examine carbonyls and nicotine yields, as well as free radicals in aerosol emissions from four different flavors of Juul devices. The four flavors available at the time of the study (currently only tobacco and menthol are available) exhibited no difference in nicotine yields (164±41μg/puff), formaldehyde (0.20±0.10μg/puff), acetone (0.20±0.05μg/puff) and PG/VG ratio (PG/VG 30:70). To quantify free radicals the e-liquid in the cartridges were refilled with nicotine-free PG/VG ratios 30:70 or 60:40 with or without citral, leading to a concentration of 5.85 ± 1.20 pmol/puff ∼1011 nmol/puff (5–6 orders of magnitude below cigarette smoke). Juul devices produce free radicals and carbonyls at substantially lower levels lower than those observed in other e-cig products. 6.3. Studies Published in 2020Son et al. This study [21] evaluated the effects of device settings, vaping topographies and e-liquid compositions on the levels of carbonyl compounds. For the tested power settings devices with bottom coils generated 10–10,000 less formaldehyde than cigarette smoke. As the authors argue, aerosol emissions are affected by the patterns of of EC usage: puffing parameters (puff duration, frequency, volume), power settings, coils and e-liquids. As a guideline to determine their experimental settings from a wider variety of these patterns, the authors resort to the same parameters they have used in previous studies [40,95], based on observational data obtained from the same sample of 23 recruited vapers (we review [40] in Section 8).All experiments were conducted with values from this observational data. For power and puff volume, the median (average, 95% percentile) were 6.4 (14.7, 31.3) W and 90 (35, 170) mL, puff duration 2.0 and 3.8 s (24 s interpuff interval). The EC was also the same is in [40,95]: refillable tank with replaceable Nichrome heating dual-bottom coils with 0.8 Ω, with two batteries Apollo Valiant battery (Apolo E-cigarette, Concord, CA, USA) and Sigelei-100W battery (Sigelei US, Pomona, CA, USA), range of power outputs 3–80 W, with wattage obtained by varying voltage for the 0.8 Ω coil. Collection and analysis: DNPH cartridges and an HPLC/UV system. To assure better control, e-liquids were prepared in situ in three compositions 100% VG, PG/VG 50:50 mixture and 100% PG, with 8 flavors freshly prepared by adding 10% of the corresponding flavoring agents.As expected, aldehyde yields increased with power (6.4 W to 31.3 W), with larger rates for PG and PG:VG than for VG e-liquids, since PG boiling temperature is lower and byproduct formation initiates at lower temperatures as power increases. Formaldehyde yields increased for all e-liquids at increasing power (6.4–31.3 W), but (as expected) with a larger rate for PG and PG/VG 50:50 e-liquids than VG e-liquids. Acetaldehyde did not increase in 6.4–31.3 W in the VG e-liquid, but increased 2.7 and 8.5 times in PG/VG 50:50 and PG e-liquids. Acrolein yields increased 2 times between 6.4 W and 31.3 W. Fruit flavored e-liquids produced higher formaldehyde yields than mint/menthol and creamy/sweet flavored ones.
In terms of vaping topography, formaldehyde yields increased with increasing puff volume (35 mL to 90 mL) for fixed puff duration, but not significantly in 90–170 mL, increasing also with puff duration for fixed volume. However, as shown in their Table 3 for a pure VG e-liquid at 6.4 W, these combinations of puff volume and duration do not involve significant increase of aldehyde yields: for puff duration increasing 2 s to 3 s at average 90 mL puff volume formaldehyde goes from 790.0±32.3 to 903.0±56.2 ng/puff, with much smaller yields in all parameters for the remaining aldehydes.
This study is valuable because the authors have made an effort to incorporate in their experimental design a much wider set of vaping parameters (puffing, power settings, e-liquids, flavors) than most emission studies, which simply choose a fixed set for the whole testing. However, the authors’ choice of parameters is still too limited, even if referred to the data of the small sample of 23 vapers they are considering. For example, instead of considering e-liquids with pure PG and VG (which are not realistic) a better choice would have been PG/VG 30:70 and PG/VG 70:30 mixtures.
Also, Table S2 of their Supplementary File shows that up to a 75 percentile of the 23 vapers use power settings below 13 W, while the upper value 31.3 W corresponds to a 95 percentile (one of the 23 vapers). Also, the authors mention in [95] that “These selected power output levels (6.4, 14.7, 31.3 W) have been characterized as safe, hot, and extremely hot on a popular consumer Web site that provides users with vaping tutorials”. This is information from users based on their sensorial perception, it should not be dismissed (at least it should be considered). This information suggests that the lowest experimental value, 6.4 W, is representative (i.e., “safe”), not only of this sample but of consumers of this type of devices, while the upper experimental value 31.3 W is not only an outlier in this sample, but it is very likely a power setting that consumers would avoid (“extremely hot”).Evidently, the possibility that 31.3 W could be an unrepresentative outlier (likely used in the reference sample by one or two vapers) should have been verified by inquiring with end users. Consultation with end users and considering the output from their sensorial experiences can be extremely useful to set up realistic and relevant experimental parameters (see [34,53]). This is important, since at 31.3 W the levels of all carbonyls (specially formaldehyde) that were found in this study are much higher (specially for the unrealistic pure PG e-liquid). Considering 31.3 W as still representative, but without verifying it, might lead to artificially high estimations of ranges of carbonyl yields and exposure levels.Considering as the most realistic parameters the V:G 50:50 mixture at 6.4 W, the values of carbonyl yields reported in Table 4 of their supplementary file of experimental outcomes for the combinations of power and e-liquid composition, shows a maximal formaldehyde yield of about 1 μg/puf, which for 250 average daily puffs leads to a daily formaldehyde exposure of 250 μg/day which is close to the strict AFNOR and OEHAA thresholds (assuming 20 m3 of daily breathed air), but well below the occupational PEL-NIOSH of 18.45 mg/day.
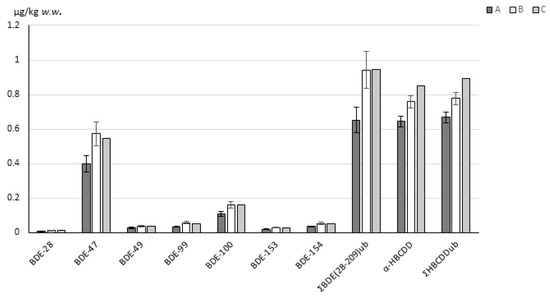
Zelinkova and Wenzl The authors [23] tested the Voopoo Drag with its 0.25 Ω and 0.5 Ω and Vaporesso SWAG device with 0.15 Ω and 0.5 Ω coils. The devices were filled with PG/VG 50:50 e-liquids and the puffing protocol was a CORESTA regime. Formaldehyde, acetaldehyde, acrolein, propionaldehyde, acetone, butyraldehyde, crotonaldehyde and 2-Butanone were quantified for each power tested and matched with the mass of e-liquid vaporized. Power levels were varied from the lower one recommended by the manufacturers to levels above their recommendation. Each experiment was conducted in triplicate. Although the usage of a CORESTA protocol for testing two sub-ohm devices is either unrealistic or only relevant for a minority niche of users (see Section 3 and Section 4), the study results are valuable, as they allow for the estimation of a maximal supplied power marking the outset of the exponential increase of aldehydes production. This study together with [22] illustrate the link between the optimal regime and a minimal aldehyde production (see Section 2).Talih et al. The authors [22] examine and discuss the link between boiling processes and carbonyls formation. They tested 3 devices: a TF-N2 (0.12 Ω), a TFV12-Q4 (0.15 Ω) and a VF platinum (2.2 Ω), all filled with pure glycerol e-liquid, applying a 1 L/min airflow over 15 puffs of 4 s duration and 10 s interpuff interval (an excessively intense regime). This is an important study, which (as we discussed in Section 2) provides a significant contribution to the understanding of the physical processes of an overheating regime linked to film boiling. Although its experimental setup is unrealistic: two sub-ohm devices tested under a CORESTA-like regime with intense puffing, with all 3 devices tested at maximal power above the manufacturers recommendations, the authors’ results illustrate that maximal supplied powers leads to an exponential increase in carbonyl production, specially formaldehyde, whereas these byproducts remain at minimal levels under specific power ranges that define optimal operational conditions.Uchiyama et al. The authors [24] examine the effects of power and temperature on the generation of byproducts resulting from the thermal degradation pathways of PG and VG from 3 comercial devices. The 3 tested devices were not fully identified (no information whatosoever is supplied on models and brands), but from the described characteristics of the mods and atomizers it is evident they are powerful sub-ohm devices. For their denomination as Brands A, B, C respectively, battery voltage (V): 3.7, 3.7, 37, power range (W): 1–75, 7–75, 7–85, coil type and resistance (Ω): stainless steel 0.1–3.5, stainless steel 0.1, stainless steel and zinc alloy 0.3–3, recommended power range (W): 40–50, 15–60, 30–60. New atomizers were used in all e-cigarettes. Only one commercially available e-liquid consisting of PG (approx. 30%), and VG (approx. 70%) containing nicotine (approx. 0.3%), menthol, and apple flavor was used for all e-cigarettes.Aerosol generation and collection was conducted according to the CORESTA protocol: 55 mL puff volume, 3-s puff duration, and 60-s puff interval. The latter interval was modified from 30 s to 60 s, since puffing had to be interrupted after approximately 10 puffs because of overheating and so the EC switch was turned on 2 s before puffing and turned off 10 s later. Analysis was conducted with QP 2010 Plus GC/MS and LC-20(HPLC) systems (Shimadzu, Kyoto, Japan).
Generation of carbonyl byproducts was very low with total particulate matter (TPM) 13 mg/15 puffs at supplied power of 10 W, but above 40 W byproduct generation exponentially increased. Testing the devices at 50 W shows (their Table 4) that device B emits much higher mass levels (in μg) in the gas phase than those of tobacco smoke (CM6 cigarette) of formaldehyde (2300±220 vs. 15±0.5), acetaldehyde (1800±580 vs. 1200±150) and acrolein (830±87 vs. 120±3.2).
The authors recognize that such high outcomes are associated with high temperatures (determined by temperature programs of the mods but not validated by the authors) exceeding 500 °C at 60–75 W reached by the atomizer of the device B, while the maximum temperature of the atomizer Brands A and C was approximately 250 °C with small variations above 40 W (this differences in temperatures are displayed in their Figure 7), While formaldehyde, acetaldehyde and acrolein reached for Brands A and C much lower levels than those with Brand B, these levels are still comparable to those of tobacco smoke (in their Table 4).
Evidently, several flaws can be identified in this study. Failure to properly identify the devices makes it more difficult to interpret outcomes and prevents any replication of the experiments. An odd result is finding formaldehyde split in the gas and particle phases, when its high volatility suggests it should be predominantly in the gas phase (an explanation of this odd result in terms of the aerosol collection methods was suggested in [30]).However, the main shortcoming of this study is the usage of a CORESTA puffing protocol for testing sub-ohm devices at high power settings, as this leads to user irrelevant experimental conditions that are prone to overheating, as the authors recognize when setting up the puffing procedure sequence by turning off the device puffing 10 s after each puff. While carbonyl outcomes from devices Brands A and B were much lower, they were also extremely likely artificial overestimations due to testing under inadequate parameters. The authors’ risk assessments are not relevant for real life vaping, as end users of these devices vape the DTL style with airflows and puffing volumes far larger than those of CORESTA protocol used to test them. A final remark, the authors refer to usage of EC’s as “smoking” and vaping aerosols as “smoke”. This a profoundly mistaken and misleading terminology.
Cunningham et al. This extensive study [25] by industry funded authors (British American Tobacco BAT) analyzes toxicant content in EC emissions from five EC manufactured by BAT, looking at the effects on the emissions from the variation of wicks, atomizer coils and benzoic acid content. After quantifying 97 aerosol constituents and 84 smoke compounds, 16 of the 19 HPHCs identified by FDA were absent in the emissions of all tested ECs. A comparison with two tobacco cigarettes showed that levels of the nine World Health Organization (WHO) TobReg priority cigarette smoke toxicants were more than 99% lower in the emissions of the ECs. No evidence was found of toxic byproducts formed from the thermal decomposition of benzoic acid in the e-cigarettes tested or from enhanced thermal decomposition of propylene glycol or glycerol by the nickel–iron coil.The tested devices were BAT products: Vype ePen2 and Vype ePen3 (both Nicoventures Trading Ltd., Blackburn, UK). The study tested the Vype ePen2 at high power setting 4.4 W, but a low one 2.8 W is available. The device is button activated and is formed by a reusable section with a 650-mAh rechargeable battery and a disposable flavor cartridge, a silica rope wick and an NiCr coil. The Vype ePen3 operates at 5.9 W with a NiFe coil resistance 1.95–2.36 Ω, it is a closed system with a rechargeable 650-mAh battery and a flavored e-liquid pod of 2 mL capacity. The devices contains protect circuit board (PCB) to prevent over current and over charging. A fully charged battery provides 200 puffs.
The devices use e-liquids with different ratios of nicotine vs. benzoic acid and slightly different PG/VG ratio. For the comparison of the aerosol chemistry the ePen2 and ePen3 are filled with Blended Tobacco (18 mg/mL nicotine) and only the ePen3 with Master Blend (18 mg/mL nicotine with medium benzoic acid). The two cigarette products were: Kentucky reference 1R6F and Benson & Hedges Skyblue (Japan Tobacco International).
EC devices were tested with the puffing protocols of the CORESTA method 81 EC. For the tobacco cigarettes Canadian Modified conditions (55-mL puff volume, 2-s puff duration, 30-s interval, vents blocked). Aerosol collection: glass fiber filter disc (pad) followed by an impinger. Analysis by GC-MS. The authors provide measurements of background air/method samples and emphasize their importance to avoid confounding the quantification of toxicants at low concentrations with contamination from laboratory air and analytical methodology equipment and reagents.
Quantified outcomes are displayed as mass per puff for the ECs and tobacco cigarettes (Tables 3 and 4). For the ECs, besides aerosol collected matter, water, nicotine and the solvents PG and VG, most carbonyls appear BLD or NQ, with formaldehyde, acetaldehyde, acetone, methylglyoxal, isobutyraldehyde appearing at ng/puff levels. The remaining compounds (triacetin, menthol, PAHs, VOCs, TSNA, phenols, flavorants, acids and CO) are also BLD or NQ. The authors display the outcomes of same compounds for EC emissions as mass normalized by nicotine in their Tables 4 and 5. Depending on the nicotine concentration in the e-liquids, the ePen2 had 3–7 times lower nicotine yields per-puff than the ePen3 and 81% lower than those from both cigarettes, while the ePen3 with high levels of benzoic acid produced larger nicotine yields than the cigarettes.
The authors discuss various forms of comparing EC emissions with tobacco smoke, all of which showing a 2–3 orders of magnitude reduction in toxicant content. The lack of detection of benzene, phenols and PAHs rules out degradation products from benzoic acid, while absence of byproducts of wick materials (cotton and silica) in both EC devices disproves the hypothesis that silica is thermally more stable than cotton and provides evidence that wicks of both devices are stable under standard EC operating conditions.
Noël et al. The authors [26] examine the production of three aldehydes (formaldehyde, acetaldehyde and acrolein) from an unspecified EC device, undertaking a comprehensive cytotoxicity analysis on gene expression in human bronchial epithelial cells exposed at the air–liquid interface to the device emissions.The authors do not disclose the device model and brand, they only mention that it operates with atomizers set up with 9 distinct resistance/voltage combinations: 0.15, 0.5 and 1.5 Ω and 2.8, 3.8 and 4.8 V, which leads from Ohm’s law to these power ranges for each voltage: 52, 96, 153 W for 0.15 Ω, 16, 28, 46 W for 0.5 Ω and 5, 10, 15 W for 1.5 Ω. E-liquids with 36 mg/mL of nicotine were used (to mimic exposure of heavy smokers), PG/VG 50:50 ratio, and with either butter or cinnamon flavors. The puffing protocol was CORESTA 81: 3-s puff duration, and a 55-mL puff volume every 30-s. Samples were collected in 10-puff sessions. Quantification by gas chromatography with a flame ionization detector (GC- FID). Analysis HPLC.
Nicotine, acetaldehyde, formaldehyde, and acrolein levels (μg/puff) were flavor dependent. Large increase occurs when comparing 0.15 vs. 1.5 Ω at 4.8 V (15, 46, 153 W). Lesser increase was found for cinnamon flavor (acrolein was below LOD). Carbonyl yields were low for 1.5 Ω at all voltages (5, 10, 15 W). From the bars in their Figure 1, the three aldehydes have negligible levels (approx. 0.5 μg/puff) for all tests with 1.5 Ω and all voltages, with formaldehyde, acetaldehyde and acrolein, respectively, reaching 18, 10, 10 μg/puff for the combination 0.15 Ω at 4.8 V (153 W), with values for 0.5 Ω closer to those with 1.5 Ω.
The authors claim that sub-ohm vaping induces flavor dependent detrimental effects to human lung epithelial cells. They conclude that taking together their experimental results could help policymakers to “take the necessary steps to prevent the use or manufacturing of sub-ohm (i.e., 0.15 Ω) atomizers”, as their emissions induce flavor-specific detrimental effects on lung cells due to cytotoxicity, enhanced oxidative stress, low levels of nitric oxide, diminished transepithelial electrical resistance (TEER), and altered expression of key genes associated with biotransformation, oxidative stress, and inflammation, all this besides cellular toxicity via oxidative stress mechanisms. Further, they claim that their data also suggests that ECs may not be a “safe” alternative to conventional cigarettes.
Evidently, the authors are issuing completely unwarranted and disproportionate statements. The claim that the type of laboratory cytotoxic experiments they have performed can somehow predict actual clinically verified harm in sub-ohm vapers, which would merit such a harsh regulation, is extremely speculative. The resulting increase of aldehyde levels, as well as their connection with deleterious cytotoxic effects from the sub-ohm device, simply follow from the authors’ inappropriate and unrealistic experimental design: using a CORESTA puffing protocol to test this type of device at high power settings (153 W), which as we explained in Section 2 are the testing conditions that lead to overheating and possibly dry puff, producing an aerosol that end users most likely would find repellent.Mallock et al. This German study [27] compared the US and European versions of Juul. While the early European version did not compensate for a much lower e-liquid nicotine concentration in this version, the modified version shows an increased vaporization that provides a better approximation to the nicotine delivery of the US version. Notably, carbonyl levels remain comparable to those of the US product. In general, carbonyl and other emissions byproducts are detected in Juul devices in lower levels than in other pod devices. 6.4. Studies Published in 2021Chen et al. This comprehensive study [28] of Juul emissions by from Juul Labs, tested 4 Juul devices in terms of 4 product combinations available in the US market in 2021: nicotine concentrations 35/59 mg/mL in two favors: Virginia Tobacco (VT) and Menthol (Me). Carbonyls are in the Group I of analytes based on FDA guidance for in its Pre Market Tobacco Authorization (PMTA) process for vaping products. Aerosol was collected for Group I only in the “nonintense” (NI) regime with 3 s puff duration and 30 s interpuff interval. Ten replicate measurements were performed from each of each product combination. More than 40 of the 53 targeted analytes were below detection or below quantification. Mass per puff was analyzed over three 50-puff collection blocks: beginning, middle and one at the end. The outcomes were displayed in Table 3, showing the largest mass yields for formaldehyde and acetaldehyde at ∼10−2μg for all product combinations.Crosswhite at al. This study [29] was also funded by Juul Labs. It applied a nontargeted analysis to obtain a more complete list of aerosol constituents in the aerosol generated by the 4 varieties of Juul devices: Virginia Tobacco pods with 3.0% and 5.0% nicotine concentrations (VT3 and VT5). Aerosol was generated in sequential 50 puff blocks for a nonintense (3 s puff duration, 30 s interpuff lapse, 55 mL puff volume) and intense (6 s puff duration, 30 s interpuff lapse, 110 mL puff volume) regimes.The analysis employs two complimentary nontargeted analytic methods: GC–MS methods optimized and adequate for analysis of for volatile/polar, including flavor and aroma compounds, together with LC–MS-based methods amenable to characterize semi/non/volatile, semi/non/polar and higher-molecular-weight compounds that might be contained in the liquid droplets making the particulate phase of EC aerosol. hieve a quantity estimation across multiple compounds. While these complementary analysis methods cover a broad chemical space, they cannot detect all chemicals in the aerosol (metals and nonionizable compounds). Aerosol trapping methods were adapted for each analytic technique. Blank samples were also analyzed.
Nicotine, PG, VG and benzoic acid were not detected. All detected compounds were above 0.7 μg/g for GC–MS analysis and above 0.5 μg/g for LC–HRMS analysis and differing from blank measurements were identified and semiquantified. Tentatively identified analytes were grouped in five groups: flavorants, HPHCs (from the FDA tobacco product supplied list), extractable and leachables, byproducts of chemical reactions and unidentifiable compounds. For VT3 the five groups formed 0.23% (intense) and 0.2% (non intense) of the aerosol mass, itemized as flavorants: 70% (intense) and 75% (nonintense), reaction byproducts: 16% (intense and nonintense). HPHCs were not detected in the nonintense regime. Similar outcomes were obtained for the VT5 in both intensity regimes. The numbers of detected compounds were 88 (VT2) and 91 (VT5), of which 67 are common in both intensity regimes, while compounds common with the 5162 compounds of tobacco smoke were 29 (VT3) and 32 (VT5).
Li et al. The authors [30] tested mainstream aerosols from a third generation device, Evolv DNA 75 color modular vaping device (Evolv LLC., Hudson, Ohio) with replacement single mesh vaping coils (SS316L, FreeMax Technology Inc., Shenzhen, China) that have a coil resistance of 0.12 Ω.Emissions were tested for puffing parameters close to the CORESTA protocol: fixed flow rate 1.186±0.002 and puff volume 59.3±0.1 mL, but with variable puffing rate (2, 3, 4 puffs/min) and puff duration (2, 3, 4 s) at a fixed flow rate, both at 191 °C, 3 s puff and e-liquid with PG/VG = 30/70 and 3 mg/mL nicotine. Temperature was set for the tests at 157, 191, 216, 246 and 266 °C with the temperature control software supplied by the manufacturers. The authors recognize that this modified CORESTA protocol cannot be extrapolated to real vaping scenarios, but claim that increasing puff duration and controlling temperature can somehow compensate this limitation. However, it is unrealistic to keep fixed a CORESTA airflow and the temperature (assuming the device temperature control is accurate) while increasing puff duration. As we elaborate in Section 2 and Section 12, this is the main drawback of this study.The chemical characterization of carbonyl byproducts is undertaken by targeted and nontargeted analyses using LCHR-MS (liquid chromatography high-resolution mass spectrometry), GC gas chromatography, besides in situ chemical ionization mass spectrometry, and gravimetry. The authors provide a comprehensive discussion of the thermal degradation reaction pathways involved in carbonyl production in the normal temperature range of realistic vaping (below 266 °C), arguing that the heat-induced dehydration mechanism is dominant over the path of H-abstraction by radicals such as OH, the latter playing a minor but not negligible role.
The results of the study reinforce known outcomes: most aerosol components are volatile or semivolatile, with over 99.5% of emissions made of PG and VG in both aerosol phases. The study finds that PG mostly tends to be found in the gas phase, with the particle phase containing substantial part of VG and all nicotine (the nicotine phase partition depends on the e-liquid PH). Volatile carbonyls (including formaldehyde) tend to be in the gas phase. Other outcomes are:
The temperature dependence of carbonyl production is very sensitive to the coil metal alloy (the authors’ Figure 2), an expected result given the different heat conducting coefficients of these metals.The mass yields (in μg/puff) displayed in their Figure 3 show formaldehyde, hydroxyacetone, acetaldehyde, acrolein, and propionaldehyde, characterized by an exponential dependence on temperature that is seen to become steep at the upper temperature range (266 °C), while the dependence is linear for acetone, dihydroxyacetone, and glyceraldehyde.
The PG/VG and nicotine ratios and nicotine proportion in the particle phase closely mirrors the PG/VG e-liquid ratio, with the 30/70 mixture (at 191 °C) leading to roughly 3/4 VG and 1/4 PG with 0.3% nicotine.
As expected the mass concentration of 7 carbonyls increase with an increasing puff duration at same temperature (191 °C) and with fixed airflow (which makes these values unrealistic).
These results are consistent with the reaction modeling suggesting a higher efficiency of the heat-induced path at the tested temperature range, while the linear dependence (which may become exponential at temperatures higher than those tested) is consistent with the radical pathway dominating at temperatures above 360 °C. Although computerized modeling supports the heat-induced pathway from VG to be more efficient than the radical pathway at normal EC usage temperatures, formaldehyde, hydroxyacetone and acrolein can be formed from either pathway and from both PG and VG.
In discussing health impacts, the authors recognize that the doses for both solvents PG and VG are below toxicological makers and that the carbonyl concentrations they found are way below those of tobacco cigarettes (even in their higher range of tested temperatures). However, they develop questionable speculations on inhaling excessive doses of acrolein from the fact that this aldehyde is mainly a byproduct of VG, which becomes the dominant compound in the emissions as vaping proceeds.
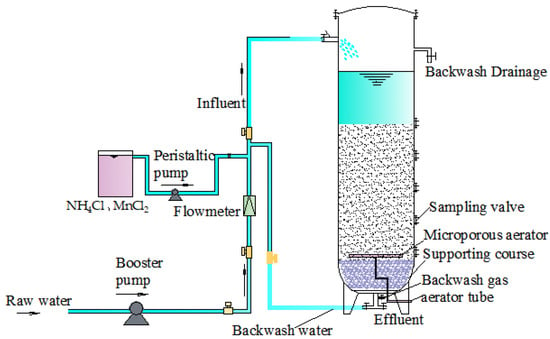
Assuming an 8:1 ratio of VG to PG mass aerosolization for a PG/VG 30:70 mixture, they estimate (based on the outcomes they found in the study) that only 30–40% of the e-liquid will be consumed (well before liquid depletion) when it becomes entirely VG with likely a high acrolein content. This is very questionable, first because this hypothetical acroleine exposure is not applicable to actual vapers, since (as the authors admit) the puffing setup that they used cannot be extrapolated to real vaping scenarios (we discuss this issue in Section 12). Second, since sub-ohm tank devices are normally vaped with PG/VG 30:70 ratios and low nicotine concentrations for direct to lung style, serious deleterious effects from such an acrolein excess would have likely been noticed by end users who (following the authors’ hypothesis) would end up vaping almost pure VG at high power ranges. However, so far the main reported concerning carbonyls are formaldehyde and acetaldehyde, with acrolein playing a minor role and (as far as we are aware) there is no evidence that sub-ohm vaping of VG dominated e-liquids intrinsically produces more adverse respiratory effects than other vaping styles and e-liquids.Yan et al. The authors [31] apply orbitrap MS for a nontargeted analysis of EC emissions. They identify more than 30 “features” characterized by pairs of the mass to-charge ratio of the compound and the retention time. Compounds are identified containing nicotine and PG (NIC-PG) with increasing abundance relative to nicotine increasing supplied power.Devices: OD1: an iStick 25 (Eleaf, Shenzhen, China) with power range 1–85 W and equipped with a HW2 coil (recommended range 20–70 W), and OD2: a SMOK Alien 220 Mod device (Shenzhen IVPS Technology Co, Shenzhen, China) with P = 6–220 W and equipped with a TFV8 Baby Tank and a SMOK V8 Baby-Q2 coil (recommended power range: 20–50 W). E-liquid was VG/PG 80:20 mixture. Aerosol was collected by a system of tubes and pipettes to a peristaltic pump. The devices were tested at high powers, OD1: 20, 40 and 80 W, OD2: 40, 120 and 200 W. The puffing protocol was: 4 s puffs, interpuff time 26 s at a flow rate of 1 L/min.
Except for the use of a different analytic technique (orbitrap MS) and a nontargeted approach, the authors used exactly the same experimental setup (devices, power settings, puffing parameters) as a study that we reviewed in [5] by Zhao et al. [96], which tested by means of the same low airflow CORESTA-like protocol the same high-powered sub-ohm devices at high power settings, even well above the settings recommended by the manufacturers. As we argue in Section 2, this experimental setting is a blue print for detecting large byproduct yields produced by laboratory testing under unrealistic and clearly overheating conditions that are prone to produce large levels of toxic byproducts. As with the sub-ohm devices tested in the study reviewed in [5], the experimental results of this study have no relevance for end users.Tehrani et al. The authors [32] apply LC-HRMS, a sensitive analysis technique, to a nontargeted study of e-liquids and EC aerosols from 4 devices. The number of detected compounds and the proportion of combustion associated hydrocarbons in e-liquids increased when in aerosol form. Lipids and hazardous additives and contaminants, such as tributylphosphine oxide and the stimulant caffeine were also detected in e-liquids and aerosols.The authors tested the following 4 devices: a third-generation modifiable-power (Smok ProColor 225W with TFV8 Big Baby Beast Tank, Shenzhen Ivps Co., Ltd., Shenzhen, China), two fourth-generation cartridge (“pods”): Juul, Juul Labs, San Francisco, CA and Vuse Alto, British American Tobacco, London, UK), and a disposable pod device (Blu Disposable, Imperial Brands, Bristol, UK). E-liquids covered a wide range of nicotine levels (whether base or salts) but only with tobacco flavor.
Aerosol was generated at 1.1 L/min airflow with puff topography based on the International Organization for Standardization 20768:2018 method 1541: 3 s puff duration and a shortened interpuff interval of 10 s. The shorter interpuff interval was found to be necessary to produce sufficient condensed aerosol sample volumes for Blu, Juul, and the PG/VG base e-liquid. Three blocks of consecutive 100 puffs each were machine puffed for each device, recharging after each block, with aerosols generated from a single pool of e-liquid for each product for the 3 blocks. Slightly higher aerosol mass was generated in the final 100-puff interval for the Juul, whose maximal set by manufacturers is 200 puffs.
It is not surprising that such a vast array of compounds were detected, given the high resolution of LC-HRMS and the enormous amount of generated aerosol from such an extremely intense puffing regime: 3 blocks of 100 puffs taken each 10 s. Since demographic studies of vapers in natural conditions [72,73,74,75] show on average 200–300 daily puffs, such a regime would involve compacting all daily puffing during 12–16 h of wakefulness into 30–50 min. This is evidently an unrealistic experimental setup geared to detect as much compounds as possible, even if this is achieved under conditions completely unrelated and detached from real life.Besides being unrealistic, this regime is an artificial way to magnify detection of byproducts in emissions, even from the trapping material or the environment. As shown in the study by Belushkin et al. [18], production of byproducts in the aerosol significantly increases as a device is consuming e-liquid that is progressively “aging”, even without depletion. This aging can be critical for low-powered pod devices being puffed with the same e-liquid 300 times every 10 s.Regarding the Smok ProColor 225W with a TFV8 Big Baby Beast Tank, a powerful sub-ohm device, the authors fail to disclose the power settings and coil resistance with which it was tested, an essential information to interpret and possibly replicate their results. Also, the use of an airflow of 1.1 L/min is completely inappropriate for such a device designed and used for DTL vaping. Testing this device with this puffing regime most likely leads to overheating conditions even if puffed within the recommended power settings (see Section 2). Furfural and various fatty acids are byproducts of cellulose (wick) pyrolysis (see Section 3), but are also among the compounds detected in this study, which would confirm testing under dry puff conditions.The authors present a very detailed examination and classification of the detected compounds, validation tests and calibrations. However, this comprehensive study is completely unrealistic and irrelevant for end users.
Cancelada et al. The authors [20] quantified HPHCs in aerosols emissions generated using a SMOK V8 kit designed with a TFV8 Big Baby tank and five coils M2 (0.15 Ω and 0.25 Ω), X4 (0.15 Ω), T8 (0.15 Ω) and Q2 (0.6 Ω) filled with a commercial e-liquid Euro Gold from Naked 100. The experiments were conducted using a fixed nominal voltage of 3.8V (i.e., 98 W for 0.15 Ω coils, 58 W for 0.25 Ω coil and 24 W for 0.6 Ω coil) varying puff volume (50 mL, 100 mL, 250 mL, 350 mL and 500 mL) and a fraction of airflow vent system opening (0%, 25%, 75% and 100%). The first series of experiments reported the masses of e-liquid vaporized (MEV) according to the puff volumes for the different opening fractions tested using the M2 0.15 Ω. Because the results are close to each other (except at very low puffs volume), the authors reported that the puff volume and opening fraction did not affect the mass of e-liquid vaporized. As we argue in detail in Section 2, this interpretation of the results is erroneous, as the experiments were conducted with a single power. This is even more confusing, as the M2-0.15 Ω coil is normally recommended by the manufacturer to operate between 25 W and 80 W and the one tested here was running at 96 W (based on manufacturer information).The authors further graphed an open airflow system vs. puff volume in a grid, with formaldehyde levels quantif
留言 (0)