
記住我
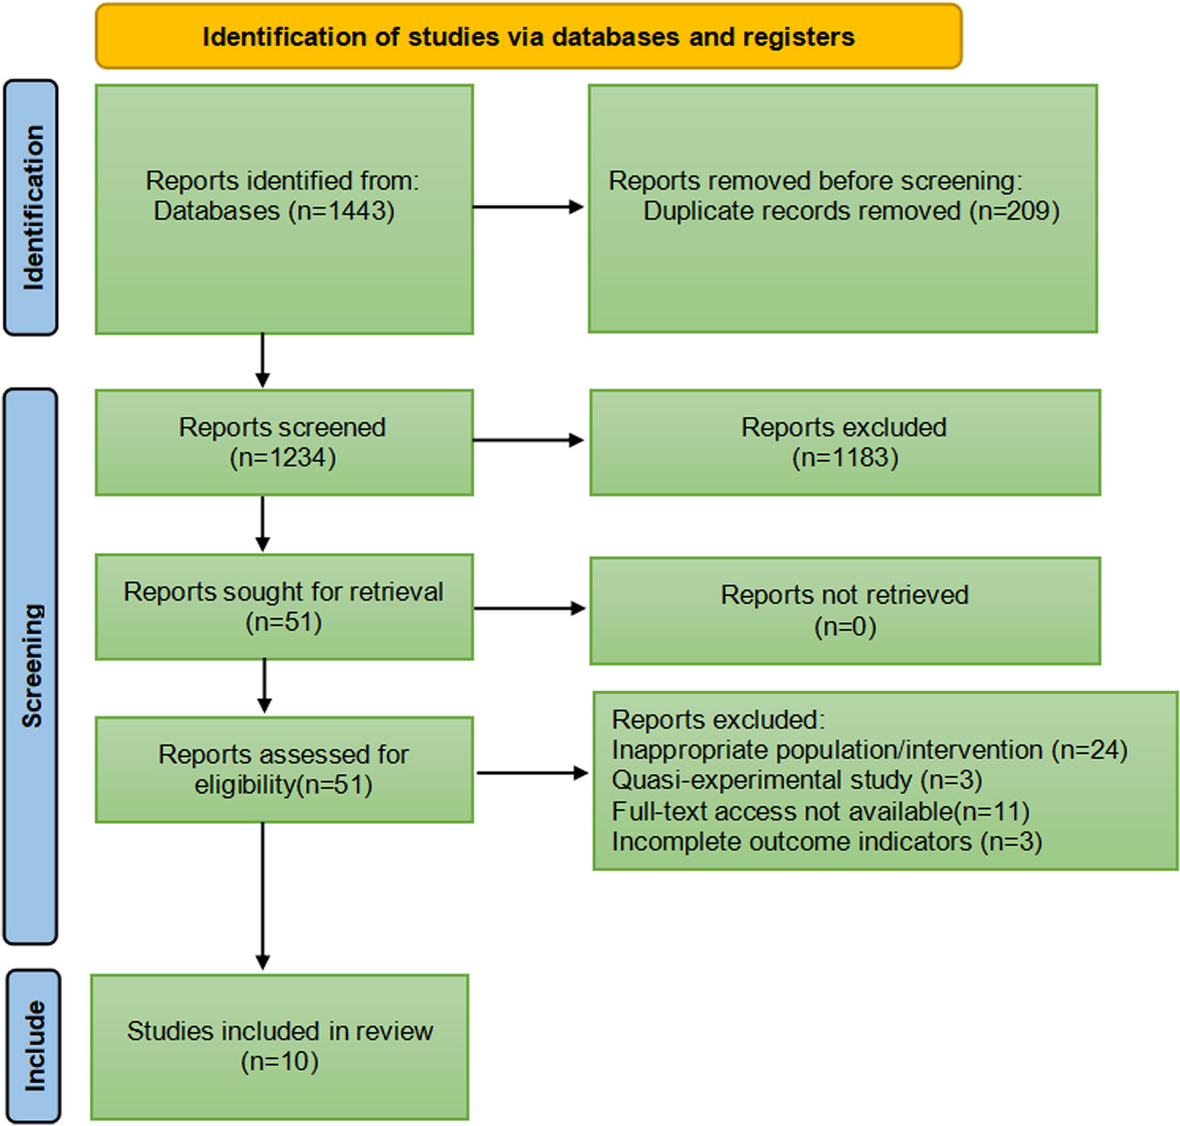
From June 2011 to December 2017, a total of 830 patients with sepsis were admitted to the ICU of Jichi Medical University Hospital. Eleven patients who were readmitted to the ICU were excluded from the study. Sixty-six patients with missing data at the time of ICU admission included in multivariate logistic regressions were also excluded. A total of 753 patients were included in the data analysis. Based on the serum magnesium concentration at the time of ICU admission, 105, 552, and 96 patients were diagnosed as having hypomagnesemia (Mg < 1.6 mg/dL), normal magnesium level (Mg 1.6–2.4 mg/dL), and hypermagnesemia (Mg > 2.4 mg/dL), respectively (Fig. 1). Table 1 shows the baseline characteristics and comparisons between hypomagnesemia, normal magnesium level, and hypermagnesemia groups. Patients with hypomagnesemia had higher severity (SOFA score and APACHE II score), more frequent septic shock and DIC (41.9% vs. 20.7%; P < 0.05), and higher hospital mortality (25.7% vs. 14.1%; P < 0.05) than those with normal magnesium level. In contrast, patients with hypomagnesemia had more frequent septic shock and DIC (41.9% vs. 24.0%; P < 0.05) than those with hypermagnesemia although there were no differences in severity and hospital mortality between two groups.
Fig. 1
Flowchart describing the study population
Table 1 Patient characteristics and laboratory parameters of the study populationAccording to the ISTH criteria, 181 patients had overt DIC. Patients with DIC had higher levels of bilirubin, creatinine, and lactate than those without DIC. Compared to the group without DIC, the DIC group had a higher severity of disease: higher APACHE II score (median: 29 vs 23; P < 0.001) and higher hospital mortality (33.7% vs. 11.9%; P < 0.001) (Additional file 1). The median serum magnesium concentration at the time of ICU admission was 1.9 mg/dL and 2.0 mg/dL in those with DIC and without DIC, respectively (P = 0.007). However, the histogram of serum magnesium concentration showed a horizontal distribution of patients with DIC towards low values compared with those without DIC (Additional file 2). The frequency of DIC according to decile (sorted into ten equal parts) of serum magnesium concentration on ICU admission demonstrated a J-shaped curve (Additional file 2).
Comparison of coagulation parameters according to serum magnesium levels on ICU admissionCompared to patients with normal magnesium levels and hypermagnesemia, those with hypomagnesemia had more activated coagulation status as follows: lower platelet count (median [104/μL]: 11.2 vs. 14.9, P < 0.05; 11.2 vs. 15.1, P < 0.05, respectively), lower fibrinogen level (median [mg/dL]: 268 vs. 356, P < 0.05; 268 vs. 371, P < 0.05, respectively), higher PT-INR (median: 1.52 vs. 1.37, P < 0.05; 1.52 vs. 1.36, P < 0.05, respectively), and higher TAT (median [ng/mL]: 16.1 vs. 10.0, P < 0.05; 16.1 vs. 11.1, P < 0.05, respectively) in multiple comparisons. There were no differences in the marker of fibrinolysis: PIC and FDP between magnesium levels despite more activated coagulation markers in hypomagnesemia. Patients with hypomagnesemia also had a coagulation status of suppressed fibrinolysis. The marker of thrombin generation: TAT (median: 16.1 ng/mL) was markedly increased, the markers of anticoagulant activity: AT III activity (median: 46.2%) and PC activity (median: 42.6%) were moderately decreased, while the marker of fibrinolysis: PIC (median: 1.4 μg/mL) was mildly increased and the marker of suppressed fibrinolysis: PAI-1 (median: 242 ng/mL) was markedly increased. The statuses of activated coagulation and suppressed fibrinolysis were more deteriorated in patients with hypomagnesemia than in those with normal magnesium levels and hypermagnesemia (Fig. 2 and Additional file 3).
Fig. 2
Coagulation parameters between different serum magnesium levels (hypomagnesemia, normal magnesium level, and hypermagnesemia) in sepsis. Box-and-whisker plot depicting a difference in coagulation parameters between different serum magnesium levels (hypomagnesemia [Hypo] vs. normal magnesium level [Normal] vs. hypermagnesemia [Hyper]) in patients with sepsis admitted to the ICU. Admission serum levels of (a) platelet count (104/μL); (b) fibrinogen (mg/dL); (c) PT-INR; (d) FDP (μg/mL); (e) AT III activity (%); (f) PC activity (%); (g) TAT (ng/mL); (h) PIC (μg/mL); (i) PAI-1 (ng/mL). Boxplots display median with first and third quartile, and whiskers indicate smallest and largest nonoutlier observations. *P-value < 0.05, comparison versus hypomagnesemia (Steel–Dwass test). Abbreviations: AT III, antithrombin III; FDP, fibrin degradation products; ICU, intensive care unit; PC, protein C; PIC, plasmin-α2 plasmin inhibitor complex; PT-INR, prothrombin time-international normalized ratio; TAT, thrombin-antithrombin complex; PAI-1, plasminogen activator inhibitor-1
Comparison of coagulation parameters according to serum magnesium levels on days 3 and 5Based on the serum magnesium concentration on days 3 and 5; 62, 558, and 55 patients on day 3; and 30, 471, 41 patients on day 5 were categorized into hypomagnesemia (Mg < 1.6 mg/dL), normal magnesium level (Mg 1.6–2.4 mg/dL), and hypermagnesemia (Mg > 2.4 mg/dL), respectively. Patients with hypomagnesemia on day 3 had the statuses of activated coagulation and suppressed fibrinolysis as follows: lower platelet count, lower fibrinogen level, higher PT-INR, higher TAT, and lower PIC than those with normal magnesium levels and hypermagnesemia (Additional file 4). Although patients with hypomagnesemia on day 5 had lower platelet count and lower fibrinogen level, there were no significant differences in PT-INR, TAT, and PIC (Additional file 5). Patients with hypomagnesemia on day 3 had more frequent DIC from admission to day 3 (met the overt DIC criteria of the ISTH for more than a day by day 3) (35.5% vs. 26.7% vs. 20.8%; P = 0.013), and patients with hypomagnesemia on day 5 had no difference in the frequency of DIC from admission to day 5 (met the overt DIC criteria of the ISTH for more than a day by day 5) (60.0% vs. 42.0% vs. 46.3%; P = 0.14).
Time course of coagulation parameters in persistent hypomagnesemia and resolved hypomagnesemia on day 3Among 105 patients with hypomagnesemia (Mg < 1.6 mg/dL) on admission day, 99 patients were categorized into persistent hypomagnesemia group (Mg < 1.6 mg/dL on day 3) (N = 35) and resolved hypomagnesemia group (Mg ≧ 1.6 mg/dL on day 3) (N = 64) according to the serum magnesium concentration on day 3. There was no difference in the frequency of DIC from admission to day 3 (51.4% vs. 62.5%, P = 0.29), and coagulation parameters except for PAI-1 on days 3 and 5 between persistent hypomagnesemia and resolved hypomagnesemia (Additional file 6).
Time course of coagulation parameters in developed hypomagnesemia and non-hypomagnesemia on day 3Among 648 patients with non-hypomagnesemia (Mg ≧ 1.6 mg/dL) on ICU admission day, 576 patients were categorized into developed hypomagnesemia group (Mg < 1.6 mg/dL on day 3) (N = 27) and non-hypomagnesemia group (Mg ≧ 1.6 mg/dL on day 3) (N = 549) according to the serum magnesium concentration on day 3. Developed hypomagnesemia group had more frequent DIC from admission to day 3 (59.3% vs. 40.0%, P = 0.005), and had the statuses of activated coagulation and suppressed fibrinolysis on day 3 as follows: lower platelet count, lower fibrinogen level, higher PT-INR, higher TAT, and lower PIC than non-hypomagnesemia group (Additional file 7).
Association between magnesium levels and DICUnivariate logistic regression indicated that DIC was associated with hypomagnesemia (odds ratio [OR], 2.77; 95% CI, 1.79–4.30; P < 0.001) and the following factors: APACHE score (OR, 1.10 per score; 95% CI, 1.08–1.13; P < 0.001), bilirubin (OR, 1.12 per mg/dL; 95% CI, 1.05–1.20; P = 0.001), creatinine (OR, 1.14 per mg/dL; 95% CI, 1.06–1.22; P < 0.001), ionized calcium (OR, 0.008 per mmol/L; 95% CI, 0.001–0.046; P < 0.001), and lactate (OR, 1.38 per mmol/L; 95% CI, 1.28–1.48; P < 0.001). Multivariate logistic regression revealed an independent association between hypomagnesemia and DIC (OR, 1.69; 95% CI, 1.00–2.84; P = 0.048) (Table 2).
Table 2 Logistic regression analyses of the disseminated intravascular coagulationThe predictive validity of serum magnesium concentration for DIC
The ROC analysis showed AUC of serum magnesium concentration was 0.57 (95% CI 0.51–0.62, sensitivity 30.4% and specificity 84.6% with a cut-off of 1.6mg/dL) (Additional file 8).
The sensitivity analysisMultivariate logistic regression revealed no independent association between hypomagnesemia and DIC among patients with abdominal sepsis (OR, 0.88; 95% CI, 0.39–2.02; P = 0.77), while an independent association was demonstrated between hypomagnesemia and DIC among patients with non-abdominal sepsis (OR, 3.04; 95% CI, 1.46–6.32; P = 0.003) (Additional file 9 and 10).
留言 (0)