
記住我


The research plan was approved by the ethics committee of Ruijin Hospital, Shanghai Jiao Tong University School of Medicine. All participants included in the study signed informed consent forms.
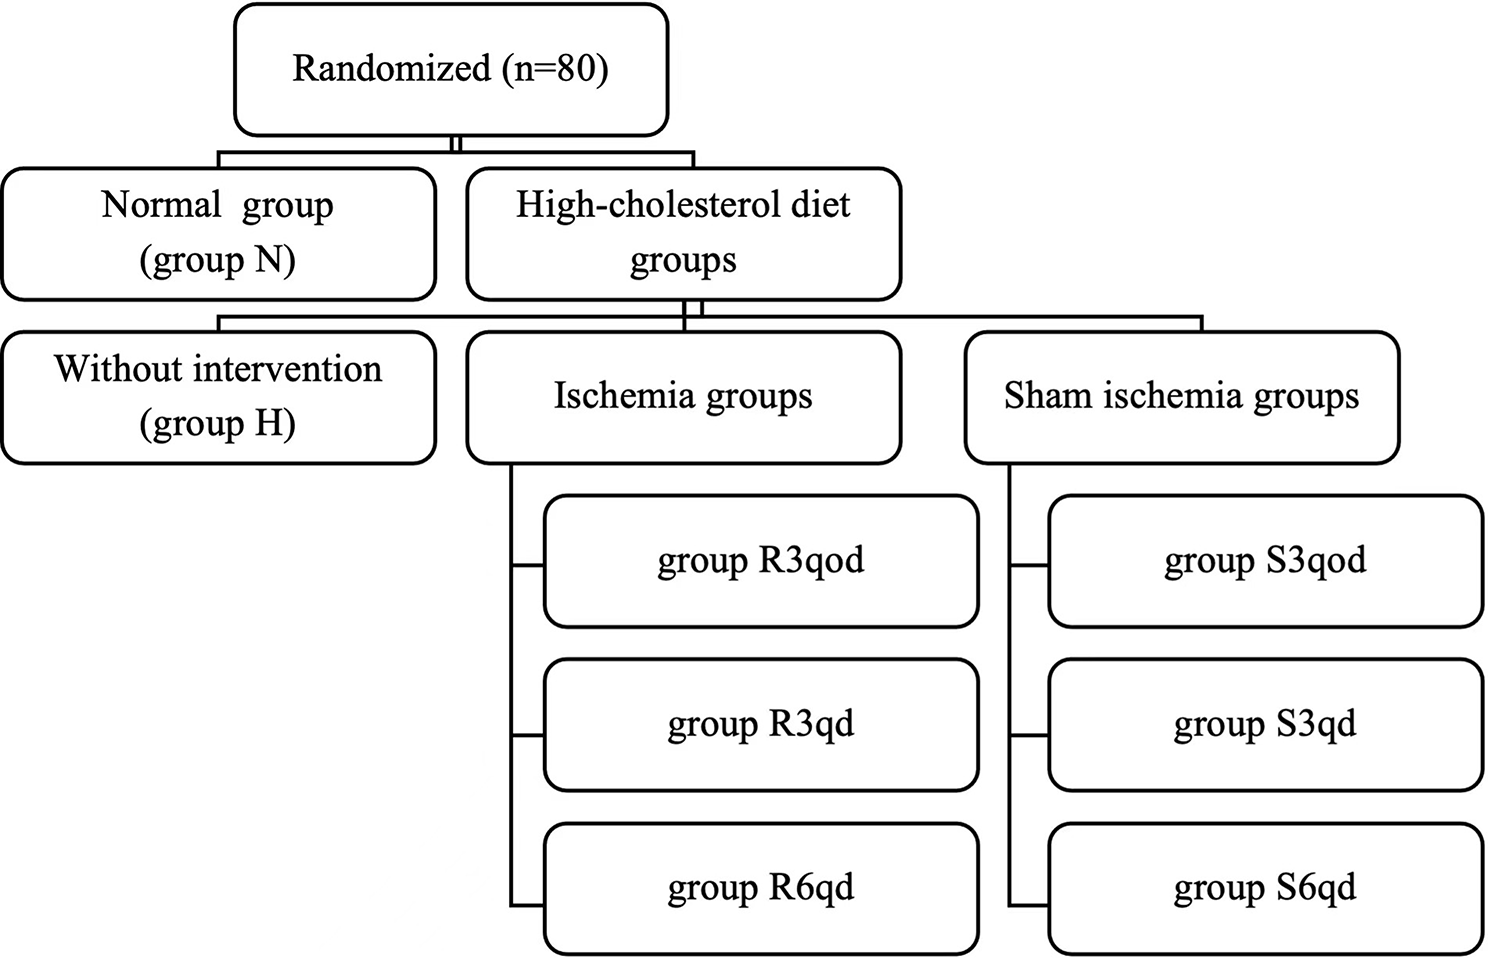
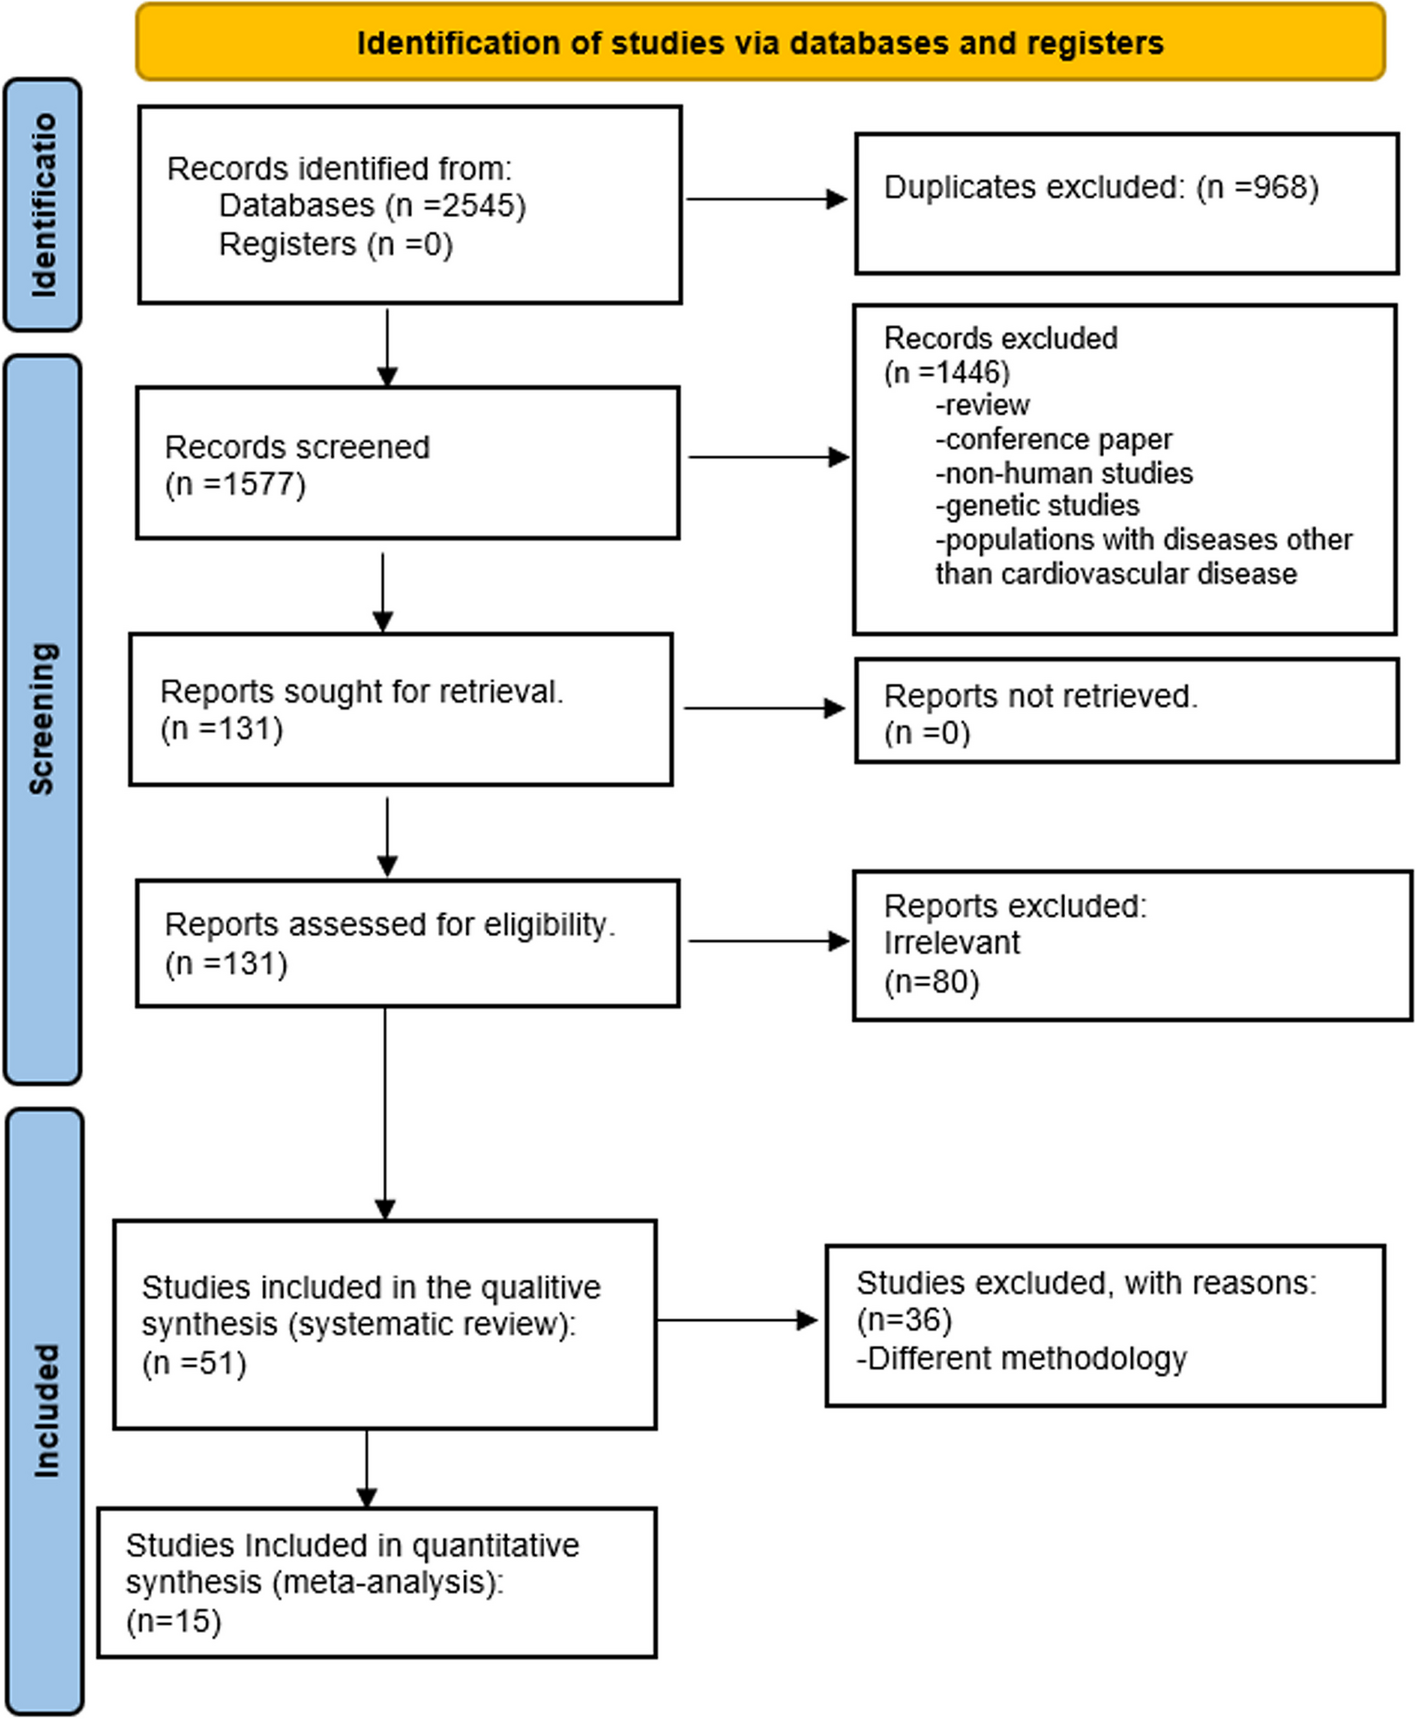
PatientsThe participants were patients with type 2 diabetes mellitus (T2DM) recruited from Shanghai Ruijin Hospital. From January 2010 to May 2018, a total of 1039 consecutive T2DM patients with coronary heart disease received PCI based on drug-eluting stents (Fig. 1). Coronary angiography and PCI for symptomatic patients with stable CAD was performed according to the indication of 2011 AHA guideline [11]. These diabetic patients with CAD received regular medications including statins and aspirin as suggested by guideline [11]. Patients with severe heart failure with left ventricular ejection fraction < 40% (n = 107), acute myocardial infarction (n = 113), renal failure requiring dialysis (n = 23), and tumor or severe acute inflammation (n = 34) were excluded from this study. Patients who were lost to follow-up (n = 43), died during follow-up (n = 57), and had no knowledge of repeat angiography (n = 52) were also excluded from the analysis. Another 47 patients who underwent primary PCI within six months of initial examination were also excluded from the study. The remaining 563 patients constituted the potential study population. These patients had at least one stenosis (lumen diameter stenosis > 20%) on the baseline coronary angiography that were located in the non-PCI interventional vessels and received follow-up angiography approximately one year later.
Fig. 1
Flow chart of patient enrollment
Biochemical assessmentBlood samples were collected after fasting overnight. Serum was separated and stored at − 80 °C before use. Serum lipid levels (triglycerides [TGs], total cholesterol [TC], high density lipoprotein cholesterol [HDL-C], low density lipoprotein cholesterol [LDL-C], apolipoprotein A, apolipoprotein B and lipoprotein [Lp](a)) and glucose levels were measured by a HITACHI 912 automatic biochemistry analyzer (Roche Diagnostics, Germany). We used enzyme-linked immunosorbent assay (ELISA) (Biocheck Laboratory, USA) to detect the levels of serum C-reactive protein (CRP). MPO levels were determined by time-resolved fluorescence lateral flow immunoassay (TRFIA), which adopts the principle of immunochromatography and double antibody sandwich (Eachy biopharma, China). MPO activities were analyzed using a colorimetric assay kit (K744-100, BioVision, USA).
Assessment of plaque progressionCoronary angiography and interventional therapy were performed by the standard Judkins technique or via the radial artery route [12]. Nitroglycerin (100 µg) was routinely injected into the coronary artery to avoid arterial spasm. In the initial and subsequent studies, coronary angiography recorded with the same projection was used for quantitative coronary artery analysis (QCA, Centricity Cardiology CA 1000. v1.0, USA). All images were analyzed by two well-experienced interventional specialists in heart diseases who knew nothing about the clinical data of the patients. The severity of coronary atherosclerosis was defined as single-vessel, double-vessel or triple-vessel disease according to the number of coronary vessels with severe stenosis (luminal stenosis > 50%).
For lesion analysis, end diastolic frames with the same angles were selected from the baseline and follow-up angiograms, which best showed the most severe stenosis, minimal anterior constriction, and branch overlap. The matching arterial segments were defined according to the images acquired from the anatomical positions of the proximal and distal branches. At follow-up, the segments with new lesions in non-PCI arteries and stenosis ≥ 20% at baseline, and all plaques with reference diameters ≥ 1.5 mm were analyzed. All coronary arteries involved in PCI were excluded to avoid including neointimal hyperplasia or restenosis after PCI. We measured the minimum lumen diameter (MLD) in diastole from multiple projections using the outer diameter of the contrast-filled catheter as a calibration. Finally, the results of a single worst view were recorded. The mean value was taken as the reference segment diameter from the 5 mm long, angiographically normal segment between the proximal and distal ends of the lesion but any major lateral branches. Atherosclerotic plaque progression was defined as: ≥ 1 lesion having a reduced MLD ≥ 0.4 mm (from baseline to follow-up angiography), which was approximately twice the SD of lesion repeated measurements [13]. The occurrence of a new coronary artery lesion was defined as no obvious stenosis on the initial angiography or stenosis diameter < 20%, but the reduction of MLD at follow-up angiography was ≥ 0.4 mm [14]. The coronary artery stenosis score (CCSS) was calculated based on the mean MLD of all measured segments in the coronary artery observed in each patient. Cumulative coronary artery occlusion was the sum of all diameter stenosis percentages expressed in standard index units (SI 50% = 0.50) [15]. Baseline QCA measurements minus follow-up measurements were defined as changes in QCA measurements.
Among 563 T2DM patients eligible for plaque progression analysis, 161 patients had plaque progression (plaque progression group). The other 402 patients had no plaque progression. Among these patients with no plaque progression, 87 consecutive patients were randomly referred to as the control (no plaque progression group).
Statistical analysesAll statistical analyses were performed using SPSS for Windows 23.0 (SPSS Inc., Chicago, IL, USA). A 2-tailed P value < 0.05 was considered statistically significant. The Kolmogorov–Smirnov test was used for normal distribution evaluation. If the data were normally distributed, continuous variables were expressed as the mean ± standard deviation (SD); otherwise, they were expressed as the median (25th–75th percentile). Categorical variables are displayed as frequencies (percentages), and the differences between groups were compared by the chi-square test. When statistical calculation of normal distribution was needed, logarithmic transformation was performed for continuous variables of nonnormal distribution. When appropriate, unpaired t test, ANOVA, or nonparametric Mann–Whitney U test were used for intergroup comparisons. Pearson correlation was used to test the relationships between continuous variables, such as MPO level and activity and changes in QCA measurements. Spearman’s correlations were used to evaluate the relationships between continuous variables (such as MPO level and activity) and changes in MLD, stenosis diameter and CCSS. We used multivariable logistic regression models to estimate the independent risk factors for plaque progression.
留言 (0)