
記住我

Conceptualization, O.A., M.K. and A.S.; Methodology, O.A. and A.S.; Formal analysis, O.A., M.M., K.B., J.T. and A.S.; Investigation, O.A.; Data curation, O.A.; Writing—original draft, O.A.; Writing—review & editing, M.M., K.B., M.K., J.T. and A.S.; Visualization, O.A.; Supervision, M.K. and A.S.; Project administration, M.K. All authors have read and agreed to the published version of the manuscript.
Figure 1. The compositional data of the FAs of all phospholipids from investigated liver and lungs (SM = sphingomyelin; PC = phosphatidylcholine; PE = phosphatidylethanolamine; PS = phosphatidylserine; PI= phosphatidylinositol). The FA proportion increases with color intensity, whereas the white color represents FA methyl esters below the detection limit of the GC.
Figure 1. The compositional data of the FAs of all phospholipids from investigated liver and lungs (SM = sphingomyelin; PC = phosphatidylcholine; PE = phosphatidylethanolamine; PS = phosphatidylserine; PI= phosphatidylinositol). The FA proportion increases with color intensity, whereas the white color represents FA methyl esters below the detection limit of the GC.
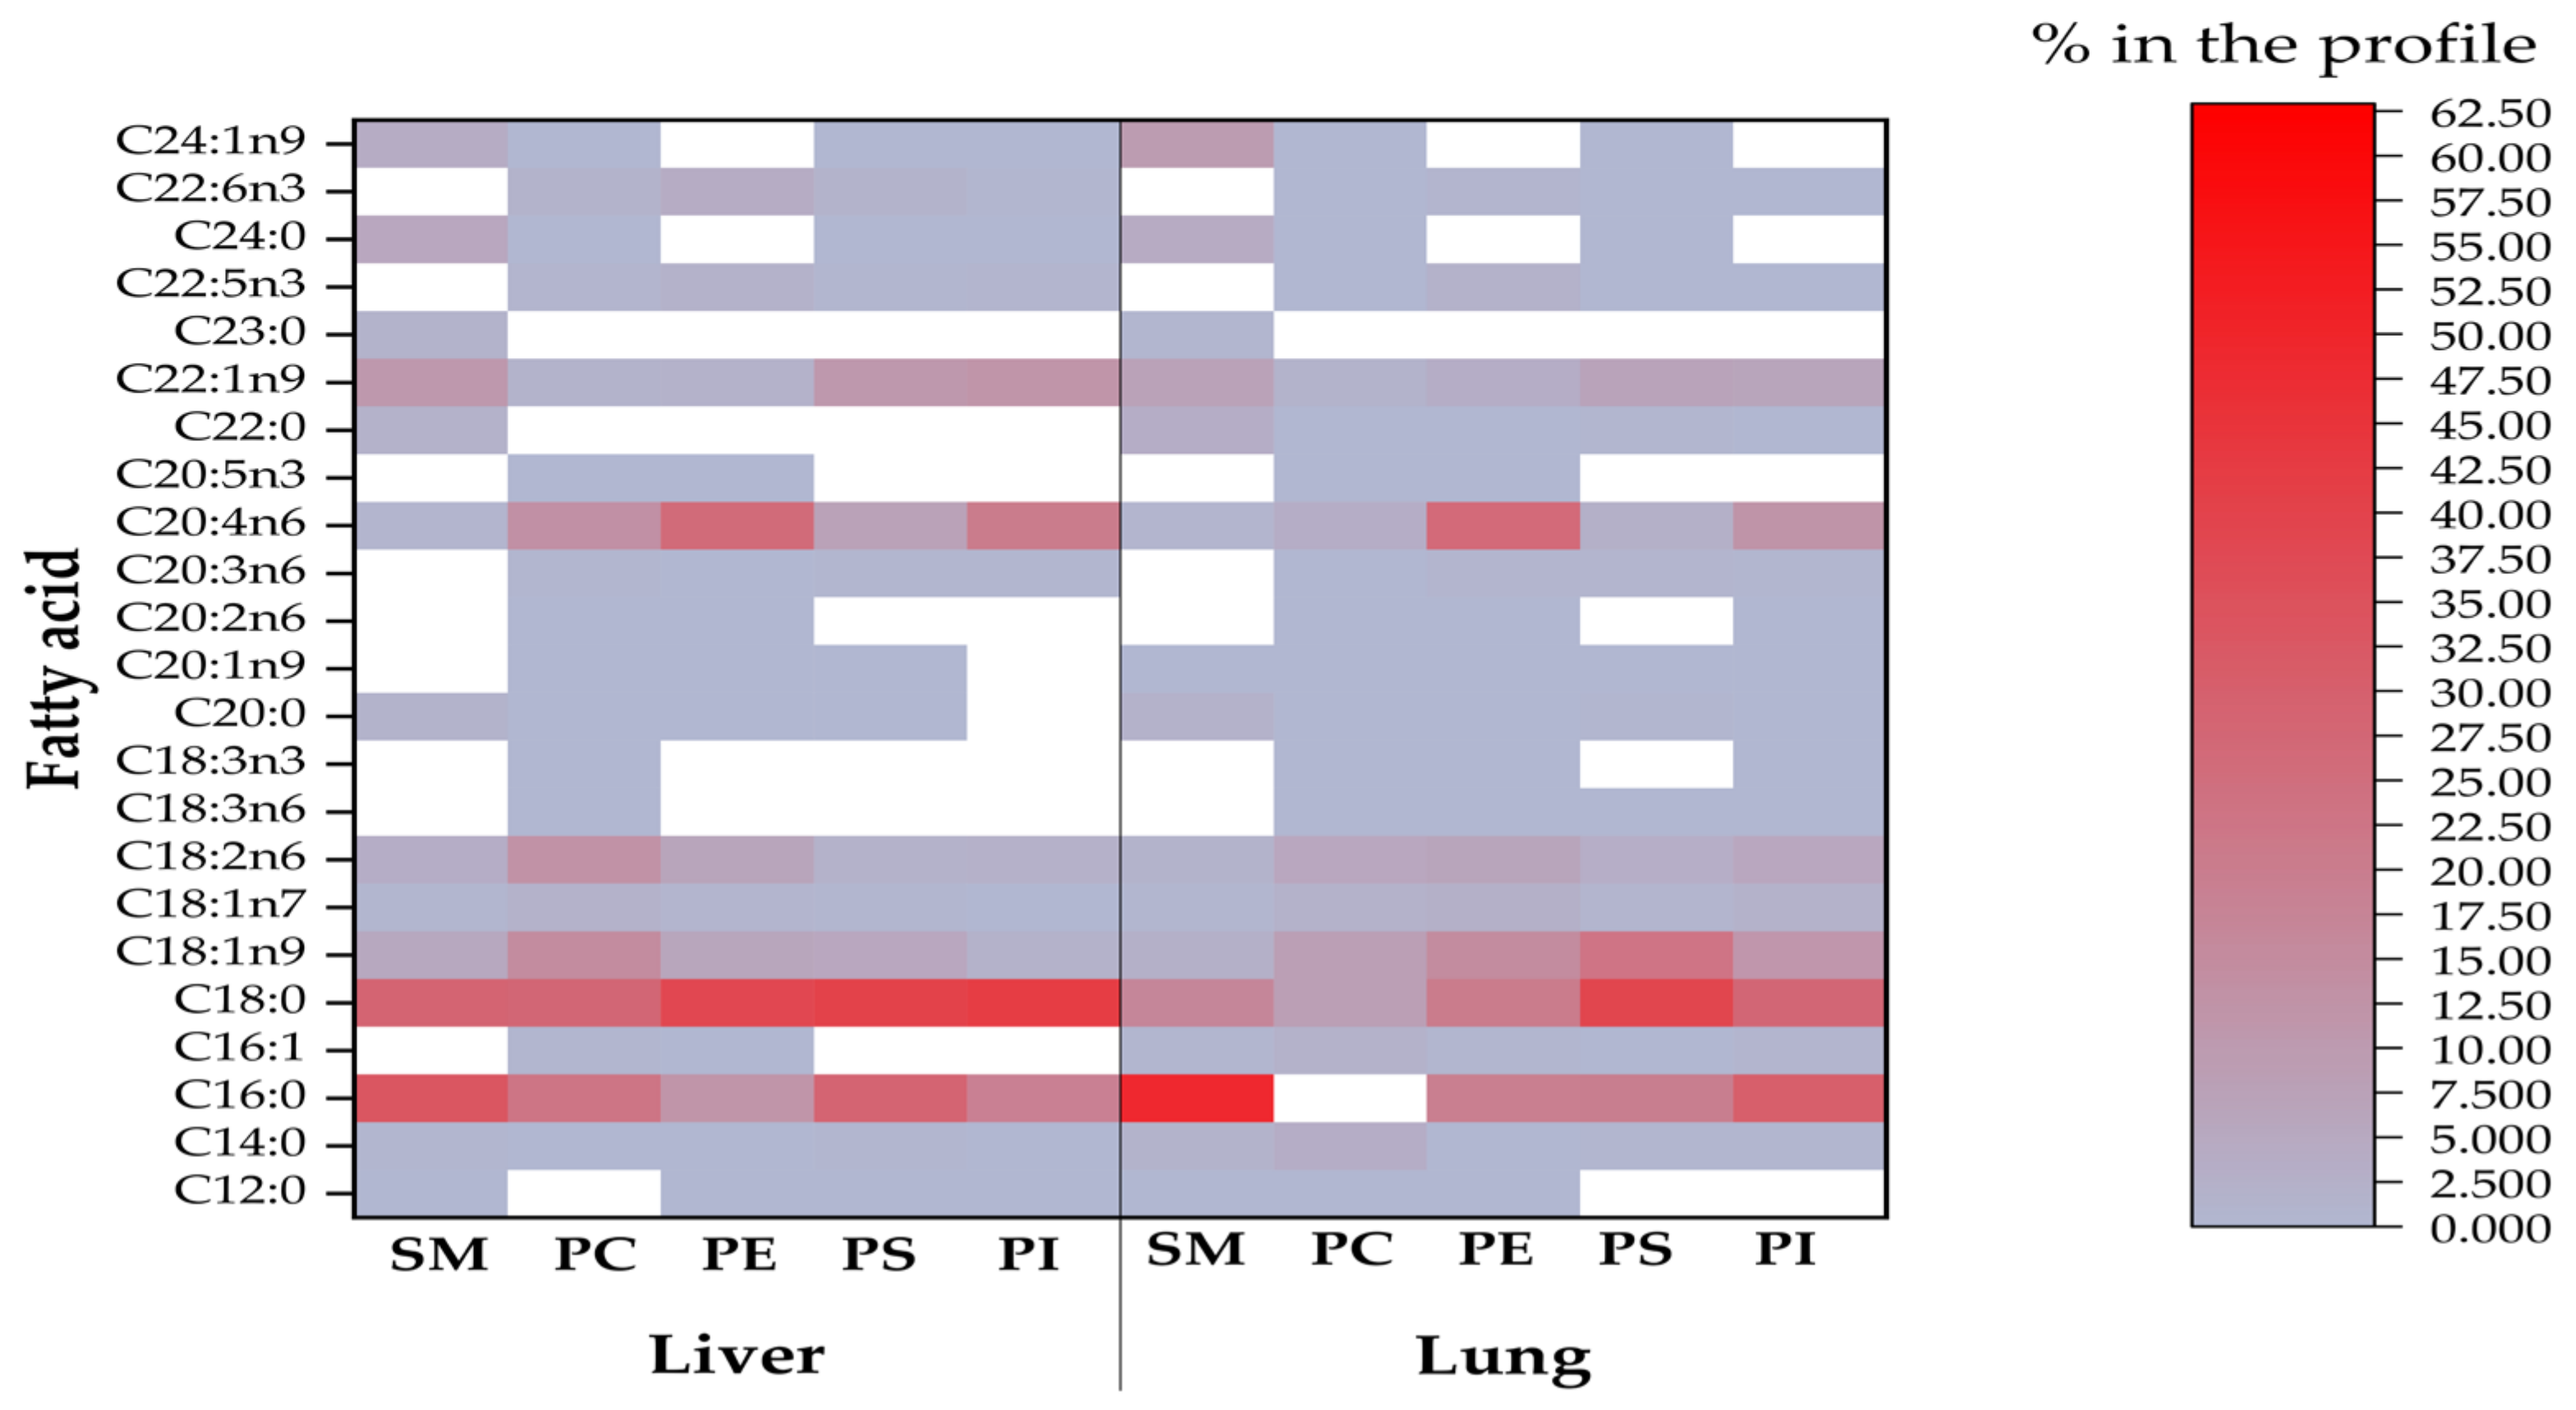
Figure 5. (a) Total lesion scores of liver and lungs recorded in experimental piglets (n = 6 animals/treatment, whereas columns represent means, and bars represent the standard deviation. The letters a, b, c above the bars indicate significant differences). (b) Lung of a healthy pig with mild lymphocytic and histiocytic infiltration in connective tissue (hematoxylin–eosin, 200 ×, scale bar = 20 µm). (c) A healthy piglet liver from control, where the cytoplasm of hepatocytes is finely granulated due to high glycogen content, resulting in an intense stain (hematoxylin–eosin, 200 ×, scale bar = 20 µm), although a PAS stain would be necessary to confirm our observation. (d) The liver of a highly FBs intoxicated piglet (30 mg/kg), where the glycogen content decreased in the hepatocytes’ cytoplasm and a high frequency of necrotic (rounded, faintly stained) hepatocytes (↑) detected (hematoxylin–eosin, 200 ×, scale bar = 20 µm).
Figure 5. (a) Total lesion scores of liver and lungs recorded in experimental piglets (n = 6 animals/treatment, whereas columns represent means, and bars represent the standard deviation. The letters a, b, c above the bars indicate significant differences). (b) Lung of a healthy pig with mild lymphocytic and histiocytic infiltration in connective tissue (hematoxylin–eosin, 200 ×, scale bar = 20 µm). (c) A healthy piglet liver from control, where the cytoplasm of hepatocytes is finely granulated due to high glycogen content, resulting in an intense stain (hematoxylin–eosin, 200 ×, scale bar = 20 µm), although a PAS stain would be necessary to confirm our observation. (d) The liver of a highly FBs intoxicated piglet (30 mg/kg), where the glycogen content decreased in the hepatocytes’ cytoplasm and a high frequency of necrotic (rounded, faintly stained) hepatocytes (↑) detected (hematoxylin–eosin, 200 ×, scale bar = 20 µm).
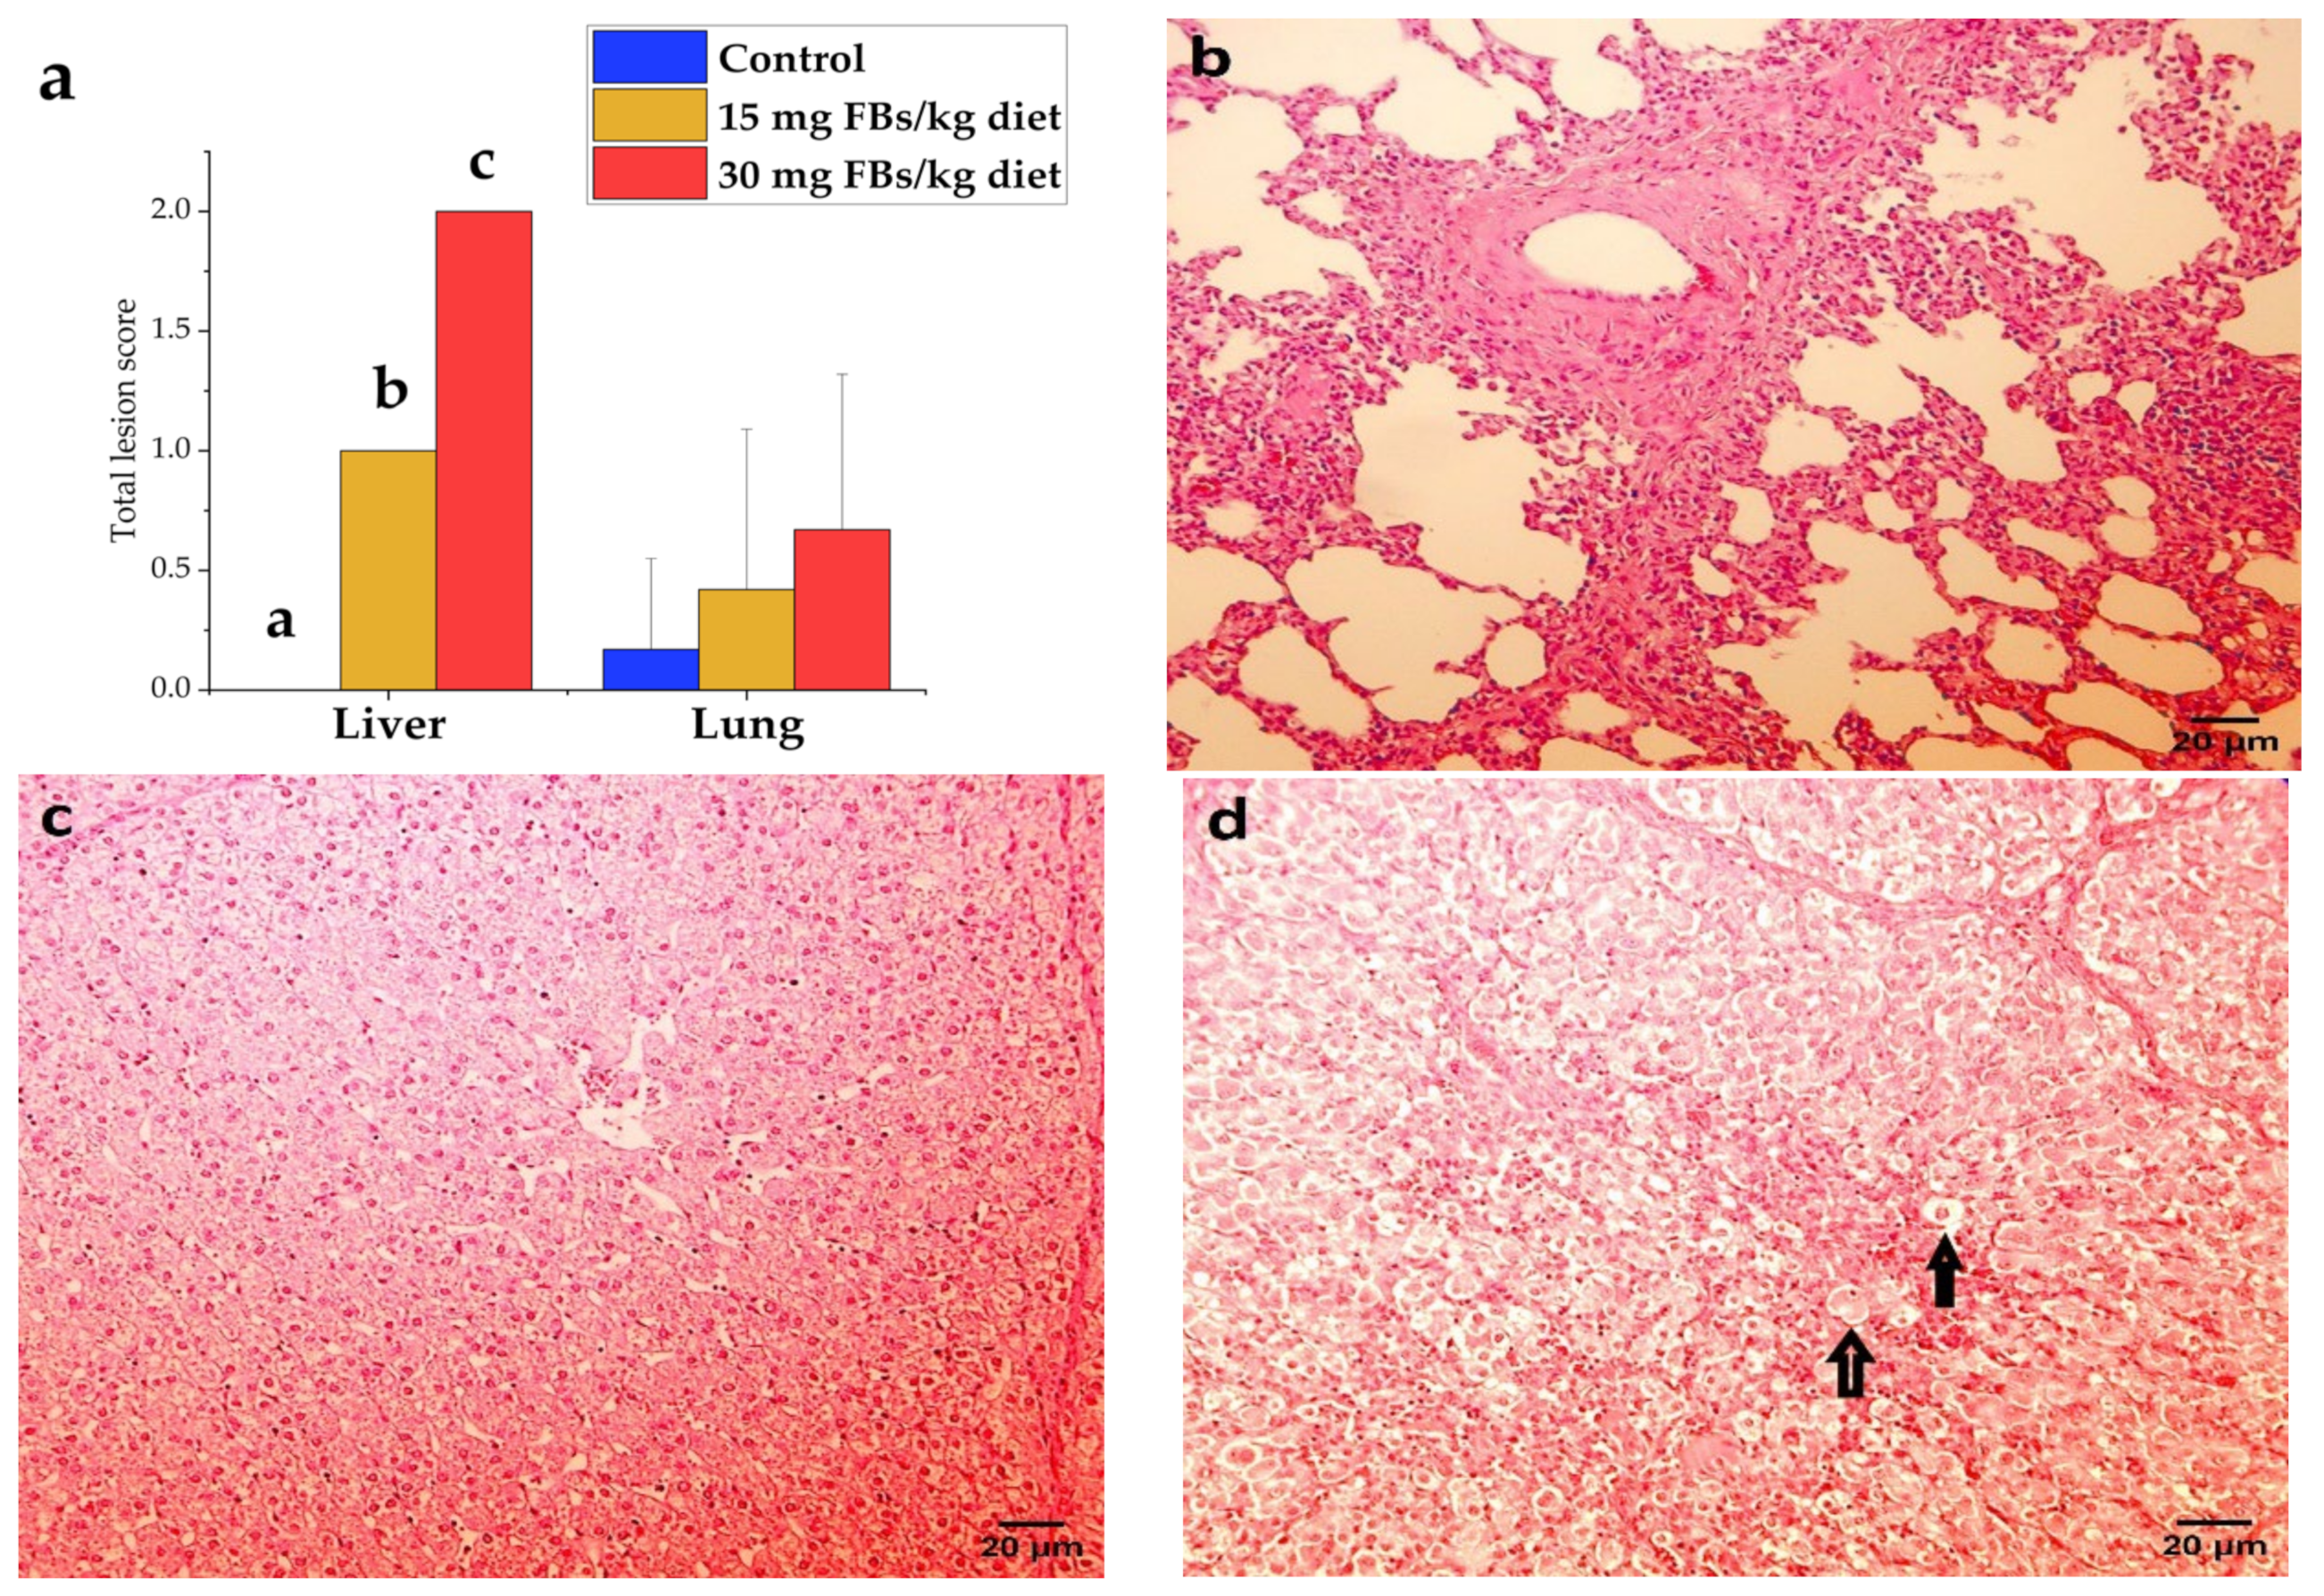
Table 1. The growth performance (in g), absolute and relative organ weights (g and %, respectively), and feed conversion efficiency of piglets (n = 6 animals/treatment). The results represent mean ± standard deviation (SD).
Table 1. The growth performance (in g), absolute and relative organ weights (g and %, respectively), and feed conversion efficiency of piglets (n = 6 animals/treatment). The results represent mean ± standard deviation (SD).
ParameterControl15 mg FBs30 mg FBsInitial body weight12,980 ± 172013,800 ± 120013,800 ± 1080Final body weight21,467 ± 173523,067 ± 1454 23,367 ± 629Body weight gain8483 ± 24069267 ± 22409567 ± 1181Cumulative feed intake19,759 ± 210220,450 ± 135220,382 ± 1353Feed conversion efficiency 2069 ± 2992230 ± 2462455 ± 389Absolute liver weight 527.4 ± 42.1587.2 ± 56.9563.0 ± 69.2Absolute lung weight227.2 ± 45.0237.1 ± 43.0253.0 ± 70.0Relative liver weight (%)2.48 ± 0.382.55 ± 0.232.42 ± 0.45Relative lung weight (%)1.06 ± 0.201.03 ± 0.151.09 ± 0.30Table 2. Fatty acid profiles of sphingomyelins from liver and lungs of the experimental piglets (n = 6 animals/treatment). The results represent mean ± standard deviation (SD).
Table 2. Fatty acid profiles of sphingomyelins from liver and lungs of the experimental piglets (n = 6 animals/treatment). The results represent mean ± standard deviation (SD).
Fatty AcidControl15 mg FBs30 mg FBsControl15 mg FBs 30 mg FBsLiverLungC12:00.06 ± 0.04 a0.09 ± 0.03 ab0.10 ± 0.03 b0.12 ± 0.09 ab0.05 ± 0.05 a0.20 ± 0.03 bC14:00.69 ± 0.080.61 ± 0.160.61 ± 0.151.27 ± 0.34 a1.36 ± 0.56 ab1.96 ± 0.69 bC16:034.7 ± 4.0134.0 ± 3.8730.7 ± 5.2151.3 ± 2.7747.3 ± 3.8747.9 ± 6.09C16:1n7- ± -- ± -- ± -0.34 ± 0.260.59 ± 0.320.60 ± 0.33C18:029.1 ± 5.5330.9 ± 2.0526.3 ± 4.8118.4 ± 1.7316.1 ± 2.8415.5 ± 2.84C18:1n9c5.27 ± 1.914.43 ± 1.715.5 ± 2.462.00 ± 1.292.59 ± 1.163.26 ± 1.45C18:1n70.74 ± 0.350.57 ± 0.210.84 ± 0.340.41 ± 0.280.52 ± 0.280.63 ± 0.33C18:2n63.26 ± 1.582.92 ± 1.223.95 ± 2.270.99 ± 0.711.26 ± 0.701.55 ± 0.87C20:01.53 ± 0.25 b1.46 ± 0.27 b1.09 ± 0.36 a1.91 ± 0.242.20 ± 0.541.90 ± 0.37C20:1n9- ± -- ± -- ± -0.23 ± 0.050.20 ± 0.020.20 ± 0.05C20:4n60.91 ± 0.601.36 ± 0.661.31 ± 0.540.76 ± 0.650.86 ± 0.441.12 ± 0.64C22:01.60 ± 0.23 a1.85 ± 0.27 ab2.20 ± 0.58 b2.95 ± 0.553.74 ± 1.083.38 ± 0.61C22:1n99.49 ± 3.1310.8 ± 3.7611.4 ± 4.375.62 ± 1.55 a6.72 ± 1.1 ab8.97 ± 2.71 bC23:01.42 ± 0.851.44 ± 0.361.73 ± 1.110.57 ± 0.070.73 ± 0.060.67 ± 0.24C24:05.10 ± 3.584.95 ± 1.146.26 ± 2.774.57 ± 0.86 b5.07 ± 1.07 b3.28 ± 0.58 aC24:1n93.77 ± 2.852.81 ± 0.954.71 ± 1.818.80 ± 2.0110.8 ± 2.358.83 ± 2.00saturation72.8 ± 10.9875.3 ± 4.9068.6 ± 7.6581.1 ± 2.75 b76.6 ± 1.24 a74.8 ± 3.39 aunsaturation23.4 ± 3.6522.0 ± 3.7425.7 ± 6.5418.9 ± 2.75 a23.4 ± 1.24 b25.2 ± 3.39 bmonounsaturation19.3 ± 3.8117.7 ± 4.4220.5 ± 7.8117.3 ± 2.36 a21.3 ± 1.51 b22.5 ± 2.89 bpolyunsaturation4.17 ± 1.774.28 ± 1.655.27 ± 2.791.62 ± 1.322.12 ± 1.132.67 ± 1.42n-64.17 ± 1.774.28 ± 1.655.27 ± 2.791.62 ± 1.322.12 ± 1.132.67 ± 1.42odd chain FA1.42 ± 0.851.44 ± 0.361.73 ± 1.110.57 ± 0.070.73 ± 0.060.67 ± 0.24unsaturation index29.4 ± 4.529.0 ± 3.8433.6 ± 6.6521.8 ± 4.80 a27.3 ± 2.50 ab30.1 ± 5.54 baverage chain length17.6 ± 1.5917.9 ± 1.1817.6 ± 1.5218.1 ± 0.2918.5 ± 0.3418.3 ± 0.41Table 3. Fatty acid profile of phosphatidylcholines from liver and lungs of the experimental piglets (n = 6 animals/treatment). The results represent mean ± standard deviation (SD).
Table 3. Fatty acid profile of phosphatidylcholines from liver and lungs of the experimental piglets (n = 6 animals/treatment). The results represent mean ± standard deviation (SD).
Fatty AcidControl15 mg FBs30 mg FBsControl15 mg FBs30 mg FBsLiverLungC12:00.01 ± -- ± -- ± -0.02 ± 0.01 ab0.01 ± 0.00 a0.03 ± 0.01 bC14:00.21 ± 0.02 a0.30 ± 0.10 b0.37 ± 0.05 b2.99 ± 0.68 a3.13 ± 0.41 a4.08 ± 0.65 bC16:022.0 ± 0.8321.8 ± 1.9923.9 ± 2.6861.9 ± 1.28 a66.1 ± 2.93 b61.1 ± 1.58 aC16:1n70.55 ± 0.06 a0.64 ± 0.06 b0.79 ± 0.08 c1.98 ± 0.421.67 ± 0.592.27 ± 0.64C18:028.1 ± 1.84 b28.6 ± 1.51 b26.2 ± 1.67 a9.42 ± 0.88 b9.42 ± 1.34 b7.35 ± 1.12 aC18:1n912.4 ± 1.89 a14.1 ± 1.42 a17.1 ± 1.12 b8.68 ± 0.76 a7.54 ± 1.26 a9.99 ± 0.68 bC18:1n71.96 ± 0.211.90 ± 0.301.95 ± 0.132.31 ± 0.21 b1.75 ± 0.37 a1.93 ± 0.27 aC18:2n613.8 ± 0.96 b14.0 ± 1.36 b12.0 ± 1.04 a5.60 ± 0.31 ab4.73 ± 1.01 a6.21 ± 1.21 bC18:3n60.17 ± 0.040.19 ± 0.030.17 ± 0.020.13 ± 0.04 b0.07 ± 0.02 a0.09 ± 0.03 abC18:3n30.14 ± 0.03 a0.17 ± 0.02 b0.14 ± 0.02 a0.05 ± 0.010.04 ± 0.010.05 ± 0.02C20:00.07 ± 0.010.07 ± 0.020.06 ± 0.010.09 ± 0.030.10 ± 0.040.09 ± 0.01C20:1n90.11 ± 0.020.12 ± 0.030.11 ± 0.030.15 ± 0.100.12 ± 0.030.13 ± 0.05C20:2n60.18 ± 0.060.17 ± 0.050.13 ± 0.020.19 ± 0.05 a0.12 ± 0.05 b0.13 ± 0.02 bC20:3n60.46 ± 0.120.49 ± 0.040.47 ± 0.050.44 ± 0.04 b0.34 ± 0.08 a0.44 ± 0.08 bC20:4n615.2 ± 2.20 b13.7 ± 1.35 ab12.7 ± 2.69 a3.95 ± 0.36 b2.97 ± 0.63 a3.49 ± 0.58 abC20:5n30.26 ± 0.090.29 ± 0.110.22 ± 0.040.05 ± 0.010.05 ± 0.010.05 ± 0.01C22:0- ± -- ± -- ± -0.07 ± 0.020.10 ± 0.040.08 ± 0.02C22:1n91.19 ± 0.471.25 ± 0.671.15 ± 0.411.49 ± 0.17 a1.23 ± 0.37 a2.07 ± 0.41 bC22:5n31.22 ± 0.23 b0.91 ± 0.13 a0.96 ± 0.24 ab0.13 ± 0.02 b0.10 ± 0.03 a0.10 ± 0.02 aC24:00.07 ± 0.030.05 ± 0.040.14 ± 0.060.08 ± 0.02 ab0.14 ± 0.08 b0.06 ± 0.02 aC22:6n31.82 ± 0.601.20 ± 0.241.42 ± 0.690.16 ± 0.03 b0.07 ± 0.04 a0.04 ± 0.02 aC24:1n9- ± -0.06 ± -0.17 ± 0.100.11 ± 0.040.22 ± 0.120.22 ± 0.10saturation50.5 ± 2.1150.9 ± 2.7650.6 ± 4.2574.6 ± 1.76 a79.0 ± 3.77 b72.8 ± 1.58 aunsaturation49.5 ± 2.1149.0 ± 2.7349.4 ± 4.2525.4 ± 1.76 b21.0 ± 3.77 a27.2 ± 1.53 bmonounsaturation16.2 ± 1.99 a18.0 ± 1.83 a21.1 ± 1.03 b14.7 ± 1.15 b12.5 ± 2.18 a16.6 ± 0.57 cpolyunsaturation33.3 ± 3.55 b31.1 ± 2.73 ab28.2 ± 4.23 a10.7 ± 0.69 b8.47 ± 1.75 a10.6 ± 1.30 bn-33.44 ± 0.75 b2.52 ± 0.34 a2.75 ± 0.96 ab0.38 ± 0.04 b0.25 ± 0.03 a0.23 ± 0.03 an-629.9 ± 2.81 b28.6 ± 2.58 ab25.5 ± 3.39 a10.3 ± 0.69 b8.22 ± 1.74 a10.4 ± 1.29 bn-6:n-38.98 ± 1.75 ab11.5 ± 1.49 b9.8 ± 1.92 a27.2 ± 3.91 a33.29 ± 7.33 a44.5 ± 7.01 bunsaturation index124 ± 12.5115 ± 7.94112 ± 16.945.6 ± 3.08 b36.3 ± 6.71 a45.7 ± 3.53 baverage chain length18.0 ± 0.0918.0 ± 0.0617.9 ± 0.1716.8 ± 0.0516.7 ± 0.0816.8 ± 0.08Table 4. Parameters of the linear dose response equations of fatty acids in the different phospholipid classes, obtained from liver and lung. Data represent only cases with R2 above 0.6.
Table 4. Parameters of the linear dose response equations of fatty acids in the different phospholipid classes, obtained from liver and lung. Data represent only cases with R2 above 0.6.
Liver LungParameterSlopeConstantR2ParameterSlopeConstantR2PhosphatidylcholinePhosphatidylcholineC16:1−44.12989.1880.69C22:6n331.164−178.0280.705C18:1n9−44.3574.0730.633n-353.773−133.9460.667monousaturation−53.7043.7100.609n-6:n-3−20.9431.0270.594 Phosphatidylserine C22:040.488−52.09170.782 C24:040.566−134.8940.645Table 5. Fatty acid profile of phosphatidylethanolamines from liver and lungs of the experimental piglets (n = 6 animals/treatment). The results represent mean ± standard deviation (SD).
Table 5. Fatty acid profile of phosphatidylethanolamines from liver and lungs of the experimental piglets (n = 6 animals/treatment). The results represent mean ± standard deviation (SD).
Fatty AcidControl15 mg FBs30 mg FBsControl15 mg FBs30 mg FBsLiverLungC12:00.02 ± 0.000.03 ± 0.010.02 ± 0.000.07 ± 0.03 ab0.03 ± 0.01 a0.09 ± 0.03 bC14:00.14 ± 0.030.14 ± 0.040.12 ± 0.020.30 ± 0.170.36 ± 0.240.40 ± 0.11C16:011.9 ± 1.3311.3 ± 1.5211.5 ± 1.5118.9 ± 2.8519.3 ± 6.0720.2 ± 3.23C16:1n70.16 ± 0.03 a0.20 ± 0.03 b0.20 ± 0.04 b0.41 ± 0.12 a0.56 ± 0.10 ab0.73 ± 0.24 bC18:036.5 ± 1.2437.2 ± 1.9439.4 ± 5.1121.7 ± 1.4919.9 ± 0.7920.7 ± 2.71C18:1n95.49 ± 0.56 a6.27 ± 1.33 ab7.11 ± 1.08 b14.3 ± 0.6615.2 ± 1.0115.3 ± 0.73C18:1n71.06 ± 0.111.00 ± 0.231.01 ± 0.182.57 ± 0.462.72 ± 0.292.70 ± 0.20C18:2n66.72 ± 0.807.19 ± 0.626.33 ± 0.835.47 ± 0.41 a6.31 ± 0.49 a7.36 ± 1.07 bC18:3n6- ± -- ± -- ± -0.21 ± 0.170.19 ± 0.110.07 ± -C18:3n3- ± -- ± -- ± -0.12 ± -0.13 ± 0.060.12 ± 0.03C20:00.09 ± 0.010.07 ± 0.010.06 ± 0.040.16 ± 0.030.13 ± 0.010.16 ± 0.04C20:1n90.15 ± 0.030.14 ± 0.030.12 ± 0.030.40 ± 0.040.39 ± 0.140.42 ± 0.08C20:2n60.15 ± 0.040.11 ± 0.060.09 ± 0.040.17 ± 0.080.19 ± 0.130.16 ± 0.10C20:3n60.33 ± 0.030.36 ± 0.070.33 ± 0.051.05 ± 0.081.21 ± 0.251.19 ± 0.19C20:4n628.3 ± 1.8427.9 ± 1.7526.0 ± 3.0428.3 ± 2.0827.5 ± 3.9424.0 ± 4.69C20:5n30.26 ± 0.08 ab0.36 ± 0.15 b0.17 ± 0.06 a0.23 ± 0.030.33 ± 0.110.28 ± 0.08C22:0- ± -- ± -- ± -0.07 ± 0.01 b0.04 ± 0.01 a0.04 ± 0.01 aC22:1n92.01 ± 0.362.04 ± 0.421.71 ± 0.473.06 ± 0.62 a2.84 ± 0.42 a4.14 ± 1.03 bC22:5n32.29 ± 0.291.94 ± 0.151.90 ± 0.431.76 ± 0.18 ab1.85 ± 0.41 b1.48 ± 0.24 aC22:6n34.46 ± 0.903.70 ± 0.883.65 ± 0.901.01 ± 0.331.01 ± 0.360.73 ± 0.34saturation48.6 ± 1.6548.8 ± 2.4451.0 ± 6.4041.2 ± 1.9839.7 ± 5.7541.6 ± 5.00unsaturation51.4 ± 1.6551.2 ± 2.4548.5 ± 6.0258.8 ± 1.9860.3 ± 5.7558.4 ± 5.00monounsaturation8.87 ± 0.759.65 ± 1.869.91 ± 1.2320.69 ± 0.51 a21.7 ± 1.20 ab23.24 ± 1.76 bpolyunsaturation42.5 ± 2.0741.6 ± 2.4438.5 ± 4.8938.1 ± 1.9438.5 ± 4.7835.2 ± 4.07n-37.01 ± 0.57 b6.00 ± 0.83 ab5.73 ± 1.03 a3.02 ± 0.253.23 ± 0.512.53 ± 0.33n-635.5 ± 1.6335.6 ± 1.7632.8 ± 4.0235.1 ± 1.8935.3 ± 4.4132.7 ± 3.85n-6:n-35.08 ± 0.30 a6.01 ± 0.67 b5.69 ± 0.56 ab11.7 ± 1.09 ab11.0 ± 1.25 a13.0 ± 1.36 bunsaturation index176 ± 9.69171 ± 10.1160 ± 21.1156 ± 8.56156 ± 17.9144 ± 18.1average chain length18.8 ± 0.17 b18.7 ± 0.18 ab
留言 (0)