
記住我

The institutional review boards of two institutions, Site 1 (The First Affiliated Hospital of Soochow University) and Site 2 (Sun Yat-sen University Cancer Center) approved this retrospective study and waived the requirement for written informed consent.
PatientsBetween March 2016 and September 2022, 235 patients with a pathologic diagnosis of IMCC were retrospectively identified through electronic medical records. Those who met the following inclusion criteria were selected: (1) patients with a pathologically confirmed IMCC (2) those with positive immunohistochemical Ki-67 expression results based on surgical resection (n = 212) or percutaneous biopsy (n = 23) (3) gadolinium-ethoxybenzyl-diethylenetriamine penta acetic acid (Gd‐EOB‐DTPA) enhanced MRI performed within 2 weeks before surgery. Exclusion criteria was: (1) No Gd-EOB-DTPA enhanced MRI (2) No Ki-67 expression results (3) poor image quality. Figure 1 depicted the patient selection and grouping process.
Fig. 1
Study flow chart of the training and validation cohorts. IMCC Intrahepatic mass cholangiocarcinoma; Gd‐EOB‐DTPA gadolinium-ethoxybenzyl-diethylenetriamine pentaacetic acid
Clinical dataInformation about chronic hepatitis, cirrhosis, Child–Pugh score, schistosomiasis, alpha-fetoprotein (AFP), carcinoembryonic antigen (CEA), carbohydrate antigen 19–9 (CA19-9) were obtained through the electronic medical records system.
Histopathological analysisThe histopathological examination was performed by two experienced pathologists who were blinded to radiological and clinical results. Immunohistochemical staining was used to ensure Ki-67 expression. Ten fields of view were selected under high magnification (× 400), and 100 cells were counted in each field of view (in the hot spots within the tumor). Positive Ki-67 expression was the presence of tan (yellow) colored particles in the nucleus. The labeling index of Ki-67 expression was evaluated by the positive percentage in total cells. According to the index of Ki-67 expression, immunoreactive cells were divided into the low (< 30% immunoreactivity) and high-expression groups (≥ 30% immunoreactivity) [15] (Fig. 2C, F).
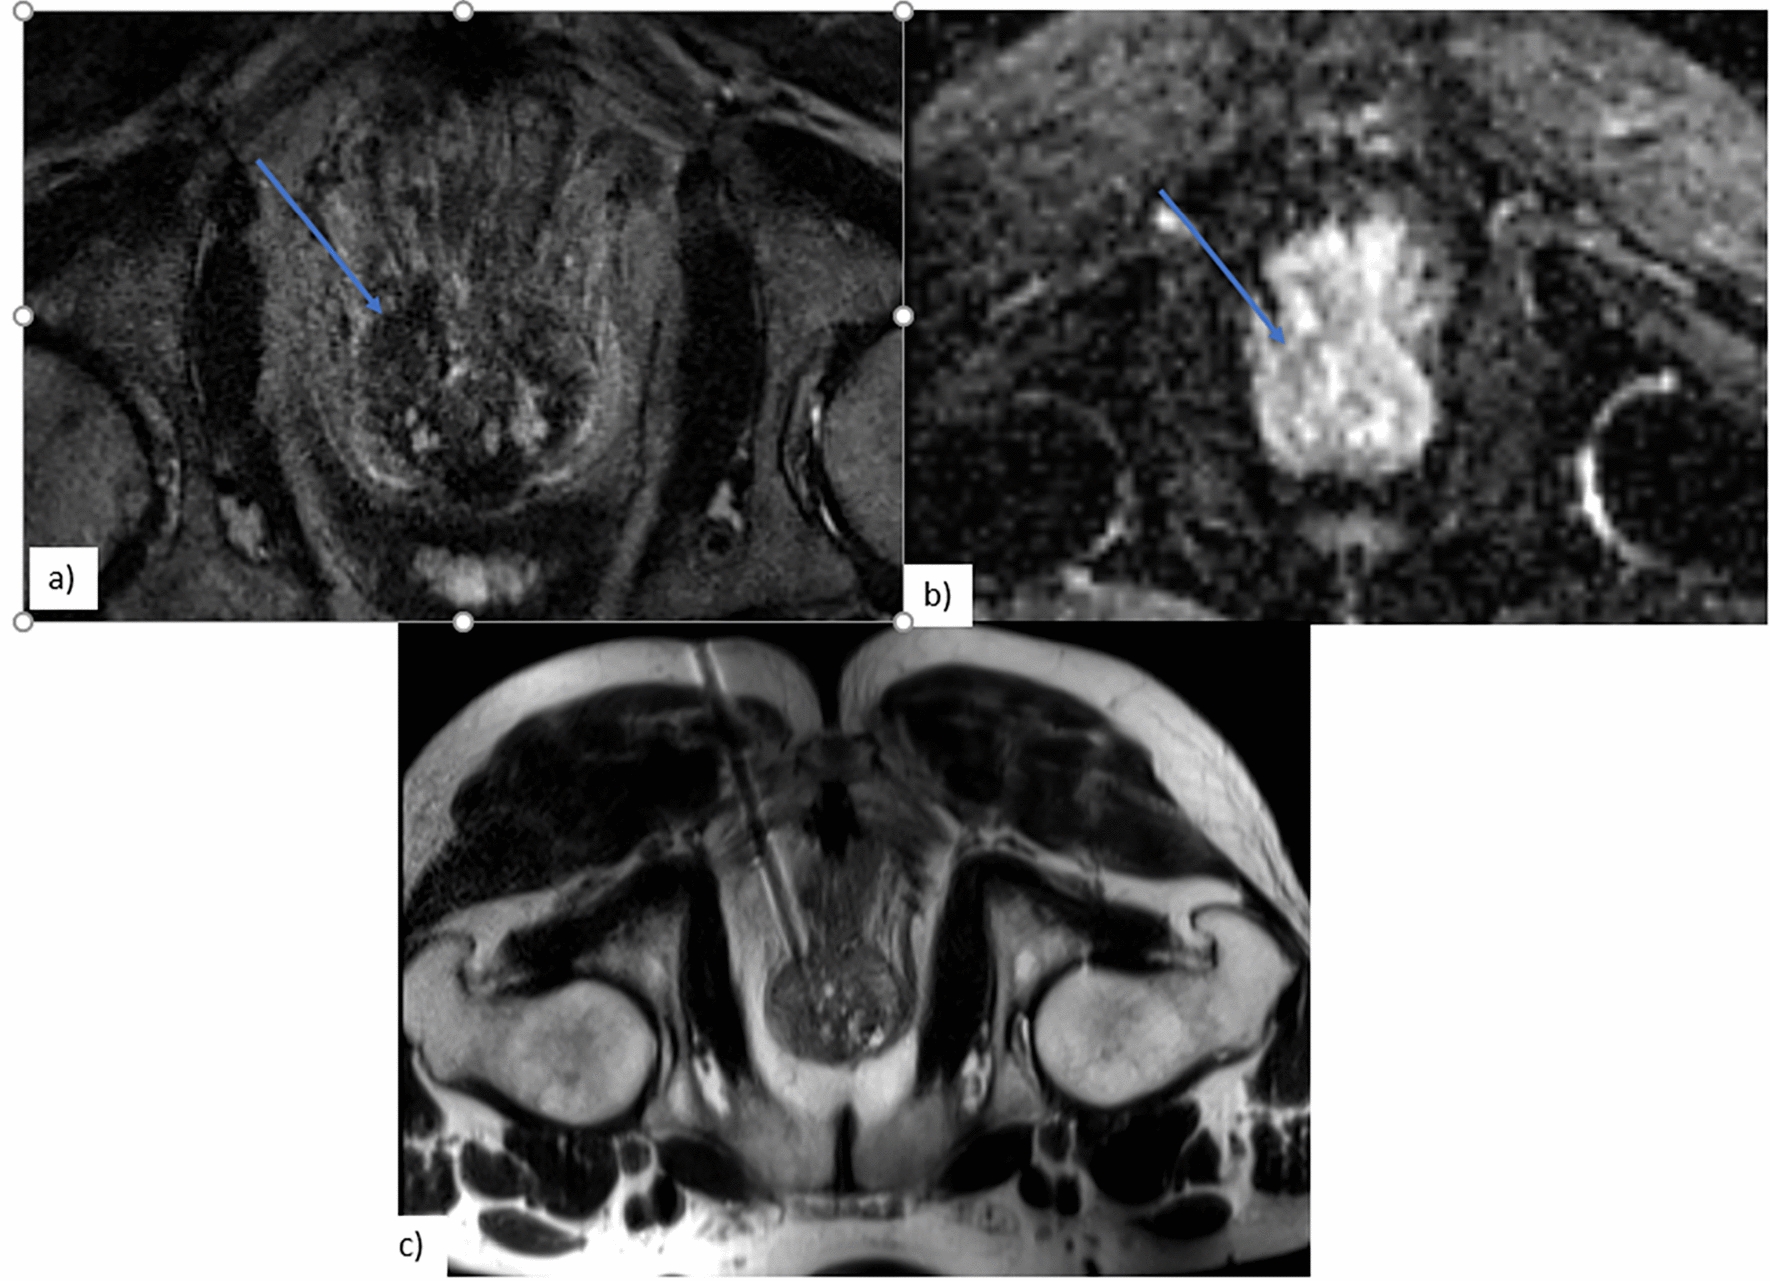
Fig. 2
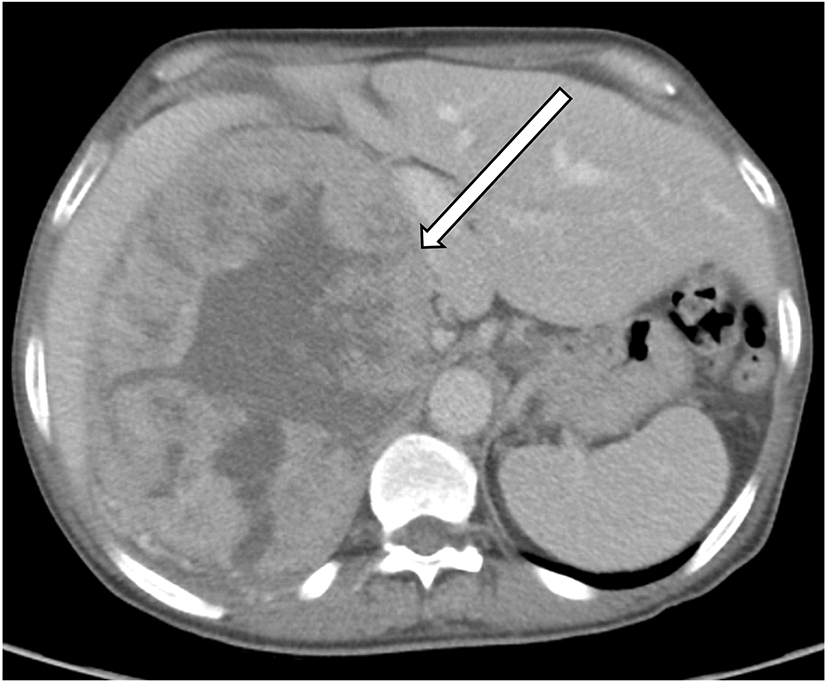
MRI images and pathological control. (A–C) A 67 years old female patient with low Ki-67 expression (about 15%). A Cloud sign on HBP; B diffusely hyperintense on DWI; C histologic variations (immunohistochemical staining, × 200-fold). (D–F) A 71 years old female patient with high Ki-67 expression (about 45%). D partially hyperintense on HBP; E target sign on DWI; F histologic variations (immunohistochemical staining, × 200-fold)
MRI protocolBecause of the retrospective nature of the study, a variety of MR imaging units were used, including 3.0 T MRIs (Siemens Magnetom Verio 3.0 T; Siemens Magnetom Skyra 3.0 T; GE Signa HDxt 3.0 T) with a dedicated phased-array body coil. The scan sequence included: in-phase and out-of-phase T1 weighted imaging; T2 weighted fat-suppression turbo spin-echo sequence;diffusion-weighted imaging (DWI), ADC maps, and dynamic 3D T1WI contrast-enhanced imaging. All pulse sequence parameters are shown in Supplementary Appendix 1.
Image analysisQualitative MRI analysisAll MRI examinations were evaluated in consensus by two senior radiologists (observer 1 and observer 2, both with 9 years of experience in abdominal MRI). In case of disagreement, a consensus was reached by discussion. All images were evaluated by a picture archiving and communication system (Neusoft PACS/RIS V5.5), and both radiologists were blind to clinical, laboratory, and pathological information. The largest lesion was evaluated when multiple lesions were present in the liver. The qualitative features of MRI mainly included signal intensity of T1-weighted imaging (T1WI), T2-weighted imaging (T2WI), diffusion-weighted imaging (DWI), arterial phase enhancement pattern, dynamic enhancement pattern, HBP enhancement pattern, morphological and auxiliary features. T1WI and T2WI were divided into hypointensity, isointensity, and hyperintensity. The signal intensity of the lesion on T1WI and the T2WI was the signal of maximum level compared with the surrounding normal liver parenchyma (visual observation). DWI included: (1) diffusely hyperintense: areas of hyperintense in more than one-third of the tumor; (2) target sign: areas of hyperintense restriction in less than one-third of the tumor (Fig. 2B, E) [16]. Arterial phase enhancement patterns included: (1) peripherally hyperintense: < 10% of the largest tumor diameter is hyperintense; (2) partially hyperintense: 10–70% of the largest tumor diameter is hyperintense; (3) diffusely hyperintense: more than 70% of the largest tumor diameter is hyperintense (Supplementary Fig. 1A–C) [7]. Dynamic enhancement patterns mainly included three types: (1) progressive CE (contrast enhancement): the nodule is enhanced progressively over time, reaching maximal intensity in delayed phases; (2) stable, persistent CE: the nodule enhancement remains invariable through the AP and EP; (3) washout, intense contrast uptake during the AP followed by contrast washout in delayed phases. The hepatobiliary phase (HBP) enhancement pattern was divided into three types: (1) cloud sign: a central hyperintense area with a peripheral hypointense rim defect, > 90% of the largest tumor diameter is hyperintense; (2) partially hyperintense: 10–90% of the largest tumor diameter is hyperintense (Supplementary Fig. 1D–F); (3) peripherally hyperintense: < 10% of the largest tumor diameter is hyperintense. Auxiliary signs included: (1) halo signs, defined as peripherally hyperintense around lesions in the arterial phase; (2) peritumoral hypointense on HBP enhancement pattern, defined as low signal around the lesion on HBP; (3) abnormal perfusion, defined as irregularly abnormal hyperintense around the lesions or other parts on arterial phase.
Quantitative MRI analysisQuantitative analysis was performed by two radiologists using MicroDicom (3.9.5.666). The quantitative analysis of MRI mainly included diameter, ADC value, and the signal ratio of lesion-liver parenchyma on HBP (SIR-HBP). The diameter was measured by each radiologist at the maximum axial image on HBP. Regions of interest (ROIs) computed the signal intensity (SI) on ADC, including almost the entire area of the homogeneous part of the tumor, avoiding the outermost part to exclude a partial volume effect of adjacent normal liver tissue. ROIs in the normal liver parenchyma selected a size of > 1 cm2. ADCmean values of the lesions were calculated using monoexponential fitting of the SI decay curve with the following formula using two b values: ADC = ln (S2/S1)/(b1-b2), where S1 and S2 were the signal intensities at b values b1 0 or 50 and b2 800 s/mm2, respectively. Normalized ADC values for ADCmean were calculated using ADC values of liver parenchyma as reference tissue. A normalized ADC (nADC) was defined relative to the liver parenchyma as the ratio ADCtumor/ADCliver [17, 18]. Regions of interest (ROIs) were measured maximal cross-sectional area of the lesions and at the adjacent upper, and lower level on the HBP axial image, and then the average SIR-HBP was taken. The same method was used to measure the normal live parenchymal signal intensity. The size and position of each ROI were consistent, and bile ducts, blood vessels, bleeding, cysts, and necrosis were avoided. ROIs of the lesions were measured 3 times and the average was recorded. Based on these quantitative measurements, the signal ratio of lesion-liver parenchyma on HBP (SIR-HBP) was defined as follows: HBP (SIR-HBP) = SIlesion/SIliver.
Statistical analysisThe inter reader agreement for any of the qualitative MRI features was assessed by the kappa statistic. The value of kappa statistic > 0.75 indicated good consistency. The intraclass correlation coefficients (ICCs) were used to assess the agreement of diameter, ADC, and SIR-HBP by two radiologists. An ICC > 0.75 indicated good consistency. The Independent t-test or Mann–Whitney U test was used for the continuous variables, and either the χ2 test or Fisher exact test was used for categorical variables when appropriate. Significant variables (P < 0.05) in univariate analysis for predicting Ki-67 expression were used as covariates in multivariate logistic regression analysis for establishing a clinical model, MRI model, and combined model, respectively. The Delong test was applied to compare the area under the curve (AUC) between different models. The predictive performances were validated by receiver operating characteristic curve (ROC) analysis, calibration curve, and decision curve analysis (DCA). Based on the AUC comparison results, the nomograph of the optimal model for predicting Ki-67 expression was constructed. For the validation cohort, the area under curve (AUC) and calibration curve were used to validate. A P value of < 0.05 were considered to be statistically significant. ROC analysis was performed by SPSS Statistics version 26.0 and Delong test by MedCalc Statistical Software version 20.0. the "rms" "DecisionCurve" packages in the R software version 4.1.2.
留言 (0)