
記住我

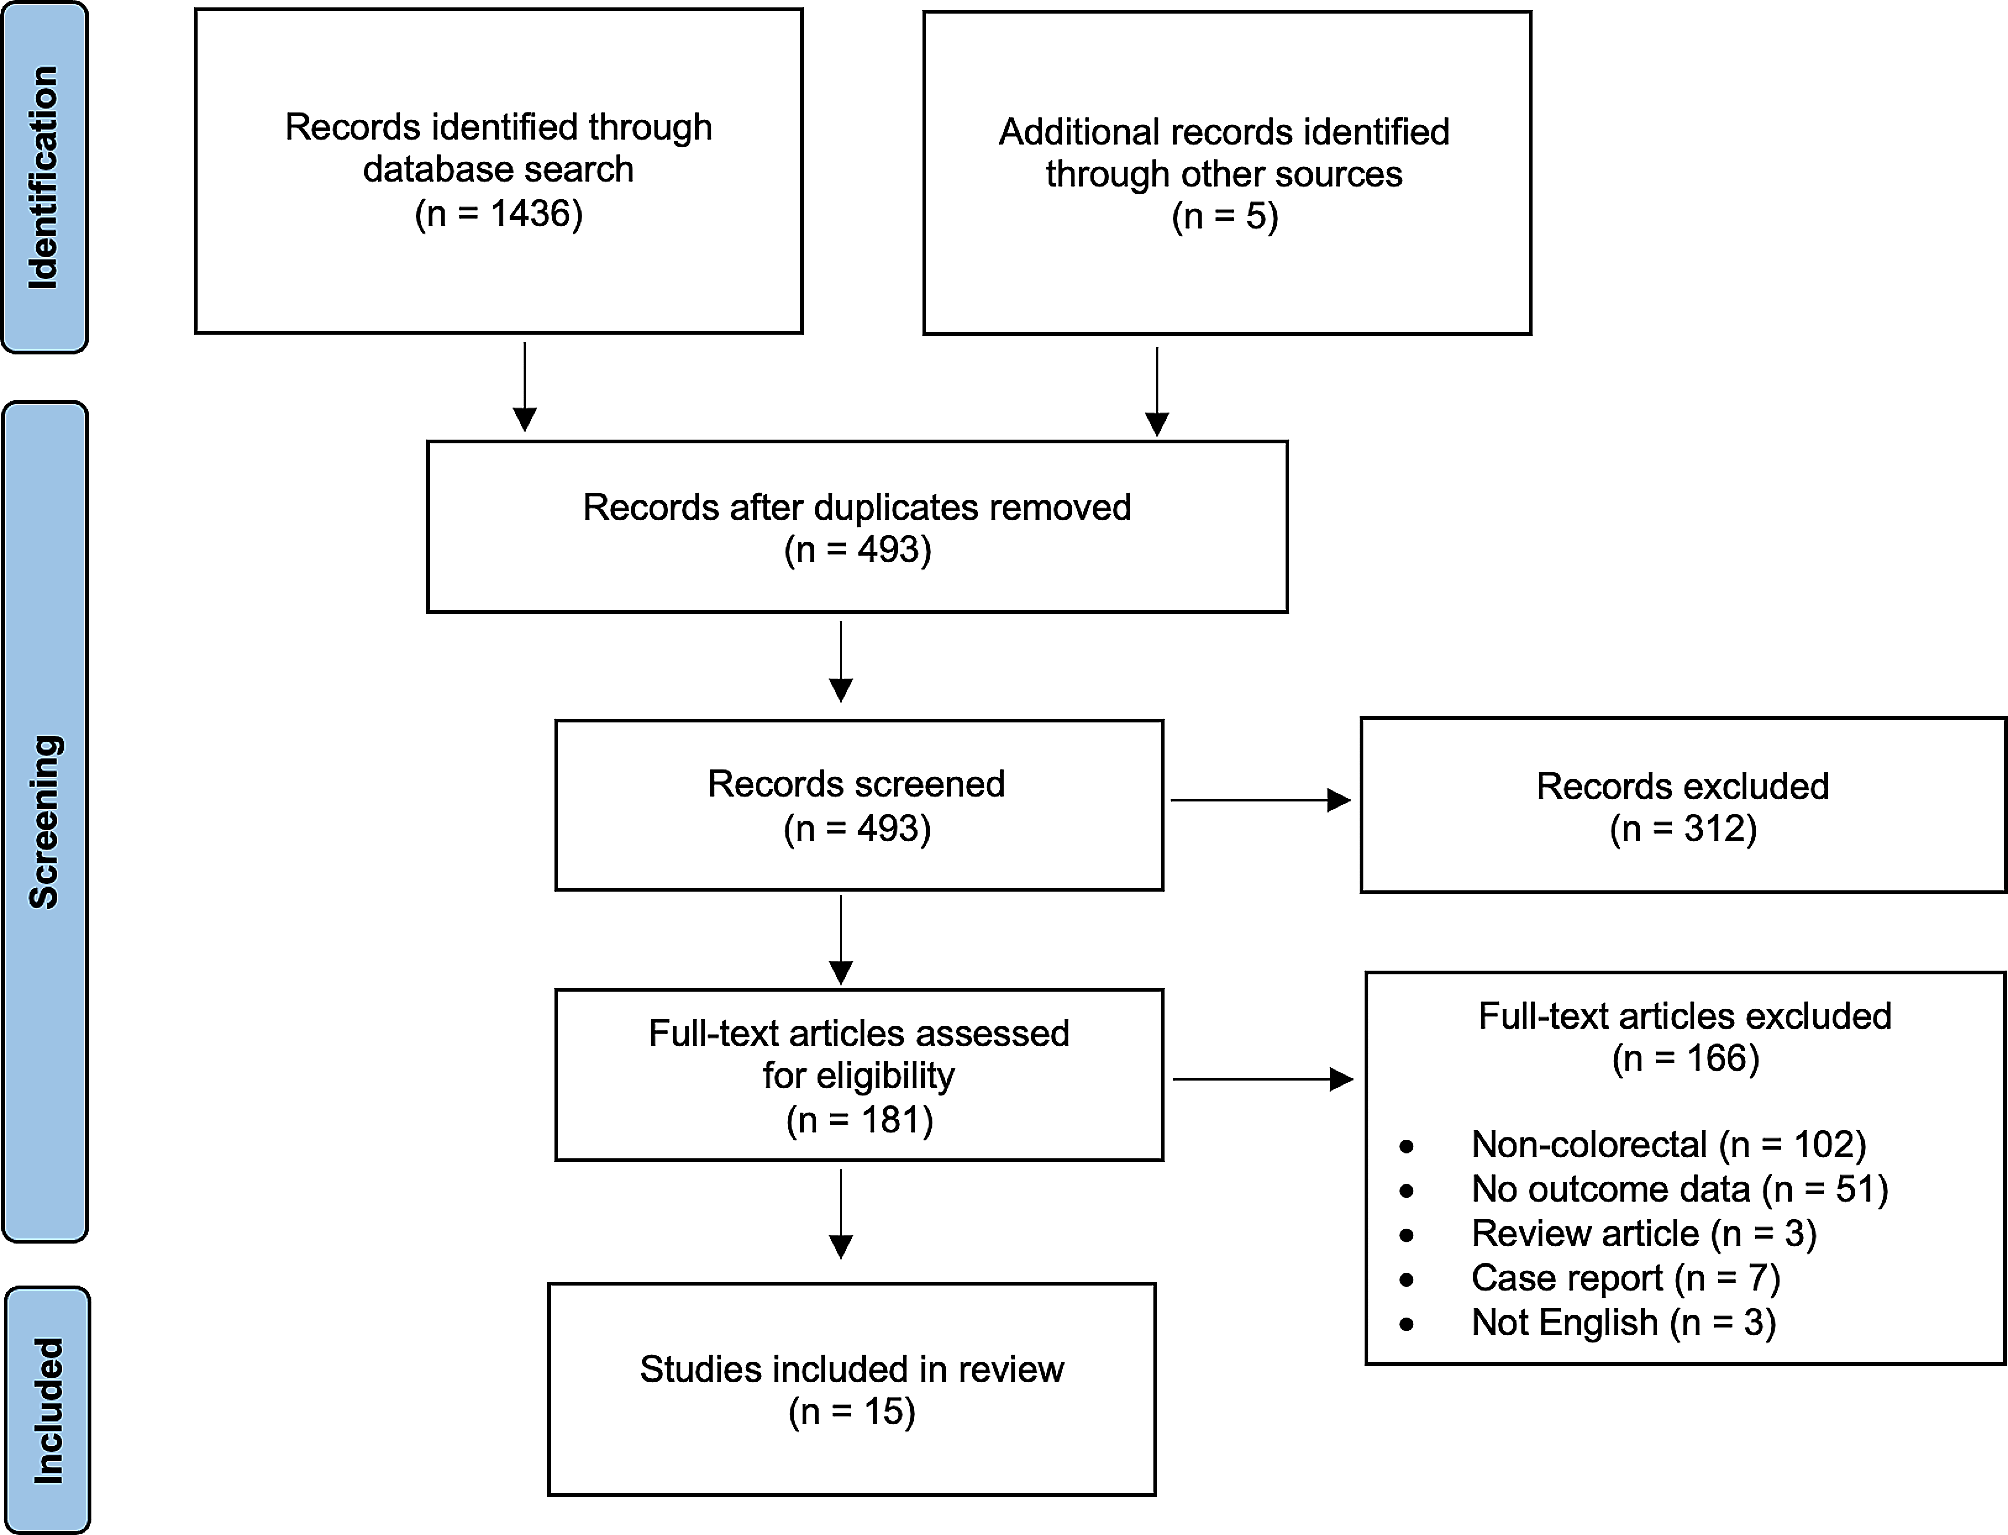


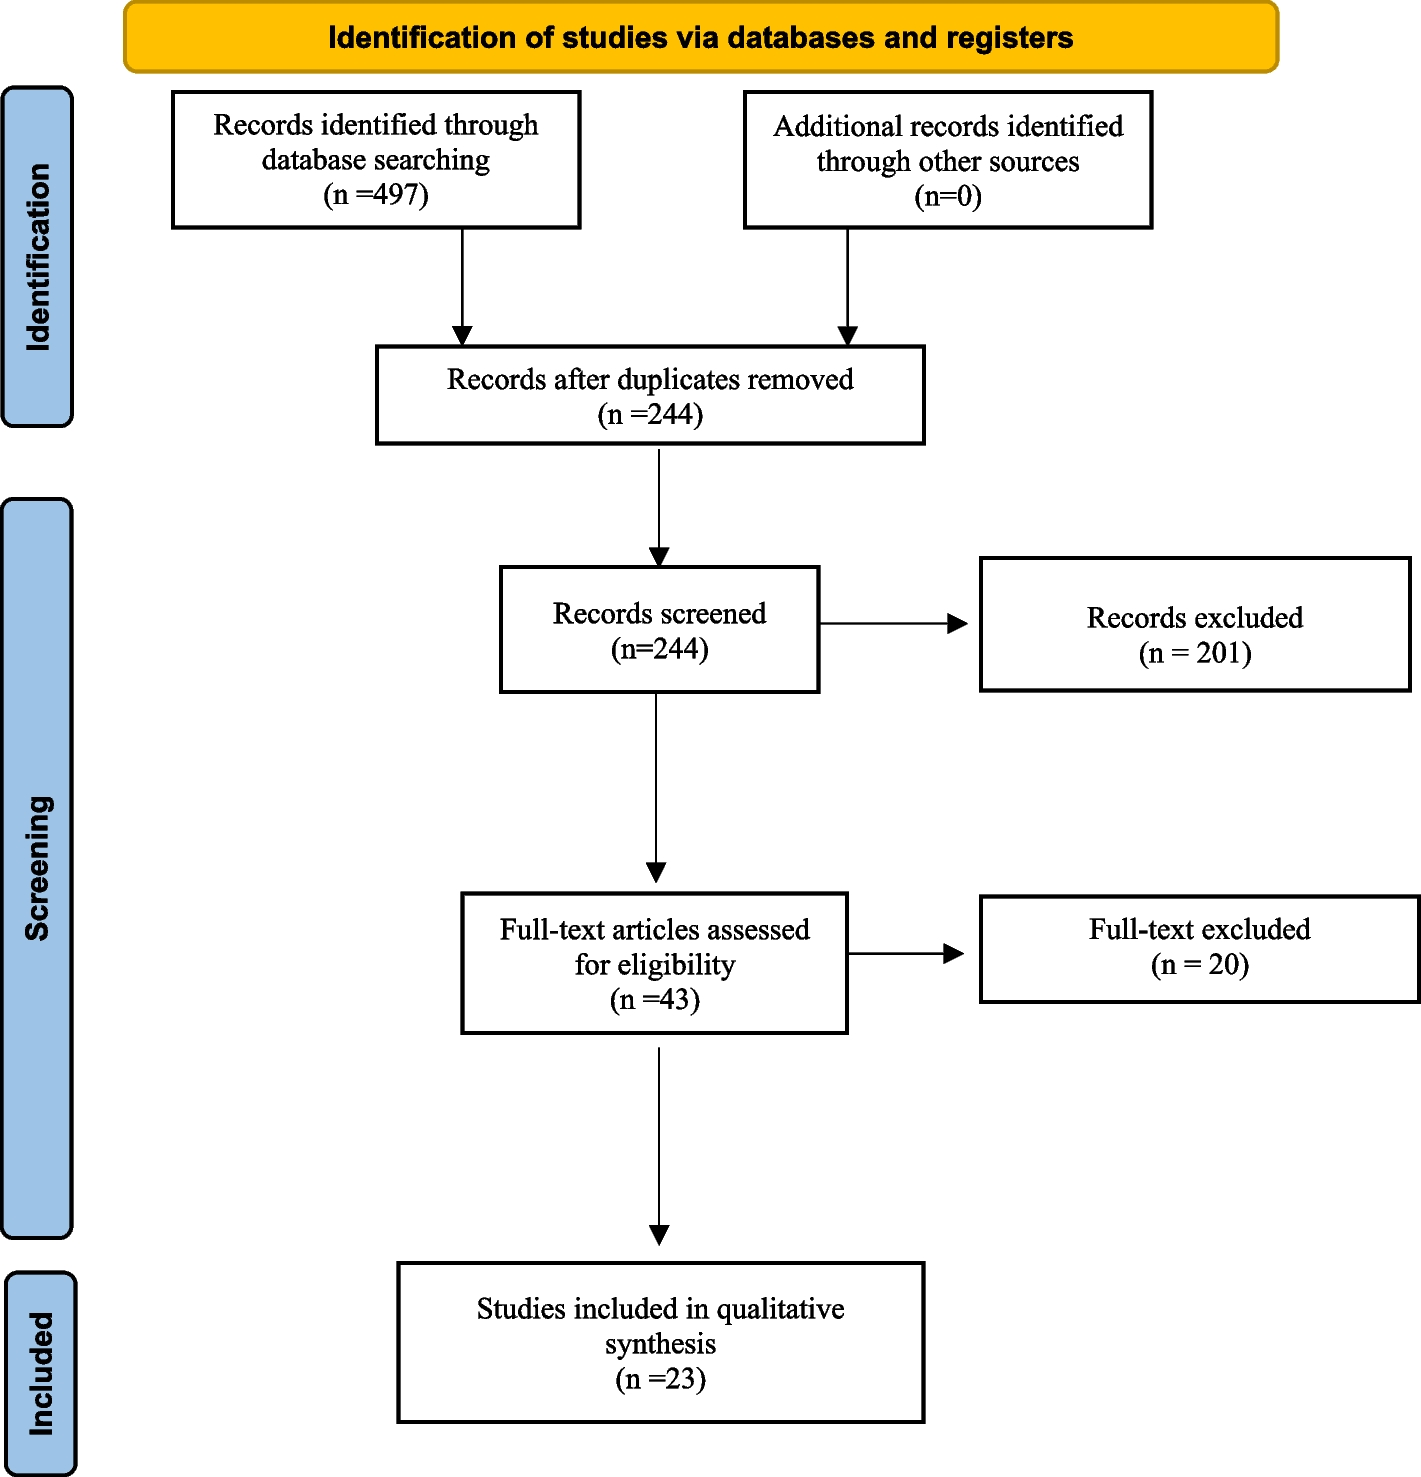
A total of 62 articles were retrieved by searching electronic databases and manually searching the relevant reference lists. After duplicates were identified and excluded, 35 articles remained. We then excluded unrelated reviews, case reports, unrelated systematic reviews, and meta-analyses, as well as studies that were clearly irrelevant based on their title or abstract. Nine articles remained. The detailed steps of the literature search are shown in Fig. 1. Nine studies with a total of 681 patients were included in the final analysis. In total, 304 patients (44.6%) received EH, and 377 (55.4%) patients received DH. The characteristics of these studies are presented in Table 1. The clinical characteristics and postoperative clinical outcomes of the two groups included in the study are summarized in Table 2.
Fig. 1
Flow diagram of the literature search process according to PRISMA 2009
Table 1 Basic characteristics and quality assessment of the enrolled studiesTable 2 Clinical characteristics and postoperative clinical outcomes of the two groups included in the studyMeta-analysis resultsSeven postoperative outcomes of patients who underwent EH and DH for the treatment of SR-HCC were analyzed in this meta-analysis, as shown in Table 3. Overall survival (OS) was defined as the interval between the date of surgery and the date of the patient’s death or the end of follow-up. Common complications of hepatectomy, defined by the Clavien-Dindo complication grading system, were extracted for analysis. Recurrence and peritoneal metastasis were judged on the basis of tumor markers such as alpha-fetoprotein (AFP), and imaging data such as computed tomography (CT) and magnetic resonance imaging (MRI).
Table 3 Meta-analysis results of all available studies with measured outcomesIn-hospital mortalityIn-hospital mortality was reported in 8 studies [5, 6, 8,9,10,11,12,13]. Low heterogeneity was observed among these studies (I2= 0%, p = 0.64). The random-effect model was applied, and the combined effect was RR = 2.17, 95% CI 1.03–4.57, p = 0.04. The in-hospital mortality in the EH group was significantly higher than that in the DH group (Fig. 2A).
Fig. 2
Forest plots of A in-hospital mortality, B postoperative complications, C postoperative hospital stay, and D peritoneal metastasis
Postoperative complicationsPostoperative complications were reported in 5 studies [5, 6, 9, 11, 13]. Low heterogeneity was observed among these studies (I2 = 17%, p = 0.31). The random-effect model was applied, and the combined effect was RR = 1.21, 95% CI 0.77–1.90), p = 0.40. There was no significant difference in postoperative complications between the EH group and the DH group (Fig. 2B).
Postoperative hospital stayThe postoperative hospital length of stay was reported in four studies [5,6,7, 13]. High heterogeneity was observed among these studies (I2 = 87%, p < 0.0001). The random-effect model was applied, and the combined effect was WMD = − 0.64, 95% CI − 5.61–4.34, p = 0.80. There was no significant difference in the postoperative hospital length of stay between the EH group and the DH group (Fig. 2C).
Peritoneal metastasisPeritoneal metastasis was reported in three studies [6, 7, 13]. Low heterogeneity was observed among these studies (I2 = 0%, p = 0.90). The random-effect model was applied, and the combined effect was RR = 1.06, 95% CI 0.66–1.71, p = 0.80. There was no significant difference in abdominal metastasis between the EH group and the DH group (Fig. 2D).
Recurrence rateThe recurrence rate was reported in four studies [5,6,7, 13]. Low heterogeneity was observed among these studies (I2 = 0%, p = 0.98). The random-effect model was applied, and the combined effect was RR = 1.09, 95% CI 0.94–1.25, p = 0.27. There was no significant difference in the recurrence rate between the EH group and the DH group (Fig. 3A).
Fig. 3
Forest plots of A recurrence rate, B 1-year overall survival, and C 3-year overall survival
One-year OSOne-year OS was reported in six studies [5,6,7,8, 10, 13]. Low heterogeneity was observed among these studies (I2 = 0%, p = 0.80). The random-effect model was applied, and the combined effect was RR = 0.91, 95% CI 0.80–1.02), p = 0.11. There was no significant difference in 1-year OS between the EH group and the DH group (Fig. 3B).
Three-year OSThree-year OS was reported in four studies [6,7,8, 13]. Low heterogeneity was observed among these studies (I2 = 6%, p = 0.36). The random-effect model was applied, and the combined effect was RR = 0.81, 95% CI 0.61–1.09, p = 0.17. There was no significant difference in 3-year OS between the EH group and the DH group (Fig. 3C).
Sensitivity analysis and publication biasThe outcome index results are stable in each meta-analysis when sensitivity analysis is performed. We did not detect publication bias by Begg’s test or Egger’s test (Supplemental file 3). Begg’s funnel plot with pseudo 95% confidence limits is shown in Fig. 4.
Fig. 4
Begg’s funnel plot with pseudo 95% confidence limits
留言 (0)