Study design and population
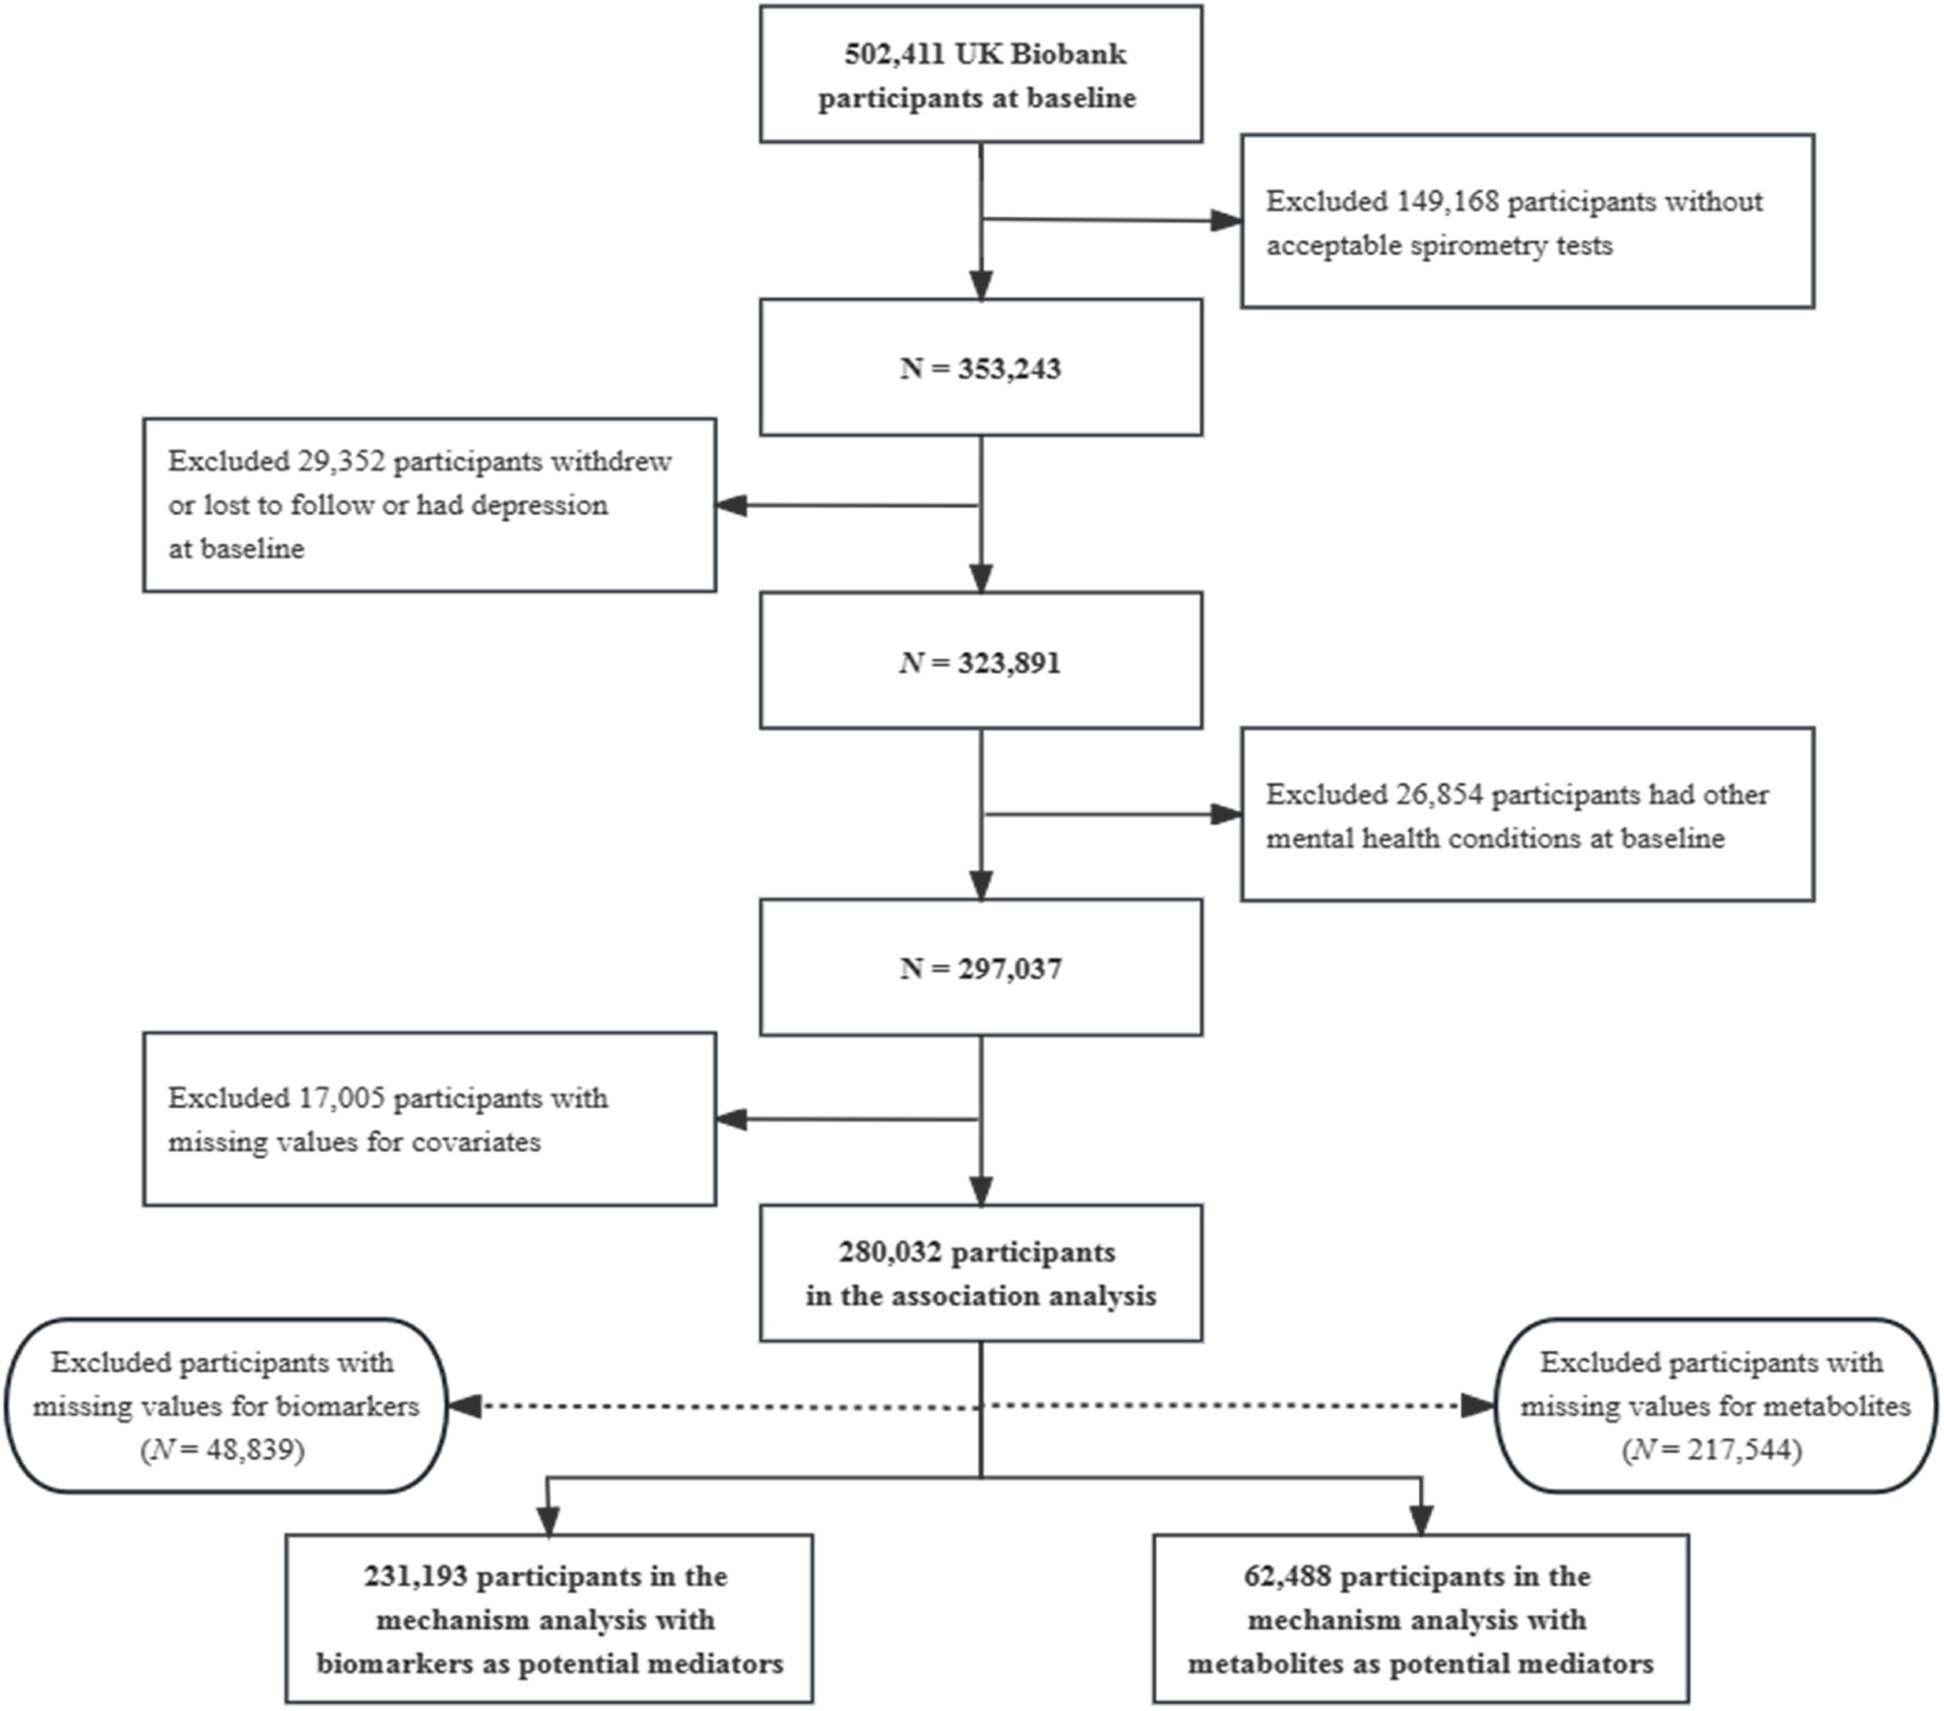
The UK Biobank is a large-scale prospective study that recruited 502,507 participants aged 37–73 years from the general population between 2006 and 2010 [15]. Participants attended 1 of 22 dedicated assessment centers nationally across England, Wales, and Scotland where they provided information on health-related aspects through touch-screen questionnaires and physical measurements [16]. The details of the study design and methods have been described in previous studies [17]. In the present study, we excluded participants who were lost to follow-up (n = 1346) or with missing information on coffee or tea consumption (n = 3003) at baseline, leaving 498,158 participants for the primary analysis (Additional file 1: Fig. S1).
Assessment of coffee and tea consumption
The touchscreen questionnaire included part of a dietary assessment of a series of common food and beverage items. Participants were asked about their average intake of coffee in the last year “How many cups of coffee do you drink each day (including decaffeinated coffee)?” and “How many cups of tea do you drink each day (including black and green tea)?” Participants either selected the number of cups, “Less than 1,” “Do not know,” or “Prefer not to answer.” If coffee and tea consumption exceeded 10 and 20 cups/day, respectively, then participants were asked to confirm their answers.
Assessment of covariates
To guide covariates selection, we constructed a directed acyclic graph (DAG) based on sociodemographic characteristics and a prior knowledge of potential confounding factors associated with all-cause mortality [10, 18, 19]. Additional file 1: Fig. S2 shows the DAG depicted causal relationships between measured variables in the current analysis. The program of DAGitty was used to identify the minimally sufficient adjustment set [20]. We used the baseline touch-screen questionnaire to collect sociodemographic, behavioral, and other factors. Sociodemographic factors were documented including sex, age, ethnicity (White, Asian or Asian British, Black or Black British, and others), and education levels (college or university degree, upper secondary, lower secondary, vocational, and others). Behavioral factors included smoking status (never, previous, and current), alcohol intake frequency (never, special occasions only, one to three times a month, once or twice a week, three or four times a week, daily or almost daily), physical activity (low, middle, and high, measured using the International Physical Activity Questionnaire [IPAQ]), and dietary pattern (healthy and unhealthy, healthy diet was based on consumption of at least 4 of 7 dietary components: fruits: ≥ 3 servings/day, vegetables: ≥ 3 servings/day, fish: ≥ 2 servings/week, processed meats: ≤ 1 serving/week, unprocessed red meats: ≤ 1.5 servings/week, whole grains: ≥ 3 servings/day, refined grains: ≤ 1.5 servings/day) (Additional file 1: Table S1) [21, 22]. Body mass index (BMI) (< 25, 25 to < 30, ≥ 30 kg/m2) was derived from physical measurement and calculated by dividing weight (kg) over height (m) squared. General health status was categorized as excellent, good, fair, and poor. Information on chronic diseases (e.g., hypertension, diabetes, and depression) was collected from touchscreen questionnaires, medical examinations, and hospital inpatient records.
Ascertainment of outcomes
Mortality information was obtained from death certificates, which were provided by the NHS Information Centre (England and Wales) and the NHS Central Register Scotland (Scotland) for the date of death. International Classification of Diseases (ICD-10) codes were used to classify deaths from CVD (ICD 10 codes I00-I79), respiratory disease (ICD 10 codes J09-J18 and J40-J47), digestive disease (ICD 10 codes K20-K93), and other causes.
Statistical analyses
We summarized baseline characteristics according to coffee and tea consumption categories as percentages for categorical variables, while means with standard deviations (SDs) for normal continuous variables and median and interquartile range (IQR) for non-normal variables. Normality test was applied by Shapiro-Wilk normality test. Multiple imputations using the chained equations (MICE) method were performed to handle missing covariates. Five imputed datasets were constructed and Rubin’s rule was used to combine the results [23].
To assess the dose-response associations of separate coffee and tea consumption with all-cause mortality and cause-specific mortality, we used restricted cubic splines models with 4 knots at the 25th, 50th, 75th, and 95th centiles. Tests for linearity or nonlinearity used the Wald test to calculate P-values, which was performed to test the null hypothesis that the coefficient of the second spline is equal to 0 [24]. In our analysis, the null hypothesis was rejected (P < 0.05) and concluded that there was a nonlinear relationship between separate coffee and tea consumption with all-cause mortality and cause-specific mortality. In the spline models, we adjusted for potential confounders including sex, age, ethnicity, education levels, BMI, smoking status, alcohol intake frequency, physical activity, dietary pattern, general health status, hypertension, diabetes, and depression. Coffee and tea consumption were mutually adjusted. Then, we divided coffee and tea consumption into four groups using prior validated thresholds based on the restricted cubic spline of association between separate consumption of coffee and tea with mortality. Participants who drank ≥ 5 cups/day of coffee or tea were defined as excess consumption based on previous studies [25]. Finally, we defined the categories as follows: coffee: none, < 1–2, 3–4, and ≥ 5 cups/day; tea: none, < 1–1, 2–4, and ≥ 5 cups/day. Cox proportional hazards models were used to estimate the hazard ratios (HRs) and 95% confidence intervals (CIs) of separate coffee and tea consumption groups with all-cause mortality and cause-specific mortality. Proportional hazard assumptions were verified using the Schoenfeld residuals method, and no significant deviations were observed. Follow-up time was calculated from the date of questionnaire completion in which the baseline coffee and tea consumption were available, lost to follow-up, death, or end of follow-up (23 March 2021), whichever came first. The multi-adjusted models were adjusted with the same covariates as the restricted cubic spline. Furthermore, to quantify the magnitude of combined consumption of coffee and tea with mortality, participants were categorized into 16 groups according to coffee and tea consumption categories, with participants who had neither coffee nor tea consumption comprising the reference group. Coffee consumption of < 1–2 cups/day and tea consumption of 2–4 cups/day were combined into one category because these participants had the highest proportion and the lowest mortality rate.
In addition, we performed subgroup analyses to assess potential modification effects and determine whether there was any population heterogeneity according to age, sex, BMI, physical activity, smoking status, alcohol intake frequency, dietary pattern, hypertension, diabetes, and depression. The interactions between baseline characteristics and combined coffee and tea consumption (combined < 1–2 cups/day of coffee and 2–4 cups/day of tea vs. neither coffee nor tea consumption) were examined using the likelihood ratio test (LRT).
Sensitivity analysis
Additional analyses were further conducted. First, we repeated the main analyses by excluding mortality cases that occurred in the first 3 years of follow-up. Second, we conducted the main analyses using available data before multiple imputations for missing covariates. Third, because severe diseases could confound results, we defined a population that excluded participants with prevalent CVD and cancer at baseline. Fourth, smoking may have potential effect modification because there may be unmeasured confounders between previous and current smokers. Therefore, we repeated the main analyses adjusted for pack-years categories of cigarette smoking (nonsmokers: having smoked zero pack-years; light smokers: fewer than 20 pack-years; and heavy smokers: 20 or more pack-years). Pack-years of cigarette smoking were calculated as the number of cigarettes smoked per day divided by 20 and then multiplied by the number of years of smoking [26]. Fifth, the information on both coffee and tea consumption and potential confounders were collected at the baseline; it is very difficult to assess the role of depression in these associations. We performed main analyses without adjusting for baseline depression. Furthermore, we also investigated coffee and tea consumption interaction on mortality in the above sensitivity analyses. All analyses were performed using R (version 3.6.3, R Foundation for Statistical Computing) and STATA 15 statistical software (StataCorp). The two-sided P < 0.05 was considered statistically significant.


留言 (0)