
記住我


This retrospective study conformed to the ethical guidelines of the 1975 Declaration of Helsinki, and the protocol was approved by the institutional review board with a waiver of written informed consent. This was a retrospective observational analysis based on previously collected routine care data. All radiological and clinical data have been anonymized before being analyzed.
All patients with clinical suspicion of obstructive CAD between January 1st, 2020, and December 31st, 2020, were retrospectively included.
Exclusion criteria were: (1) patients with unstable angina, (2) patients with severe renal failure (eGFR < 30 mL/min/1.73 m2) or other contraindications for iodinated contrast material (i.e.previous allergic reaction), (3) heart rate > 85 bpm with contraindications to the use of β-blocker, (4) presence of arrhythmia or atrial fibrillation, (5) unstable clinical condition, (6) inability to perform a breath-hold, (7) patients underwent CCTA with poor or non-diagnostic image quality.
Flowchart in Fig. 1 summarizes the enrollment process.
Fig. 1 CCTA protocol
All patients underwent low-kV CCTA protocol combined with a prospective ECG-gated technique by using a 256-MDCT scanner (iCT Elite, Philips Medical Systems, Best, The Netherlands), a dual-mode scout (on the coronal and sagittal plane) to select the acquisition volume with the lowest scan length according to the patient’s anatomy.
The 80 kV setting increased to 100 kV for patients with BMI over 30. Automated tube-current modulation, with a pre-set value depending on the patient's shape and geometry from the scout image, and a dose right index of 7 was used to reduce the total radiation dose. The other scan parameters were as follows: collimation 128 × 0.625; rotation time 0.27 s; thickness 0.67 mm; increment 0.335 mm; FOV 250 mm; matrix 512 × 512.
CT data were acquired with step and shoot acquisition with a prospective ECG-triggered axial acquisition, selecting the 78% (± 3%) of the cardiac cycle (R-R interval).
In each patient, an 18-gauge intravenous cannula was placed in an antecubital vein of the upper limb, and the contrast medium (CM) was injected using an automatic double-syringe injector (Medrad Stellant, Pittsburgh, PA, USA). A standardized volume of contrast medium of 70 ml (Iobidtritol 350—Xenetix, Guerbet, Aulnay, France) with a flow rate of 4.5 mL/s followed by saline flushing (volume 50 ml, flow rate 4.5 mL/s) was used.
If the baseline heart rate (HR) was > 65 beats per minute (bpm) and patients had no contraindications for β-blockers, metoprolol (5–20 mg) was injected intravenously before the examination.
The start of scanning was obtained for each patient by using a bolus-tracking technique, with a trigger area manually placed at the proximal ascending aorta with a threshold of 120 HU and an 8-s delay.
All raw data were reconstructed with the standard filter "Cardiac Routine" with both algorithms: MBIR (IMR, Level 1, Philips Healthcare, Cleveland, OH, USA) and IR (iDose, Level 4, Philips Healthcare, Cleveland, OH, USA). CCTA protocol is summarized in Table 1.
Table 1 Scanning parameters and reconstruction algorithms usedImage analysisImages were processed on a dedicated workstation (IntelliSpace Portal 9.0, Philips) to compute multiplanar reconstructions (MPR), maximum intensity projections (MIP), and volume rendering (VR) images. The CAD-RADS assessment categories and modifiers [10], quantitative and qualitative images analyses were performed by two radiologists with 4 (reader 1) and 7 years of experience (reader 2) in CCTA, CTA, and 3D vascular images interpretation, blinded each other and to clinical data.
Qualitative image evaluationThe diagnostic image quality of the ascending aorta and the coronary arteries (RCA, CTk, LAD, and LCx) was evaluated using a 5-point Likert scale for coronary CTA by the two readers, based on the presence of motion artifacts and image noise influencing subjective image quality, as follows: 5 = excellent image quality, 4 = good image quality, 3 = acceptable image quality, 2 = below-average image quality, 1 = poor image quality.
Quantitative image evaluationEach study was evaluated using the CAD-RADS lexicon based on the degree of maximum coronary stenosis among vessel segments larger than 1.5 mm in diameter. All vessels were evaluated with a scoring system from 0 to 5, as follows: 0 = absence of atherosclerosis, 1 = minimal stenosis or plaque with no stenosis (1–24%), 2 = mild stenosis (25–49%), 3 = moderate stenosis (50–69%), 4A = severe stenosis (60–79%) or 4B = left main > 50% or 3 vessel obstructive (> 70%), 5 = total occlusion (100%).
Moreover, CAD-RADS categories were integrated by modifiers as follows: N = non-diagnostic study, S = presence of a stent, G = presence of graft, and V = presence of vulnerable plaque [11].
Vessel contrast enhancement (mean attenuation value, HU) and image noise, defined as the standard deviation of the attenuation values (SD) (Fig. 1), were measured by manually placing a circular region of interest (ROI) at the center of the vascular lumen in the ascending aorta (AO), in the proximal segment of right coronary artery (RCA), common trunk (CTk), left anterior descending (LAD) and left circumflex (LCx) (Fig. 2).
Fig. 2
Evaluation of noise and HU of the same patient’s examination dataset reconstructed with the two different iterative algorithms, model-based (MBIR) and hybrid-iterative (IR). CCTA was acquired with an 80-kV protocol, with a low radiation dose exposure (DLP 98.5 mGy × cm; ED 1.44 mSv), with a CADARAD score of 0. a–c Axial images reconstructed with IR with circular ROI placed in the proximal ascending aorta and common trunk. b–d Axial images reconstructed with MBIR with circular ROI placed in the same position as figures A and C. Because of the use of the model-based iterative reconstruction algorithm (MBIR), we obtained an image noise reduction of 50% compared to IR reconstruction as reported in the images: IR standard deviation (SD) in aorta 84 and common trunk 89; MBIR SD: aorta 42 and common trunk 47
The signal-to-noise ratio (SNR) was computed using the formula SNR \(=\frac}_}}}_}}\), where HUA is the mean attenuation of the coronary artery (at each proximal segment) and SDA is the standard deviation of the HU values. Finally, the contrast resolution was evaluated by calculating the contrast-to-noise ratio (CNR) using the formula CNR \(=\frac}_}-}_}}}_}}\), where HUA is the attenuation of the proximal tract of coronary arteries and the ascending aorta and HUB and SDB are the attenuation and standard deviation of the adjacent adipose tissue, as previously reported [13, 14].
Radiation doseCT dose index (CTDIvol, mGy) and CT dose-length product (DLP, mGy·cm) were registered for all examinations. The effective dose (ED) was computed using the formula ED = k × DLP, where k is the region-specific normalized effective dose (mSv/mGycm) derived from the paper by Deak et al. [14]. A k value of 0.0146 mSv/mGy-1·cm-1 [15] was adopted to estimate the effective dose from cardiovascular imaging procedures for adult patients.
Statistical analysisContinuous variables were expressed as means and standard deviations and compared by using the Mann–Whitney test or t-Student’s test, when appropriate.
The agreement between the two readers was assessed using the Cohen kappa or Weighted kappa coefficients (0.00–0.20 indicates slight agreement; 0.21–0.40, fair agreement; 0.41–0.60, moderate agreement; 0.61–0.80, substantial agreement; and 0.81–1.00, almost perfect agreement), in case of 2 or more than 2 categorical variables, respectively.
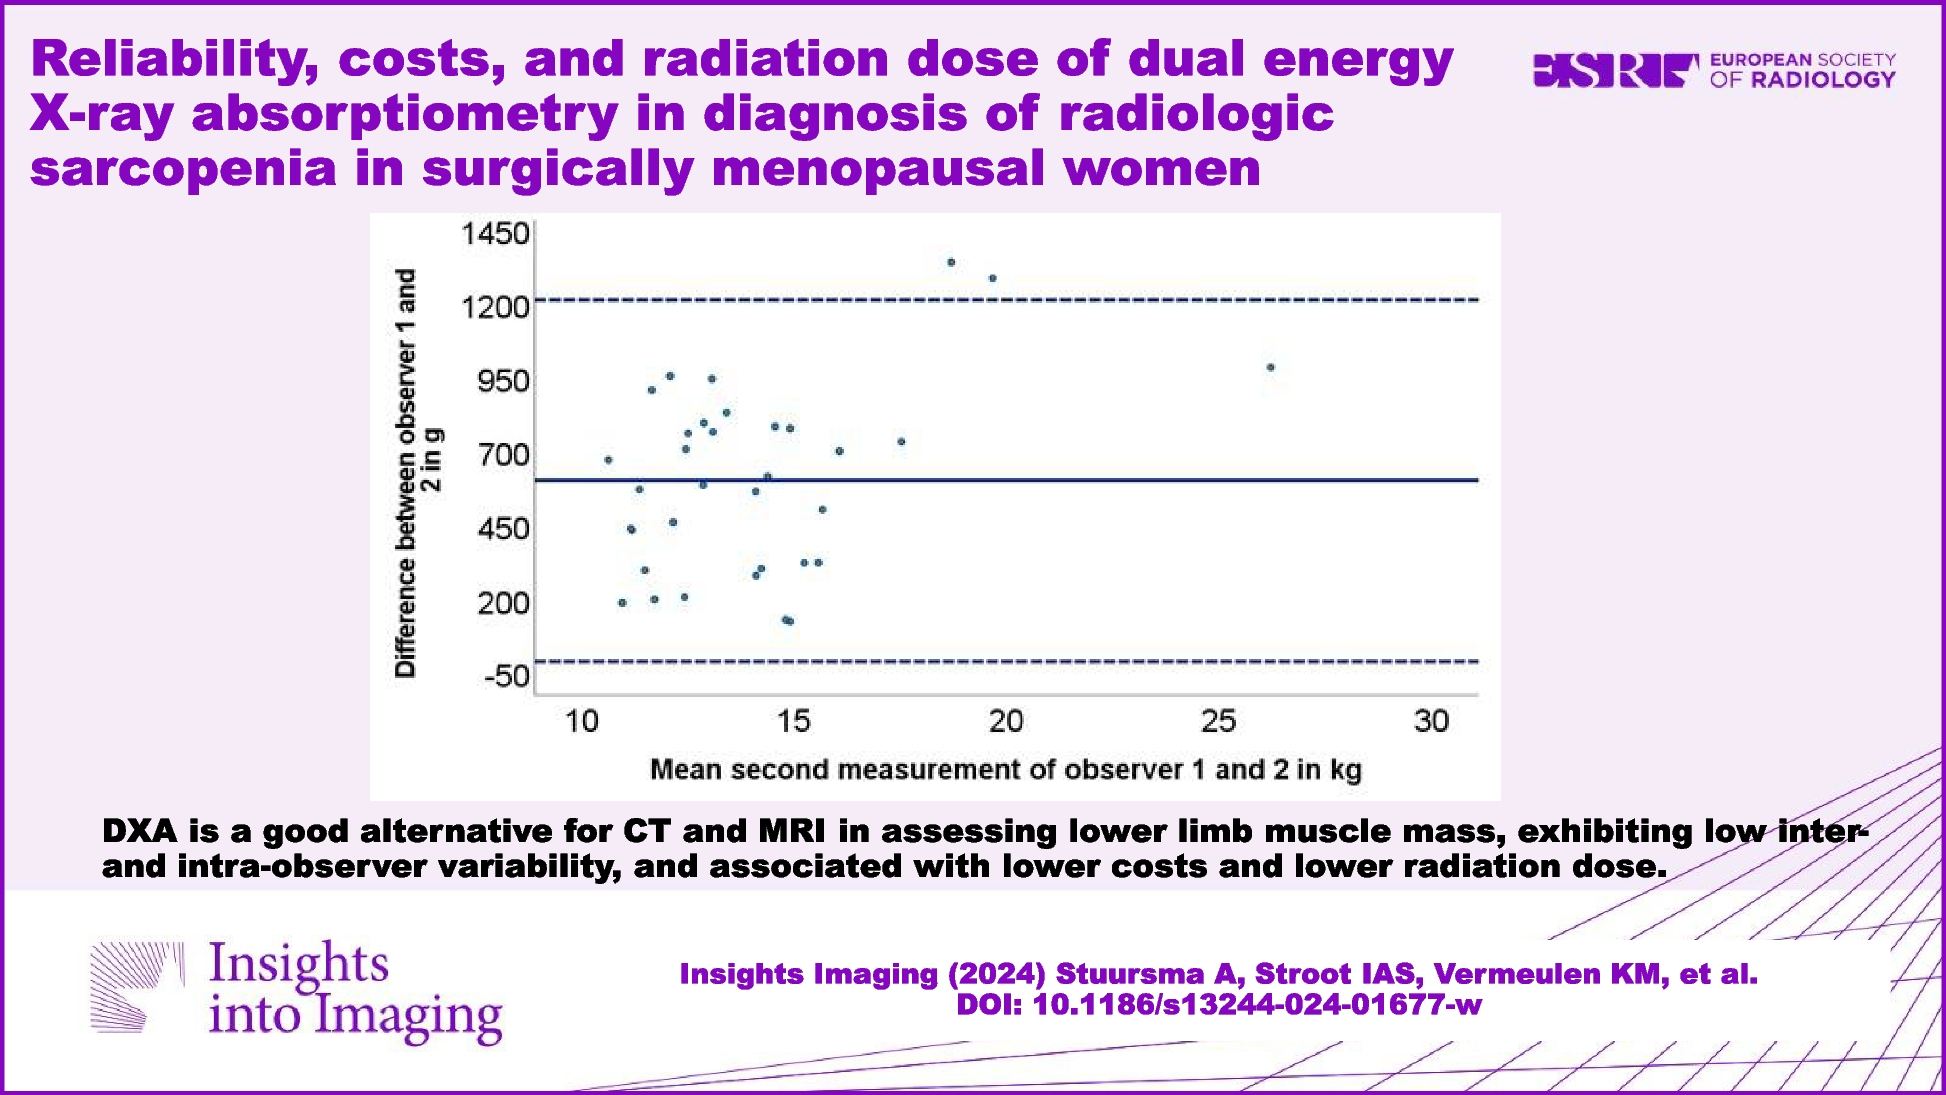
The comparison between the continuous variables measured by the two readers was assessed with Spearman correlation and the Bland–Altman Limits of Agreement (LoA) with the 95%CIs.
A p-value < 0.05 was considered significant. The analysis was performed using SPSS software (v 26.0, SPSS Inc, Chicago, Illinois).
留言 (0)