
記住我
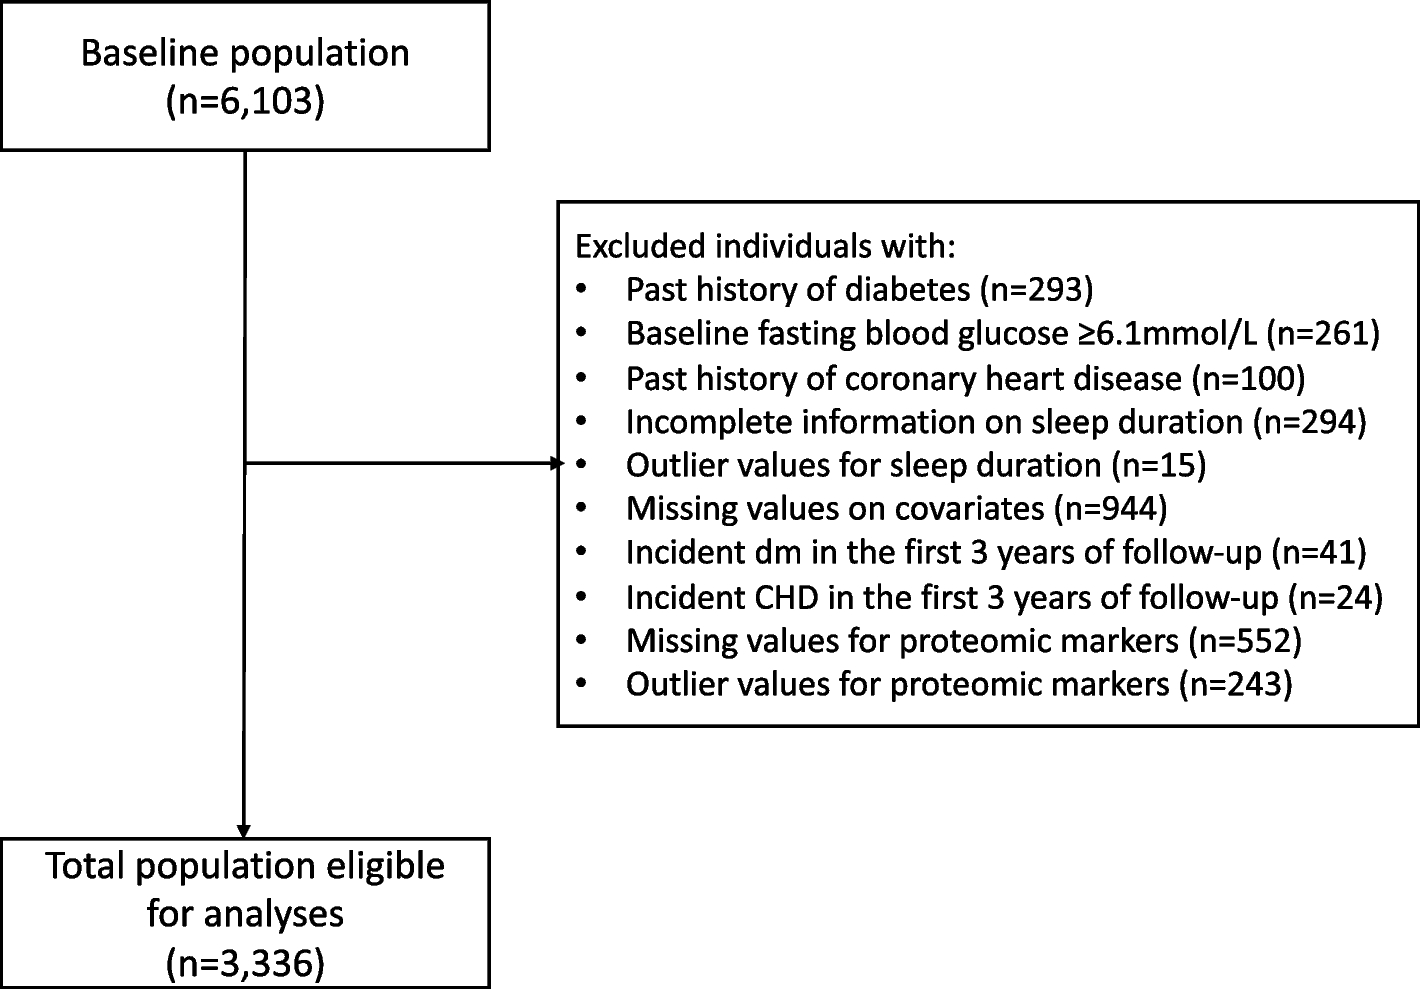
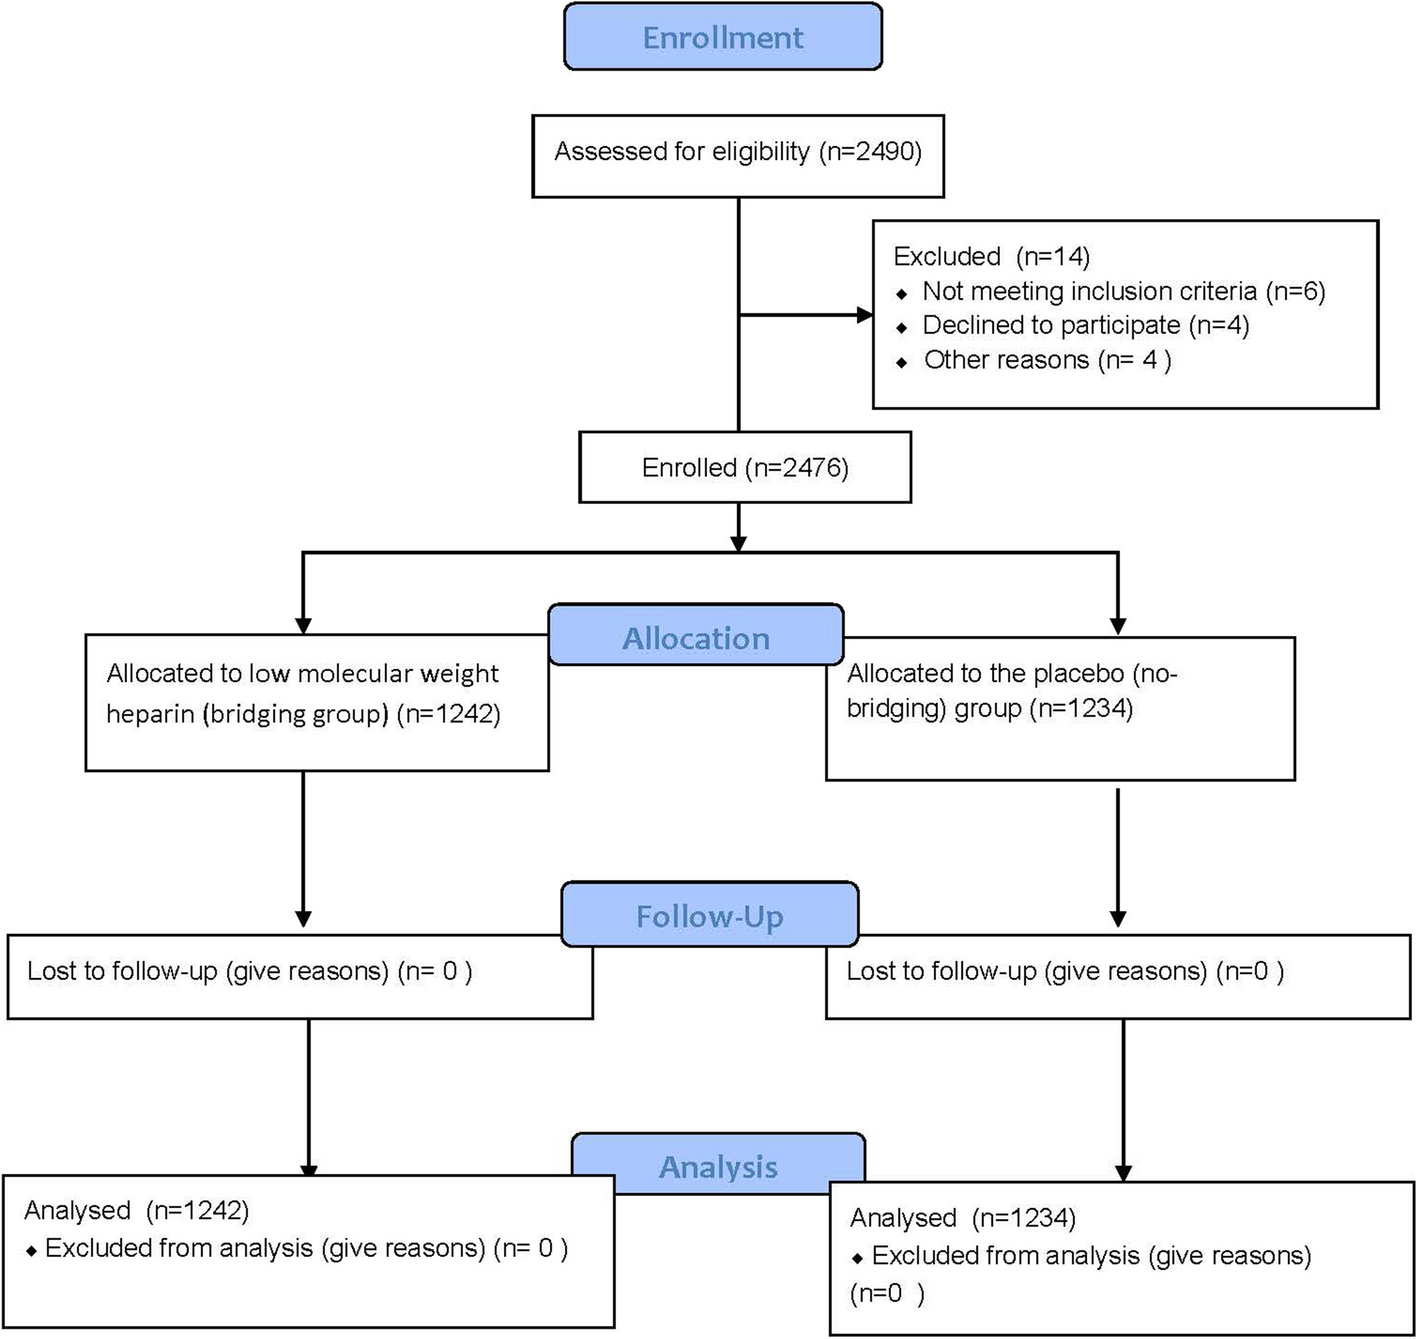


The study flow chart is shown in Fig. 1. A total of 92 NSCLC patients with brain metastases were enrolled in the study. The baseline characteristics of patients are summarized in Table 1. The median age was 57 years (range, 28–74 years), 59 patients (64.1%) were male, and 78 patients (84.8%) had lung adenocarcinoma. All patients received systemic therapies as their first-line treatment, 33 patients (35.9%) received chemotherapy, 10 patients (10.8%) received immunotherapy, and 49 patients (53.3%) received tyrosine kinase inhibitors (TKIs).
Fig. 1
Flowchart of the study design and participants. The study design and sample collection timepoints are shown with the number of patients and available samples. Abbreviations: NSCLC, non-small cell lung cancer; CSF, cerebrospinal fluid
Table 1 Clinical characteristics of the study cohort at baseline (N = 92).In total, 91 CSF samples and 90 plasma samples were collected from 92 patients at baseline (before treatment), and 58 patients had paired extracranial tumor tissues at baseline (38 primary lung tumor tissues and 20 lymph node tissues). Then, 49 CSF samples and 51 plasma samples were collected from 51 patients 8 weeks after the initiation of first-line treatment. Seven CSF samples and nine plasma samples were collected from nine patients at disease progression (Fig. 1).
Concordance of genomic alteration detection in baseline CSF, plasma, and tumor tissue samplesAt baseline, we detected at least one somatic mutation in 63.7% (58/91) of CSF samples, 91.1% (82/90) of plasma samples, and 100% (58/58) of extracranial tumor tissues (Fig. 2A). However, the max VAF in CSF ctDNA-positive samples and tumor tissues were significantly higher than that in plasma (Fig. 2B). A subgroup of 57 patients who had paired tissue-plasma-CSF samples at baseline were compared in three aspects (Additional file 1: Fig. S1A-C). All baseline tissue samples were positive for genomic alterations and 96.5% (55/57) of which carried driver/oncogenic mutations. Comparatively, CSF was inferior to tumor tissue for positive detection rate of any genomic alteration. Only 67% of the CSF samples were positive for genomic aberrations, 44% contained mutations in cancer driver genes, such as EGFR, ALK, MET, BRAF, ROS1, NTRK1, RET, KRAS, and ERBB2 [22], and 51% contained oncogenic mutations defined by the oncoKB database [23]. Over half (52%, 246/474) of the genomic alterations detected in tissue samples were unique, while the percentage of unique genomic alterations identified in CSF (24.5%, 40/163) and plasma (24.4%, 73/299) samples were comparable (Additional file 1: Fig. S1D). Genomic alterations shared by all three sample types accounted for 56% (91/163) of alterations detected in CSF, compared to 19% for tumor tissue (91/474). When considering only driver gene mutations (Additional file 1: Fig. S1E), the concordance rate for CSF was 78% versus tissue, and 91% for plasma versus tissue, which was comparable to oncogenic mutations (CSF vs. tissue: 85%; plasma vs. tissue: 84%; Additional file 1: Fig. S1F). We also investigated the consistency of genomic alterations, including somatic mutations and CNVs, between tumor tissues and liquid biopsies. An average of 79.7% (range: 0-100%) of genomic alterations from primary lung tumors and 70.7% (range: 0–100%) from lymph nodes were detected in paired plasma samples, respectively. However, only 59.7% (range: 0–100%) of genomic alterations from primary lung tumors and 52.3% (range: 0-100%) from lymph nodes were detected in paired CSF samples (Additional file 2: Fig. S2A). When only considering somatic mutations, a higher level of heterogeneity was observed between CSF and paired primary tumors after excluding CNVs (Additional file 2: Fig. S2B).
Fig. 2
The detection of ctDNA at baseline and the correlation between overall survival and baseline CSF ctDNA positivity. A Positive detection rates of somatic mutations in CSF, plasma, and tissue samples. P-values were calculated using the Fisher’s exact test. B The distribution of max VAF of the three sample types. P-values were calculated using an unpaired two-tailed t-test. C Overall survival of patients with positive and negative CSF ctDNA detection at baseline. P-values were calculated using the log-rank test. Abbreviations: CSF, cerebrospinal fluid; ctDNA, circulating tumor DNA; HR, hazards ratio; VAF, variant allele frequency
Patients with ctDNA detected in the baseline CSF samples had significantly shorter overall survivals than patients without ctDNA detected in CSF samples at baseline (22.2 months vs 37.6 months, HR = 2.565, P = 0.003) (Fig. 2C). The clinical characteristics between subgroups are shown in Additional file 11: Table S1. Baseline CSF ctDNA positivity was associated with larger intracranial tumor size. In multivariate analyses, the detection of ctDNA in baseline CSF samples remained a significant prognostic factor for poor outcomes (HR = 2.683, P = 0.006) (Additional file 12: Table S2).
CSF ctDNA displays unique genetic profiles of metastatic brain tumorsAmong 56 patients with genomic alterations detected in both paired baseline plasma and CSF samples, we compared the genetic profiles between the two sample types (Fig. 3). An average of 56.5% (range: 0–100%) of genomic alterations in plasma were detected in CSF ctDNA, and an average of 83.3% (range: 0–100%) of alterations in driver genes [22] in plasma were detected in CSF ctDNA (Additional file 3: Fig. S3). EGFR, TP53, and KRAS were the most frequently altered genes. The EGFR mutation rate was 42.9% (24/56) in CSF ctDNA and 51.8% (29/56) in plasma ctDNA, with a concordance rate of 87.5% between the CSF and plasma samples (Cohen’s kappa coefficient = 0.751). The mutation rate of TP53 was 48.2% (27/56) in CSF ctDNA and 60.7% (34/56) in plasma, with a concordance rate of 76.8% (Cohen’s kappa coefficient = 0.539). KRAS G12C was the predominant alteration in KRAS and demonstrated a concordance rate of 83.1% (Cohen’s kappa coefficient = 0.677) between CSF and plasma samples (Additional file 4: Fig. S4).
Fig. 3
Comparison of genomic profiles between paired CSF and plasma samples. Somatic mutations (A) and CNVs (B) detected in paired baseline CSF and plasma samples are illustrated by OncoPrint plots. Abbreviations: CSF, cerebrospinal fluid; PLA, plasma; CNV, copy number variation
CNVs were more frequently detected in CSF (39.3%, 22/56) than in plasma (21.4%, 12/56, P = 0.04), and the majority of CNVs were unique to CSF samples. EGFR copy number gain was the most frequent CNV and was identified in 14.3% (8/56) of CSF and 7.1% (4/56) of plasma samples. Copy number loss of STK11, as well as the copy number gain of multiple genes, including NTRK1, NKX2-1, SMO, and CDK6 were identified exclusively in CSF ctDNA (Fig. 3B). Thus, those data revealed the heterogeneous genetic profiles between CSF and plasma samples with a good concordance in driver mutations.
Dynamic changes in CSF ctDNA better predict the intracranial tumor response than plasmaTo investigate whether dynamic changes in CSF ctDNA could reflect intracranial tumor responses and predict clinical outcomes, we collected paired CSF and plasma samples 8 weeks after the initiation of first-line treatment in 51 patients. A “ctDNA response” was defined as a 50% decrease in ctDNA concentration from baseline [24, 25]. Of 25 patients with CSF ctDNA detected at baseline, 12 patients had a CSF ctDNA response, and 13 had no CSF ctDNA response after 8 weeks of treatment. The clinical characteristics and treatment regimens were comparable between the groups (Additional file 11: Table S3). The median intracranial progression-free survival (PFS) of patients with CSF ctDNA response was significantly longer than that of patients without CSF ctDNA response (13.27 months vs 6.13 months, HR = 0.308, P = 0.017) (Fig. 4A). The extracranial PFS of patients with CSF ctDNA response was longer than that of patients without CSF ctDNA response (11.57 months vs 6.20 months); however, the difference was not significant (P = 0.250) (Fig. 4B).
Fig. 4
Dynamic changes in CSF ctDNA concentration better predict intracranial tumor response than plasma. Kaplan-Meier curves of intracranial progression-free survival (A) and extracranial progression-free survival (B) between patients with and without CSF ctDNA response. Kaplan-Meier curves of intracranial progression-free survival (C) and extracranial progression-free survival (D) between patients with and without plasma ctDNA response. P-values were calculated using the log-rank test. Abbreviations: CSF, cerebrospinal fluid; ctDNA, circulating tumor DNA; HR, hazards ratio; PFS, progression-free survival
We further assessed the concordance between the radiographic tumor response and dynamic changes in CSF-ctDNA concentrations. We found a concordance rate of 76.0% between the CSF ctDNA response and radiographic intracranial tumor response evaluated by enhanced brain magnetic resonance imaging examinations (Cohen’s kappa coefficient = 0.522, P = 0.008) (Additional file 5: Fig. S5 and Additional file 6: Fig. S6). However, the concordance rate was only 50.0% between the plasma ctDNA response and radiographic intracranial tumor response (Cohen’s kappa coefficient = −0.34, P = 0.813). In multivariate analyses, CSF ctDNA response remained a favorable predictive factor for intracranial PFS, regardless of treatment regimens (Additional file 11: Table S4).
Of 44 patients with ctDNA-positive plasma at baseline, 30 patients had plasma ctDNA response after 8 weeks of treatment, and 14 patients had no plasma ctDNA response after 8 weeks, with similar clinical characteristics between the two subsets (Additional file 11: Table S5). Patients with plasma ctDNA response had significantly longer extracranial PFS than patients without plasma ctDNA response (11.57 months vs 6.20 months, HR = 0.406, P = 0.033) (Fig. 4D). A trend of longer intracranial PFS was observed in patients with plasma ctDNA response than those without plasma ctDNA response (11.70 months vs 7.37 months, P = 0.140); however, the finding was not statistically significant (Fig. 4C). A concordance rate of 72.7% between the plasma ctDNA response and radiographic extracranial tumor response was also observed (Cohen’s kappa coefficient = 0.394, P = 0.009) (Additional file 5: Fig. S5 and Additional file 6: Fig. S6).
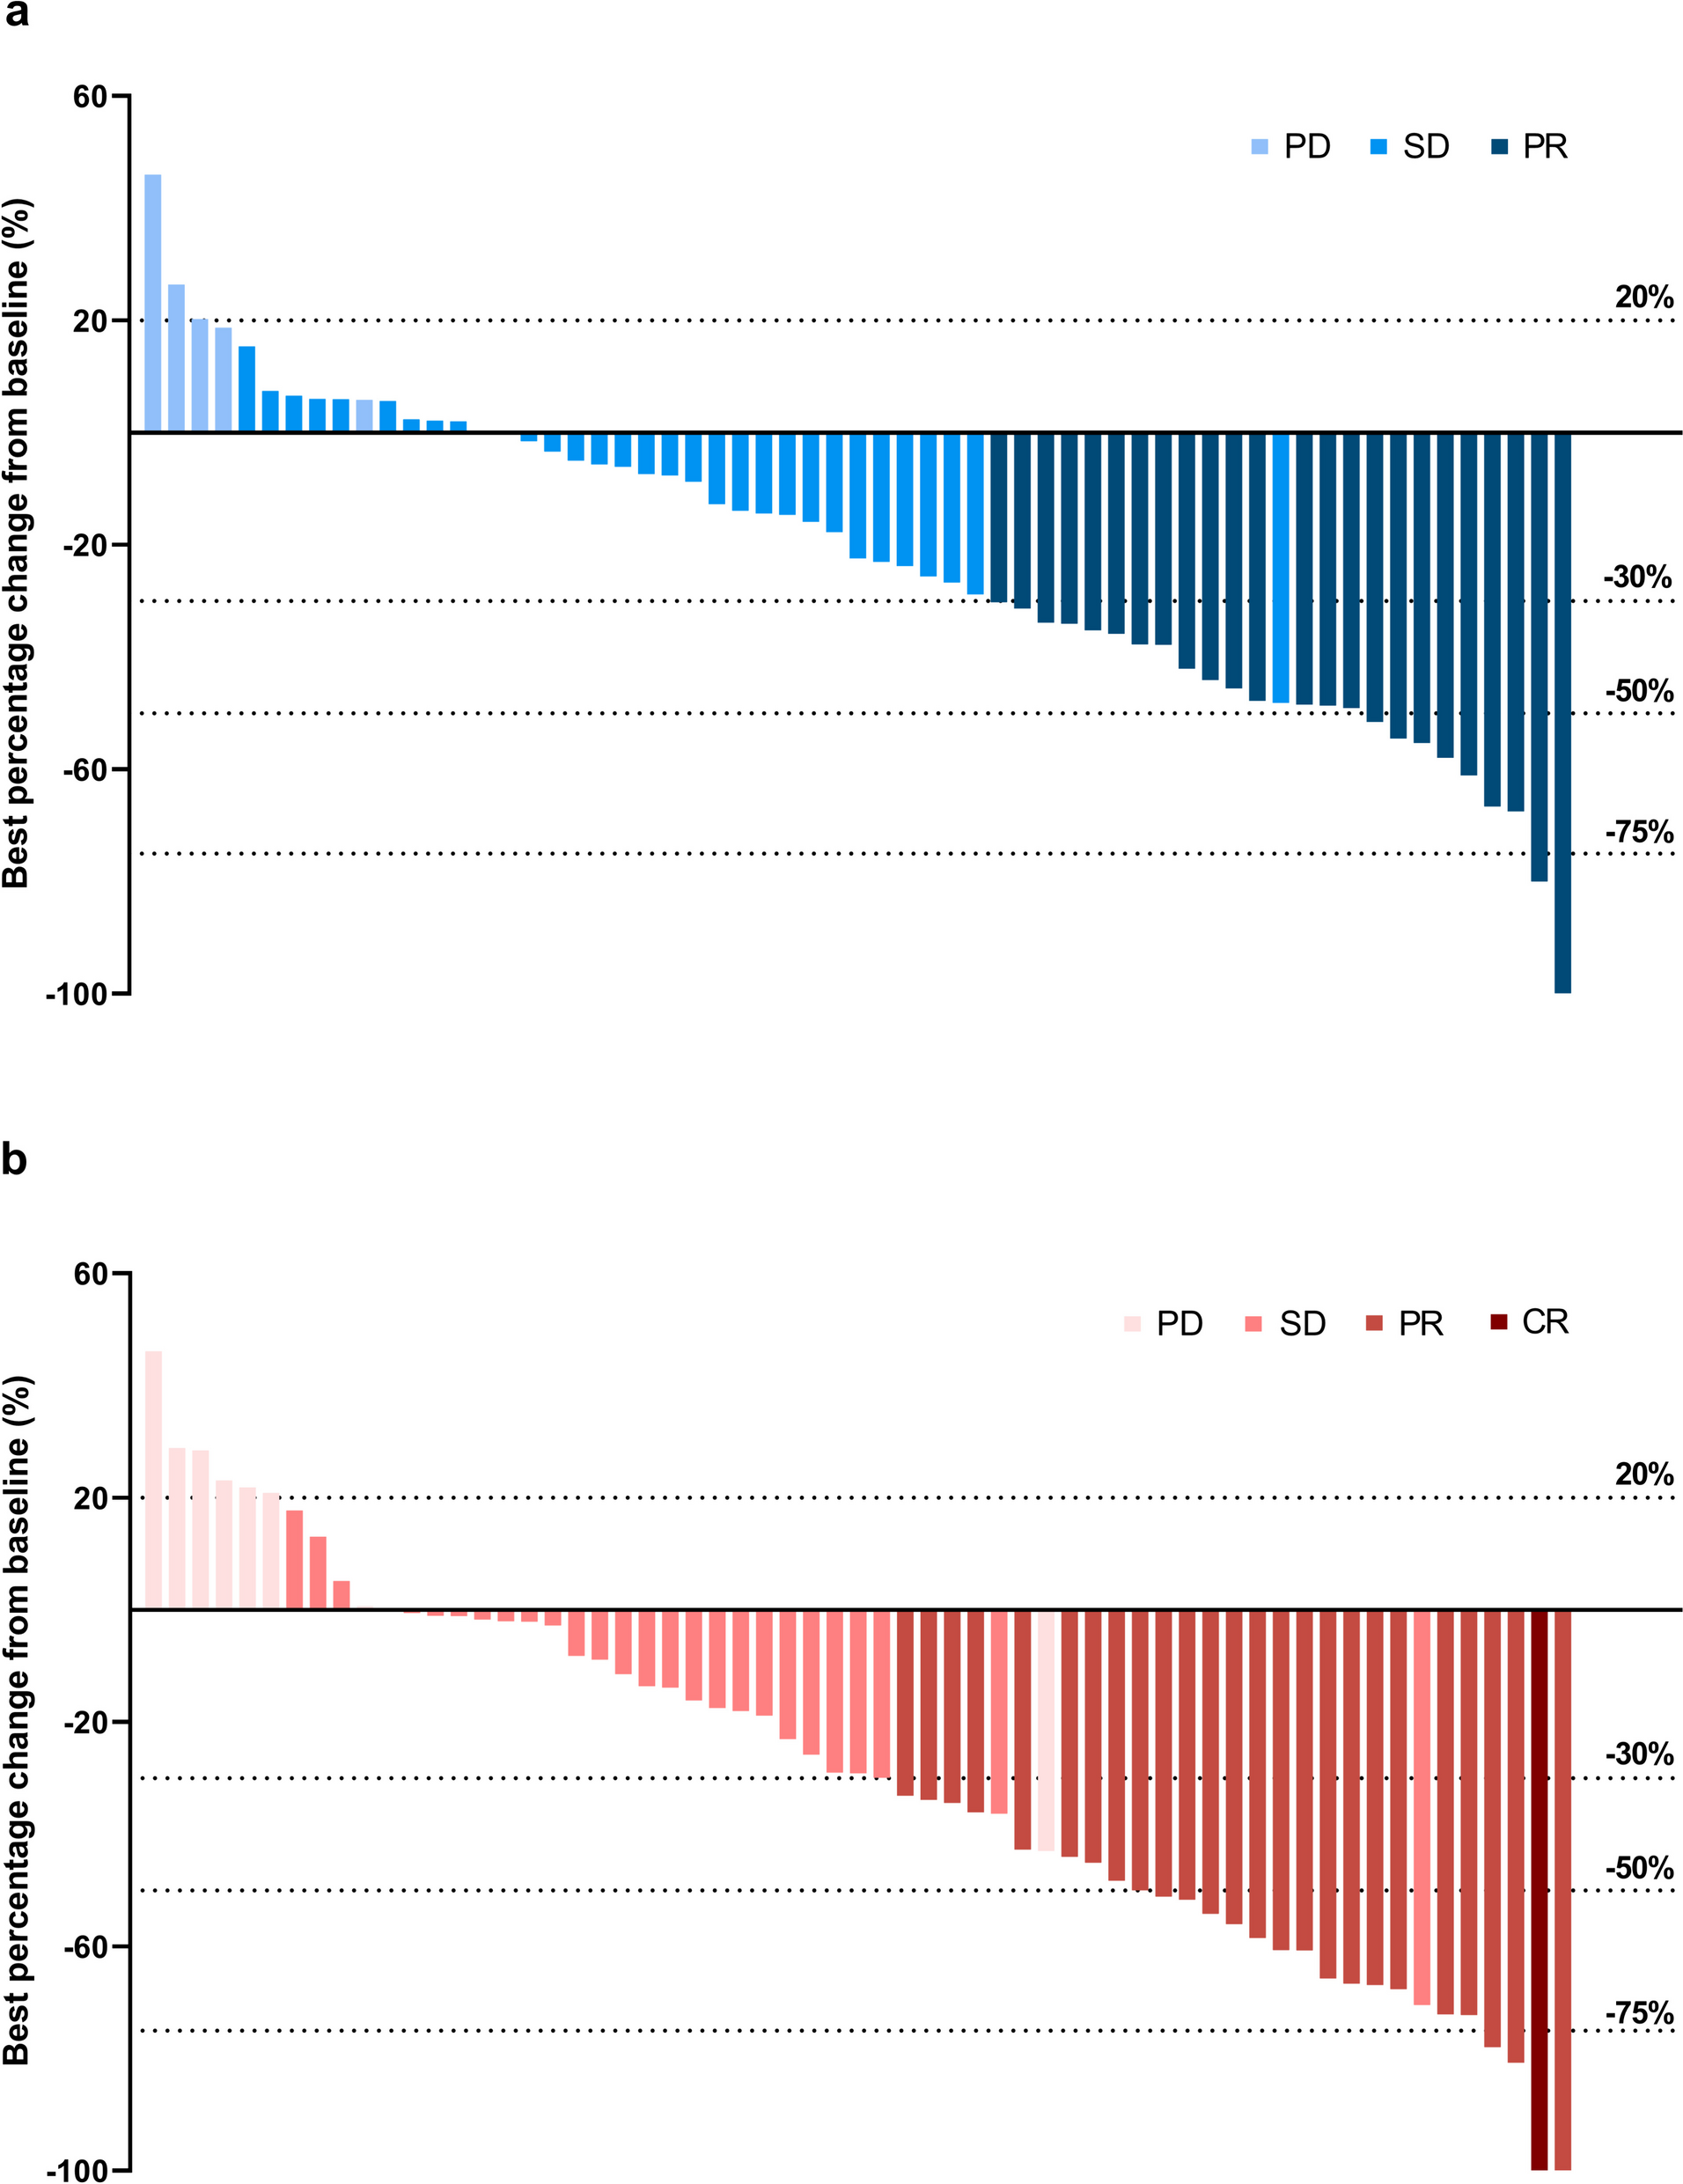
Figure 5 shows a representative case where the changes of ctDNA in CSF and plasma correlated with the intracranial and extracranial responses, respectively. Patient 76 (P76) had unique genetic alterations in baseline CSF and plasma samples, and received two cycles of paclitaxel combined with cisplatin as the first-line treatment. Eight weeks after the initiation of treatment, a partial response was achieved in the thoracic lesion (as shown on the CT scan), while the intracranial lesion progressed, as revealed by brain MRI. Notably, the ctDNA concentration increased in CSF, whereas it decreased in plasma.
Fig. 5
A representative case where the changes in ctDNA concentration of CSF and plasma samples reflected the responses of intracranial and extracranial tumors, respectively. P76 had unique genetic alterations in baseline CSF and plasma samples, and received paclitaxel combined with cisplatin as the first-line treatment. At 8 weeks after two cycles of treatment, a partial response was achieved in the thoracic lesion according to CT scans, while disease progressed in intracranial lesions according to brain MRIs. CSF ctDNA concentrations increased and plasma ctDNA concentrations decreased respectively. Abbreviations: CSF, cerebrospinal fluid; NGS, next-generation sequencing; PD, progression disease; PR, partial response
Evolution of baseline clonal and subclonal mutations in CSF ctDNA during systematic treatmentsTo investigate the evolution of baseline clonal and subclonal mutations, and their association with treatment responses, we first defined clonal and subclonal mutations based on their VAF and the max VAF in the baseline samples, as described in the Methods section. At baseline, at least one subclonal mutation was identified in 30% (6/18) of CSF samples, and in 57.1% (16/28) of plasma samples (Fig. 6A). EGFR was enriched as the clonal mutation in CSF and plasma samples (Additional file 7: Fig. S7). The newly-acquired mutations after 8 weeks of treatment that were not detectable in baseline samples were grouped as subclonal mutations, regardless of their VAFs. As shown in Fig. 6A, the overall proportion of clonal mutations in post-treatment CSF samples primarily decreased due to the clearance of clonal mutations and the acquisition of new subclonal mutations. (Additional file 8: Fig. S8 and Additional file 9: Fig. S9).
Fig. 6
Evolution of clonal and subclonal mutations in CSF and plasma after treatment. A Percentage of clonal and subclonal mutations at baseline and 8 weeks after treatment in CSF and plasma. The definition of clonal and subclonal mutations is based on their baseline VAFs (clonal: VAF ≥ 25% * maxVAF in baseline samples) and any acquired mutations after treatment are classified into subclonal subgroups. B Kaplan-Meier curves of intracranial and extracranial progression-free survival according to clonal mutations and EGFR clones 8 weeks after treatment. P-values were calculated using the log-rank test. Abbreviations: CSF, cerebrospinal fluid; HR, hazards ratio; PFS, progression-free survival
Patients whose clonal mutations accounted for over 80% of mutations detected in the CSF samples that were collected 8 weeks after treatment had shorter intracranial PFS (6.13 months vs 17.33 months, HR = 3.785, P = 0.039). However, the maintenance of clonal mutations in post-treatment plasma samples was not a significant prognostic factor for extracranial (Fig. 6B) and intracranial (Additional file 10: Fig. S10) disease; only a trend of shorter PFS was observed for patients with over 80% of baseline-defined clonal mutations in 8-week plasma samples. We then focused on patients who received EGFR-TKIs and found that the detection of baseline-defined clonal EGFR mutations in the paired CSF samples 8 weeks after treatment was a poor predictive factor for intracranial PFS (HR = 7.76, P = 0.033, Fig. 6B), while the differences in the extracranial PFS were not statistically significant (Additional file 10: Fig. S10). A trend of shorter extracranial PFS was also observed in patients with clonal EGFR mutations in plasma 8 weeks after treatment compared to patients negative for clonal EGFR mutations (9.07 months vs 27.50 months, HR = 2.472, P = 0.266; Fig. 6B and Additional file 10: Fig. S10).
留言 (0)