
記住我


After the recombinant pPIC9K-α-L-rhamnosidase plasmid was transformed into P. pastoris GS115, positive clones were selected for PCR amplification of the target fragment to verify false positives. As shown in Additional file 1: Fig. S1A, the target gene fragment size is 1955 bp, and a total of 11 positive clones were screened. After SDS-PAGE analysis (Additional file 1: Fig. S1B), the 192 h fermentation supernatant was separated by Ni column affinity chromatography and digested with N-glycosidase F to obtain deglycosylated α-L-rhamnosidase.
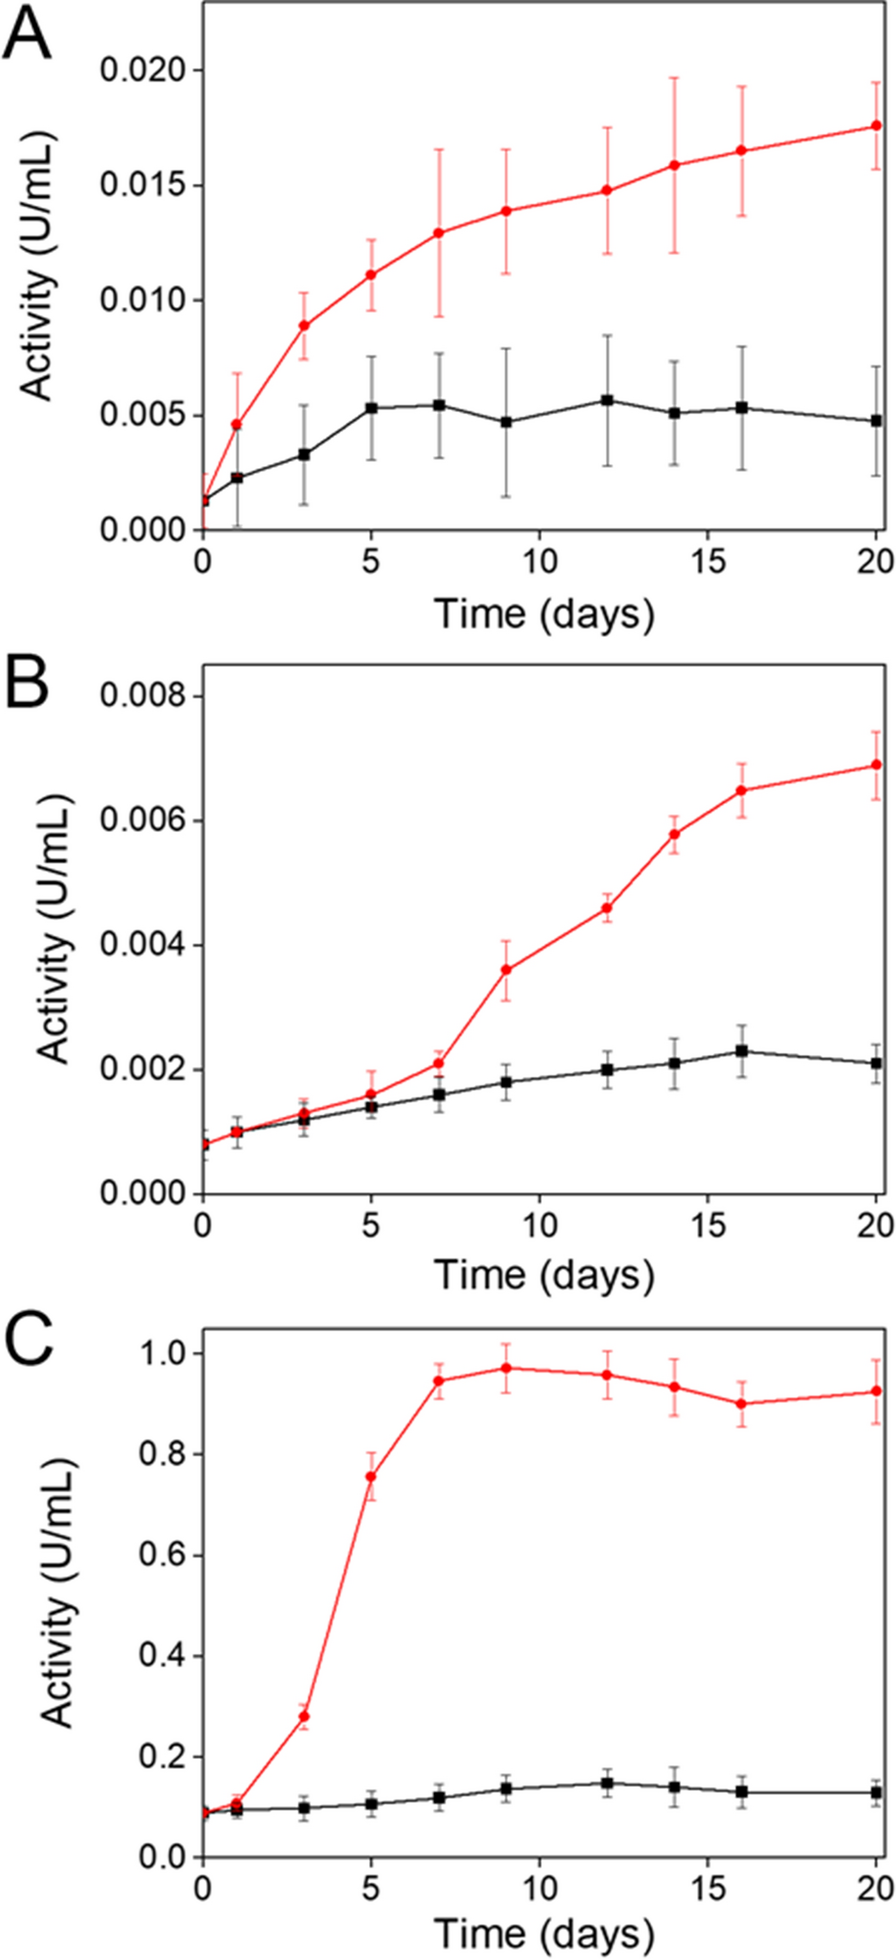
Identification for Engineered strains with high α-L-rhamnosidase activityThe 11 engineered strains (N1, N4, N5, N6, N8, N10, N12, N13, N14, N24 and N28) were cultured for 192 h. The expression of α-L-rhamnosidase was induced by adding methanol every 24 h, and the enzyme activity was measured with rutin as a substrate. The α-L-rhamnosidase activity curve of 11 strains (Fig. 1A) showed that the enzyme activity increased with the increase of culture time. The enzyme activity increased slowly in the first 4 days. From the 4th to the 7th day, the increase rate of the enzyme activity increased significantly. After the 7th day, the increase rate of the enzyme activity became flat again. Compared with other strains, the α-L-rhamnosidase produced by the strain N12 maintained the highest activity during the culture period, and the activity reached 3505.6 U/mL on the 8th day. Therefore, the strain N12 was confirmed as an engineered strain with high α-L-rhamnosidase activity.
Fig. 2
Effects of pH A and temperature B on recombinant α-L-rhamnosidase N12-Rha.
Substrate specificity and affinity differenceNaringin, rutin, hesperidin, neohesperidin, and myricetin were used as substrates to determine the activity of the recombinant α-L-rhamnosidase N12-Rha produced by strain N12 on the 7th day. As shown in Table 1, It is shown that the recombinant α-L-rhamnosidase N12-Rha can hydrolyze rutin, naringin, hesperidin, neohesperidin, but not myricetin. According to the structural analysis of five flavonoids, naringin and neohesperidin contain α-1,2 glycosidic bond, hesperidin and rutin contain α-1,6 glycosidic bond, and myricetin contains α-1,3 glycosidic bond. Therefore, the substrate specificity of the recombinant α-L-rhamnosidase N12-Rha is that it can hydrolyze the flavonoids containing α-1,2, α-1,6 glycosidic bonds, but cannot hydrolyze the C-O bond directly connected to the heterocycle.
Table 1 Substrate specificity of recombinant α-L-rhamnosidase N12-RhaTo further compare and analyze the activity changes of the recombinant α-L-rhamnosidase N12-Rha on four specific substrates (naringin, rutin, hesperidin and neohesperidin) during fermentation. As shown in Fig. 1B, during the seven days of fermentation, the activity of N12-Rha increased over time, and the affinity for the four substrates was ranked from strong to weak: hesperidin > rutin > naringin > neohesperidin. The affinity of the recombinant α-L-rhamnosidase N12-Rha to hesperidin and rutin containing α-1,6 glycosidic bond were significantly greater than that of naringin and neohesperidin containing α-1,2 glycosidic bond. This result indicates that the hydrolysis activity of N12-Rha to α-1,6 glycosidic bond was significantly higher than that of α-1,2 glycosidic bond.
pH and the temperature stabilityFigure 2 shows the changes of the recombinant α-L-rhamnosidase N12-Rha activity at different pH and temperatures. It can be seen from Fig. 2A that the optimal pH of N12-Rha reaction is 4.6, and the N12-Rha activity remains above 85% at pH 4–5, however, the enzyme activity is lower than 25% at pH 3 and 8. The results indicate that the recombinant α-L-rhamnosidase N12-Rha is a weakly acidic enzyme, and it is not suitable to react under strong acid and strong base conditions. when the recombinant α-L-rhamnosidase N12-Rha was treated in pH 3–6 at 4 ℃ for 24 h, the activity remained above 80%. The results indicate that N12-Rha has a certain tolerance to acidic environments.
Fig. 3
Effects of metal ions (A), organic solvents B and other effectors C on recombinant α-L-rhamnosidase N12-Rha
Figure 2B shows that the optimal reaction temperature of the recombinant α-L-rhamnosidase N12-Rha is 50 °C, and within the reaction temperature range of 40–60 ℃, the N12-Rha activity remains above 85%, this indicates that N12-Rha is a relatively heat-resistant enzyme. The analysis of the temperature tolerance found that the recombinant α-L-rhamnosidase N12-Rha activity decreased with increasing temperature. When N12-Rha was treated at 20–60 ℃ for 2 h, the activity remained above 80%. But when the temperature exceeds 60 ℃ the N12-Rha activity decreases rapidly. To sum up, the results show that the optimal reaction pH is 4.6 and the optimal reaction temperature of N12-Rha is 50 ℃.
Effects of metal ions, organic solvents and other effectorsAs we all know, the catalytic activity of enzymes will be affected by the metal ions, organic solvents and some effectors in the system. Figure 3A shows that K+, Na+, Ca2+, Ni2+, Co2+, and Mn2+ at the concentrations of 1 mM, 10 mM, 50 mM, 100 mM and 150 mM have little effect on the enzyme activity of N12-Rha. However, the N12-Rha activity is increased by adding 1 mM, 10 mM, 50 mM, 100 mM and 150 mM Mg2+, Fe3+, Fe2+, and Zn2+. Interestingly, when 50 mM Zn2+ is added, the relative enzyme activity of N12-Rha is 149.51%, and the enzyme activity reaches the highest. This result indicates that the hydrolysis process of naringin by N12-Rha requires a certain concentration of Zn2+. Ba2+ at the concentrations of 1 mM, 10 mM, 50 mM, 100 mM and 150 mM has a certain inhibitory effect on the enzyme activity of N12-Rha. 1 mM and 10 mM Cu2+ have no significant effect on the enzyme activity of N12-Rha, but when the concentration of Cu2+ is higher than 10 mM, the enzyme activity of N12-Rha decreases as the concentration of Cu2+ increases. The relative enzyme activity of N12-Rha treated with 150 mM Cu2+ is 45.37%, the enzyme activity is minimized.
Figure 3B shows the enzyme activity change of N12-Rha in the presence of organic solvents (methanol and DMSO). When the methanol concentration is in the range of 0–20% (v/v), the relative activity of N12-Rha remains above 80%, and 2.5% (v/v) DMSO solution has a certain promotion effect on the relative enzyme activity. When the DMSO concentration is in the range of 0–20% (v/v), the relative activity of N12-Rha remains above 50%. In summary, N12-Rha shows better tolerance to organic solvents.
The results showed that EDTA and β-ME at concentrations of 1 mM, 10 mM, 50 mM and 100 mM had almost no effect on the enzyme activity of N12-Rha (Fig. 3C). Only the high concentration of 100 mM DTT reduced the relative enzyme activity to 86.83%. 10 mM, 50 mM and 100 mM SDS reduced the relative enzyme activity to 43.54%, 29.08% and 12.04%, respectively. In summary, the presence of SDS can significantly inhibit the activity of N12-Rha.
Analysis of the substrate structure-specificity relationship through quantum chemistry calculationHesperidin, naringin and myricetrin are used as substrate models for molecular simulation studies because of their differences in glycosidic bond types. The L-rhamnose of hesperidin is connected by α-1,6 glycosidic bond, the L-rhamnose of naringin is connected by α-1,2 glycosidic bond, and the L-rhamnose of myricetrin is directly connected to the heterocyclic ring by α-1,3 glycosidic bond. The structures of hesperidin, naringin and myricetrin were optimized by quantum chemistry calculation methods to obtain a reasonable substrate structure. Molecular orbital theory indicates that the distribution of the highest occupied molecular orbital (HOMO) and the lowest unoccupied molecular orbital (LUMO) plays a key role in the occurrence of molecular reactions (Solov’ev et al. 2018). Figure 4A shows the distribution of the frontier molecular orbitals of the three substrates. The HOMOs and LUMOs of protonated hesperidin and naringin are distributed on their L-rhamnose groups, indicating that the electrons on the L-rhamnose are easier to transfer. The LUMO is not distributed on the L-rhamnose group of protonated myricetrin, indicating that this group is not easy to accept electrons. The energy gap Egap reflects the difficulty of electron transition. The lower the value of Egap, the less likely it is for electrons to transition (Balasubramani et al. 2018). It can be seen from Fig. 4B that the energy gap Egap of myricetrin is significantly smaller than hesperidin and naringin, which shows that myricetrin is more stable than hesperidin and naringin.
Fig. 4
A HOMO and LUMO distribution of protonated substrates. Red: positive, Green: negative. Energy gap B and ionization potential C of protonated substrates. D The C-O charge difference of the three substrate-specific glycosidic bonds
Ionization potential (IP) is a parameter that characterizes the ability of molecules to obtain electrons. Figure 4C shows that the ionization potentials of hesperidin and naringin are significantly smaller than myricetrin, indicating that hesperidin and naringin are easier to obtain electrons. Molecular structure theory indicates that the greater the difference in charge between atoms, the easier it is for electrons to undergo transitions (Li et al. 2014). Figure 4D shows the C-O charge difference of the three substrate-specific glycosidic bonds. The C-O charge difference between the α-1,6 glycosidic bond of hesperidin is the largest, and the C-O charge difference of the α-1,3 glycosidic bond of myricetrin is the smallest. This indicates that the α-1,6 glycosidic bond of hesperidin is the easiest to break, while the C-O bond of the α-1,3 glycosidic bond of myricetrin is the most stable.
MD trajectories analysis of α-L-rhamnosidase and substratesAfter the structure of N12-Rha was optimized, a total of 93.13% of the dihedral angles of ϕ and ψ were within the allowable distribution, which indicates that the model is a normally distribute and has high reliability (Additional file 1: Fig. S2A). The 3D-1D scoring function was used to evaluate the match between the 3D configuration of N12-Rha and the amino acid sequence. Of the residues, 85.35% had an average 3D-1D score greater than 0.2, indicating that the construction of the 3D model of N12-Rha was reasonable (Additional file 1: Fig. S2B).
We performed 20 ns MD simulations on the molecular docking complexes of N12-Rha with hesperidin, naringin and myricetrin, respectively. The root mean square deviation (RMSD) characterizes the average distance between the current structure and the reference structure. If the RMSD changes little over time, it indicates that the system has reached a local equilibrium (Sargsyan et al. 2017). Figure 5A shows the results of the RMSD change with time during the 20 ns simulation. N12-Rha with hesperidin, naringin and myricetrin reached local equilibrium at about 15 ns. In the local equilibrium, N12-Rha with hesperidin has the largest RMSD, while N12-Rha with myricetrin has the smallest RMSD. The root mean square fluctuation (RMSF) characterizes the flexibility of protein molecules and the dynamic difference of each residue (Daghestani et al. 2019). The overall flexibility of N12-Rha with hesperidin and naringin is slightly higher than that of N12-Rha with myricetrin, Especially the changes in residues 200–250 are particularly obvious (Fig. 5B). The radius of gyration (Rg) characterizes the overall size of the protein in the dynamic system (Singh et al. 2018). The Rg of N12-Rha in the hesperidin system is significantly lower than that of the other two systems (Fig. 5C), indicating that other structures have become relatively looser.
Fig. 5
The RMSD (A), RMSF B and Rg C of N12-Rha binds to hesperidin, naringin and myricetrin in MD simulations
Analysis of hydrophobic interaction and hydrogen bondingDuring the MD simulation, the average number of hydrogen bonds between N12-Rha and hesperidin, and between N12-Rha and naringin gradually increased, while the number of hydrogen bonds between N12-Rha and myricetrin gradually decreased after 5 ns (Fig. 6A). The average number of hydrogen bonds of the N12-Rha with hesperidin, naringin and myricetrin were 4.9, 3.7 and 2.5, respectively. These results indicated that N12-Rha could have strong hydrogen bonding interaction with hesperidin and naringin, while the interaction between N12-Rha and myricetrin was weaker. In addition, the non-polar energy has a positive effect on the interaction energy(Kumari et al. 2014). Figure 6B shows the hydrophobic areas of N12-Rha interacting with hesperidin, naringin and myricetrin during the MD simulation, respectively. The average hydrophobic areas of the N12-Rha with hesperidin, naringin and myricetrin were 135.2 nm2, 134.5 nm2 and 130.2 nm2, respectively. Therefore, it is shown that N12-Rha has the strongest hydrophobic interaction with hesperidin and the weakest hydrophobic interaction with myricetrin.
Fig. 6
The hydrogen bond analysis A and hydrophobic area analysis B during 20 ns MD simulation, hydrophobic interaction and hydrogen bonding of hesperidin (C), naringin D and myricetrin E binding to N12-Rha during 15–20 ns MD simulation
Previously, the RMSD showed that the MD system reached local equilibrium at 15–20 ns. Table 2 shows the hydrogen bond occupancy during 15–20 ns MD simulation. Among them, Trp359 and Pro537 showed high hydrogen bond occupancy. Thus, Trp359 and Pro537 are key residues for the hydrogen bonding interaction of N12-Rha with the substrate. Meanwhile, Fig. 6C–E show the formation of hydrophobic interactions and hydrogen bonds of average structures during 15–20 ns MD simulation. It can be seen from Fig. 6C that when hesperidin binds to N12-Rha, Leu209, Ala214, Asp249, Leu251, Trp253 and Arg538 form hydrophobic interactions with hesperidin. Arg248, Tyr293, Trp359 and Pro537 form hydrogen bond interactions with hesperidin. Figure 6D shows that Leu209, Leu251, Trp253, Tyr293, Phe298 and Arg538 form hydrophobic interactions with naringin. Arg248, Asp249, Trp359 and Pro537 form hydrogen bond interactions with naringin. Figure 6E shows that Leu209, Ala214, Leu251, Tyr293, Ser356, Trp359, all form hydrophobic interactions with myricetrin. Arg248, Asp249, Pro537 and Arg538 form hydrogen bond interactions with myricetrin.
Table 2 Hydrogen bond occupancy during 15–20 ns MD simulation MM-PBSA interaction energy between α-L-rhamnosidase and substrateMolecular mechanics Poisson-Boltzmann surface area (MM-PBSA) is a method used to calculate the interaction energy after the molecular dynamics of the receptor and the ligand. The calculated interaction energy can be used to reflect the ligand and the receptor combined stability (Westermaier et al. 2017). Table 3 lists the interaction energy between N12-Rha and hesperidin, naringin and myricetrin and the energy value of each component. This indicates that the affinity of N12-Rha for the three substrates is ranked from high to low: hesperidin > naringin > myricetrin, which is consistent with the above experimental results. The interaction between N12-Rha and hesperidin and naringin is dominated by van der Waals forces. Coulomb electrostatic interaction and non-polar solvation energy contribute little to the interaction energy.
Table 3 Interaction energy of the N12-Rha with hesperidin, naringin and myricetrin based on MM-PBSA analysis, respectivelyObviously, the key residues that have a greater contribution to hydrogen bond formation and hydrophobic interactions are concentrated in the (α/α)6-barrel domain (Glu183-Thr557) of N12-Rha, which indicates that the (α/α)6-barrel domain is the catalytic domain of N12-Rha. Figure 7 shows the residues in the (α/α)6-barrel domain of N12-Rha that contribute significantly to the total interaction energy. Arg248, Asp249, Tyr293, Pro537 and Arg538 make positive contributions to the interaction of N12-Rha to the three substrates. Meanwhile, Trp359 make a positive contribution to the interaction of N12-Rha to hesperidin and naringin, while making a negative contribution to the interaction between N12-Rha and myricetrin.
Fig. 7
Interaction energies of the hesperidin and naringin, myricetrin with N12-Rha ((α/α)6-barrel domain) based on MM-PBSA analysis during 15–20 ns MD simulation
留言 (0)