
記住我


Robot-assisted spine surgery is slowly gaining widespread acceptance among spine surgeons worldwide. There are many reports in the literature attesting to the various advantages of using robots in spine surgery. Decreasing intraoperative radiation time/exposures (even up to 70%),1–4 while improving the accuracy of pedicle screw insertion,5–8 are some advantages reported in most studies. However, little is known about the factors affecting the accuracy of robot-assisted screw placement. The aim of the current study is to determine the effects of potential patient and implant factors on the accuracy of robot-assisted pedicle screw insertion and their contribution to variation observed in screw accuracy both anatomically and compared to virtual surgeon plans.
MATERIALS AND METHODSThis is a multicenter, retrospective study of patients who had undergone posterior spinal fixation for various spinal pathologies at three different surgical centers. All pedicle screws were inserted with the use of a robotic navigation system (ExcelsiusGPS; Globus Medical Inc., Audubon, PA), Supplemental Digital Content 1, https://links.lww.com/BRS/B944. Characteristics of the three centers involved in the study could be found in supplemental online digital content, Supplemental Digital Content 2, https://links.lww.com/BRS/B945. All these centers had previously obtained Institutional Review Board or Ethics Committee approvals. Outcomes of surgeries at each center had previously been published or presented, either in whole or in part.9–11 The current study pooled the radiographic and clinical data from the three centers to analyze them and reach a more generalizable conclusion regarding the factors affecting the accuracy of robot-assisted pedicle screw insertion. Only cases with a complete data set were included in the analysis. Demographic and intraoperative data were collected from all centers. All patients had preoperative and postoperative computed tomography (CT) imaging.
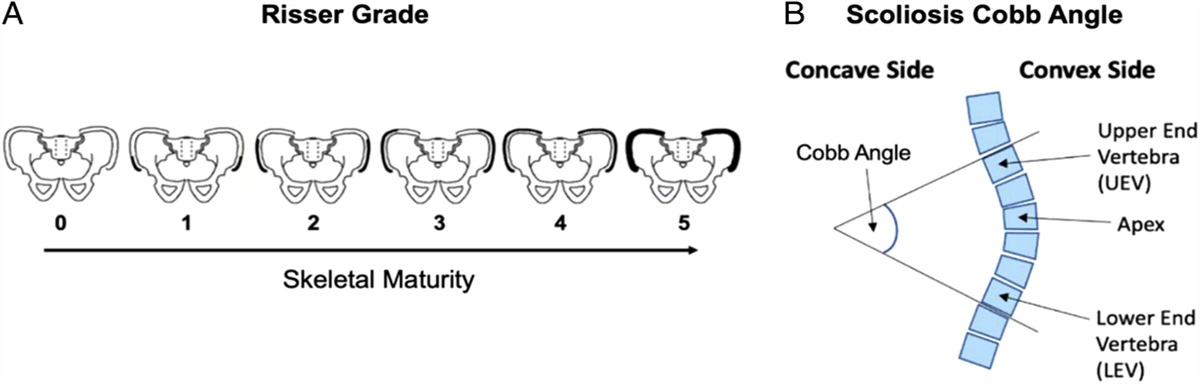
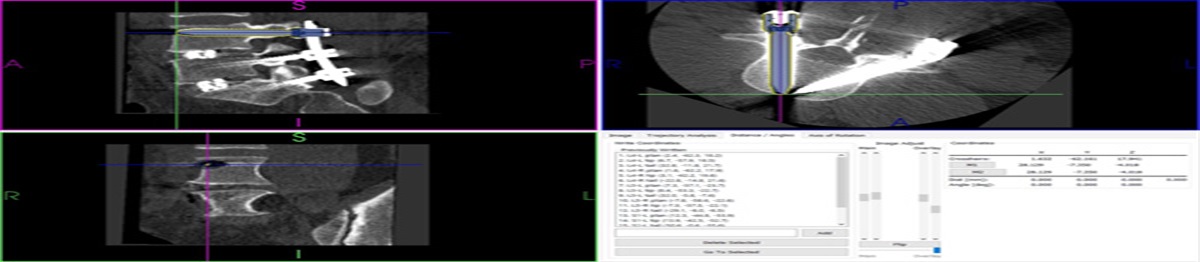
The primary outcome measure was accuracy of screw placement with use of the robot. This accuracy was measured by two means. First, offsets between the placed and preoperatively planned screws’ tips, tails (entry points), and angular trajectories were determined.12 The preoperatively planned trajectories for the pedicle screws were later digitally overlaid upon postoperative CT images of the placed screws. The offsets between the tip, tail, and trajectory angulations were then calculated for each screw (Fig. 1). Second, accuracy of the placed screws was graded and reported according to the Gertzbein-Robbins grading system (GRS).13 Pedicle screws were graded A if there was no breach of the pedicle walls, B if there was <2 mm, C if there was <4 mm, D if there was <6 mm, and E if there was more than 6 mm of pedicle wall breach.
 FIGURE 1:
 Calculation of L4 right pedicle screw offsets by the software.
Statistical AnalysisTo determine the effect of multiple predictors on the relative accuracy of robot-assisted pedicle screw placements as measured by screw offsets from preoperatively planned to placed trajectories, the authors used multivariable regression analysis with patient-level mixed-effects modeling to account for multiple screws from the same patient. Square root transformation on offset outcomes was used to address heteroscedasticity, the increase in variance of the estimated with the estimates themselves. Regression fits, using all variables, were made for the complete model involving all terms in each of the three cases (tip, tail, offset), and then pruned of terms that did not improve predictive value, based on Akaike information criterion—a combination of model error and model complexity. For GRS grading (an ordinal scale), the authors used ordinal regression, again with mixed effects.
To make the analysis adequately powered, the authors limited the analysis to subgroups with adequate sample sizes. As such, the underweight subgroup of patients [with body mass index (BMI) of <18.5 kg/m2] and screws at S2 and thoracic levels (with the exception of T12) were excluded from the final analysis.
Analysis was done using the R statistical language (the R Foundation for Statistical Computing, Vienna, Austria), version 4.1,14 with the “lmerTest” package for regression with continuous outcomes15 and the “ordinal” package for ordinal regression.16
RESULTSThe distribution of different variables in the pooled cohort is displayed in Tables 1 and 2. Surgeon 1 had the highest number of cases; surgeon 2’s patients were younger and less overweight, while surgeon 3 tended toward shorter constructs, and surgeons 2 and 3 tended toward larger screw offsets. Surgeon 1 used intraoperative CT as the robotic workflow, while the other two surgeons used preoperative CT as the preferred workflow with the robot.
TABLE 1 - Distribution of Patient-Related Variables by Surgeon Surgeon (number of cases) 1 (N=338), n (%) 2 (N=127), n (%) 3 (N=72), n (%) Total (N=537), n (%) Gender Female 177 (52.4) 44 (34.6) 38 (52.8) 259 (48.2) Male 161 (47.6) 83 (65.4) 34 (47.2) 278 (51.8) Age in years Mean (SD) 67.2 (10.0) 51.5 (11.9) 63.5 (11.2) 63.0 (12.5) Median (minimum, maximum) 69.0 (23.0, 91.0) 51.0 (23.0, 81.0) 64.5 (21.0, 84.0) 66.0 (21.0, 91.0) Missing 1 (0.3) 0 0 1 (0.2) BMI in kg/m2 Mean (SD) 29.3 (5.3) 25.5 (3.9) 31.5 (6.6) 28.7 (5.5) BMI categories 18.5–24.9 kg/m2 71 (21.0) 66 (52.0) 10 (13.9) 147 (27.4) 25–29.9 kg/m2 134 (39.6) 50 (39.3) 24 (33.3) 208 (38.7) ≥30 kg/m2 133 (39.4) 11 (8.7) 38 (52.8) 182 (33.9) Screws per case Mean (SD) 5.6 (2.3) 5.8 (1.8) 4.6 (1.1) 5.5 (2.1) Median (minimum, maximum) 6.0 (2.0, 14.0) 6.0 (4.0, 14.0) 4.0 (4.0, 8.0) 6.0 (2.0, 14.0)BMI indicates body mass index.
GRS indicates Gertzbein-Robbins grading system.
To account for variability among the centers, the authors did a multivariate regression analysis, with mixed-effect modeling and square root transformation of outcomes, to determine the effect of each predictor on the screw offsets. Table 3 displays the significant factors affecting the screw offsets. Obese (BMI ≥ 30 kg/m2) and overweight patients (25≤BMI ≤ 29.9 kg/m2), longer constructs (estimate: 0.01, 95% CI: 0–0.02), and S1 levels (estimate: 0.23, 95% CI: 0.01–0.46) were significantly associated with higher tip offsets. However, higher tail offsets (entry point offset) were significantly associated with surgeons 2 and 3 (estimate: 0.27, 95% CI: 0.22–0.32; estimate:0.15, 95% CI:0.09–0.21, respectively), the L1 level (estimate: 0.23, 95% CI: 0.03–0.43), obese and overweight patients (estimate: 0.13, 95% CI: 0.07–0.18; estimate: 0.08; 95% CI: 0.03–0.13, respectively) longer constructs (estimate: 0.01, 95% CI: 0.00–0.02) and females (estimate: 0.1, 95% CI: 0.06–0.13). Higher angular offsets were significantly associated with surgeons 2 and 3 (estimate: 0.29, 95% CI: 0.22–0.35; estimate: 0.2, 95% CI: 0.12–0.28, respectively) overweight patients (estimate: 0.08, 95% CI: 0.02–0.15), long constructs (estimate: 0.02, 95% CI: 0.01–0.03) and females (estimate: 0.13, 95% CI: 0.08–0.18). Although these variables were significantly associated with various screw offsets, their contributions to offset variability were not of the same magnitude. Table 4 displays the relative contribution of different significant variables to the overall variability of the outcome obtained by the sum of squares and F test. The sum of squares column represents the contribution of each variable to the overall outcome variability. So, for tail and angular offset, the surgeon had the largest impact.
TABLE 3 - Model Results—Reference is Female, Surgeon 1, T12, and Normal Weight (18.5≤ BMI ≤24.9 kg/m2) Variables Square Root (tip offset) Square Root (tail offset) Square Root (angular offset) E CI P E CI P E CI P Intercept 1.44 1.12–1.75 <0.001 0.99 0.80–1.19 <0.001 1.26 1.01–1.51 <0.001 Gender (male) −0.10 −0.13–0.06 <0.001 −0.13 −0.18–0.08 <0.001 BMI (overweight) 0.08 0.02–0.14 0.011 0.08 0.03–0.13 0.002 0.08 0.02–0.15 0.009 BMI (obese) 0.10 0.04–0.16 0.002 0.13 0.07–0.18 <0.001 0.07 −0.00–0.13 0.059 Surgeon 2 0.27 0.22–0.32 <0.001 0.29 0.22–0.35 <0.001 Surgeon 3 0.15 0.09–0.21 <0.001 0.20 0.12–0.28 <0.001 Screw number 0.01 0.00–0.02 0.031 0.01 0.00–0.02 0.042 0.02 0.01–0.03 0.004 L1 0.04 −0.21–0.28 0.760 0.23 0.03–0.43 0.025 0.20 −0.07–0.46 0.151 L2 −0.05 −0.28–0.18 0.670 0.09 −0.09–0.28 0.331 −0.04 −0.29–0.21 0.748 L3 −0.15 −0.37–0.07 0.176 0.09 −0.09–0.27 0.336 −0.11 −0.35–0.13 0.366 L4 −0.13 −0.35–0.09 0.251 0.10 −0.08–0.28 0.276 −0.11 −0.35–0.12 0.351 L5 −0.08 −0.30–0.14 0.494 0.10 −0.08–0.28 0.280 −0.08 −0.32–0.16 0.515 S1 0.23 0.01–0.46 0.039 0.14 −0.05–0.32 0.141 0.10 −0.14–0.34 0.429 Random effects Tip offset Tail offset Angular offset σ2=error variance 0.22 0.15 0.27 τ2=patient-level variance 0.03 0.02 0.03 ICC=τ2/(τ2+σ2) 0.13 0.12 0.09 Number of patients 537 537 537 Number of screws 2936 2937 2937 Marginal R 2/conditional R 2 0.06/0.18 0.07/0.185 0.08/0.16BMI indicates body mass index; ICC, intraclass coefficient coordination; E, estimate.
BMI indicates body mass index.
It has been determined that for tip offset, the main contributing factor is vertebral level (Table 4). Among the vertebral levels, L3 had the least tip offsets (Table 3), while for tail and angular offset, the surgeon is the main contributing factor (Table 4). Surgeon 1 (contributed the highest number of cases) had the significantly least angular and tail offsets of the surgeons. However, despite the statistically significant associations between these variables and the screw offsets, the total impact of all these variables on the outcome is minimal as reflected by a low marginal R2 (Table 3). This correlation coefficient is the proportion of the variation of the outcome explained by the variables. So, the total effect of all the variables is 6% on tip, 7% on tail, and 8% on angular offset. Also, shown in Table 3 is the conditional R2 which, statistically, is the combination of marginal R2 and intraclass coefficient coordination, and is the proportion of the outcome variability explained by both the variables and case-level effect (logistics of the surgery, etc.). The effect size of this coefficient is only 0.18 for tip and tail offset, and 0.16 for angular offset.
To investigate the effects of different variables on the accuracy of robot-placed pedicle screws graded by GRS, the authors did ordinal regression analysis with mixed effects. Significant variables were gender (Log odds: 0.62, 95% CI: 0.38–0.85, P<0.001), age (Log odds: 0.02, 95% CI: 0.01–0.03, P=0.02), length of constructs (Log odds: 0.07, 95% CI: 0.02–0.11, P=0.008), screw diameter (Log odds: 0.55, 95% CI: 0.39–0.71, P<0.001), and length of the screws (Log odds: 0.03, 95% CI: 0.01–0.05, P=0.009). However, because of a low R2 estimate (0.07), these variables, regardless of their significant association with screw placement accuracy, had little effect on the variability of accuracy itself.
DISCUSSIONRobot-assisted procedures were recently introduced into the field of spine surgery. While performance differences between systems have been anecdotally reported, the factors affecting implant placement, have not been robustly considered. This study focuses on one particular platform, but future research should focus broadly on multiple platforms and procedural types. Generally, robots have been used to assist with pedicle screw and interbody cage placement, but reports in the literature extend this to taking samples from the spine, as well as bony resections in deformity correction osteotomies.17 Almost all studies, with the exception of a very few,18,19 have reported a higher accuracy rate of pedicle screw placement using robot assistance versus conventional freehand methods. All of the exceptions reported on an earlier generation of robots.
Currently, there is good evidence, involving many level I studies with consistent findings, that robot-assisted spine surgery improves pedicle screw placement.20,21 The high accuracy rate of robot-assisted pedicle screw placement may be affected by different factors. One of the main factors may be the skill of the surgeon performing the procedure. Multiple studies have indicated the presence of a learning curve with robot-assisted surgeries.22 Avrumova and colleagues reported after the first few cases, the surgeon needed less time to insert the screws with a robot.23 In another study,24 the rate of pedicle wall breaches was lower in the second half of cases than in the first half. In the present study, the surgeon factor was significant in tail (entry point) and angular offset, but was not significant in tip offset.
The purpose of this study was to evaluate the role of several common implant and patient factors potentially affecting pedicle screw placement accuracy, as it relates to anatomic screw position (as evaluated by GRS), and intended screw plan (as evaluated by offset values). While this investigation applies to common demographic and implant-related factors, other specific procedural steps may further account for explanation of inaccuracies, that is, a surgeon’s skill comes into play when planning for the screw entry point and applying sufficient pressure for drilling.
In general, neither patient-related variables (such as gender, age or BMI), nor screw-related ones (such as vertebral level, length of construct, or screw size) had a sizable effect on the accuracy of robot-assisted pedicle screw placement, despite statistically significant associations between variables and outcomes. In fact, collectively, they accounted for only 18% of the model contribution to the plan-to-place accuracy. Moreover, when considering anatomical pedicle breach, the same variables accounted for only 7% of the model.
Despite this robustness, there were specific correlations that were shown to be significant. For tip, tail, and angular offsets, construct length, female gender, and BMI were significant. Interestingly, screw tip offset was correlated with the S1 level, while screw tail offset was significantly associated with L1 level. Although the exact reason for this finding is not known, it may be related to the very different anatomy and bone quality of L1 versus S1 vertebrae.
BMI was a statistically significant factor in the tail, tip, and angular offsets. Excess pressure of the soft tissue on the cannula (resulting from a higher BMI) may cause the entry point, screw tip, and/or angular trajectory to deviate from the planned trajectory. This effect is minimized by using minimally invasive surgical techniques, as open techniques (especially midline approaches) cause more pressure on the cannulas.25 Although statistically significant, BMI’s effect, as shown in Table 4, was small, and BMI’s contribution to the overall variability of accuracy of screws inserted by the robot was trivial (the sum of squares was between 1.9 and 3.3 for different offsets).
Gender was a statistically significant factor, with a small effect size on screw accuracy. More screw offsets and pedicle wall breaches occurred in females than in males (P<0.01). This may be attributed to the higher prevalence of osteoporosis in the female group due to the postmenopausal status of many subjects. Whatever the reason, the effect of this factor on the overall accuracy of screws placed with the robot was minimal.
留言 (0)