
記住我

Atrial fibrillation is the most common sustained arrhythmia and an established risk factor of stroke, heart failure and mortality [1,2]. There are estimated 33.5 million individuals having atrial fibrillation globally, and the prevalence in middle-aged and older population is significantly higher [3,4]. The prevalence of atrial fibrillation is 1.07, 1.29 and 2.35% in Chinese population aged 55–64, 65–74 and at least 75 years, respectively [4], and 7.7% in European population aged at least 55 years [5]. As the deepening of aging process, atrial fibrillation would become a major public health problem and cause serious socioeconomic burden [6]. Early identification of atrial fibrillation risk factors in aged adults is an essential mean for atrial fibrillation reduction.
Blood pressure (BP) is strongly associated with the occurrence of atrial fibrillation [7]. As BP fluctuates over time, BP variability has been recognized as an important marker addition to BP level. In recent years, the association between SBP variability and cardiovascular diseases was of increasing interest. However, evidence on the association between visit-to-visit variability of SBP and risk of atrial fibrillation is limited. A systematic review including 14 randomized controlled trials reported that higher BP variability was not related with risk of atrial fibrillation [8]. However, this result was generated in patients who underwent randomized antihypertensive treatment, and may not be generalizable to other population. Another cohort study demonstrated that individuals in the highest quartile of visit-to-visit variability of SBP were associated with slightly increased risk of incident atrial fibrillation compared with those in the lowest quartile [9]. Although, this cohort only included Korean population and the findings still need to be validated in population from other geographic regions. Therefore, we aimed to explore the association between visit-to-visit variability of SBP and risk of incident atrial fibrillation in middle-aged and older population using data from the Kailuan cohort study.
MATERIALS AND METHODS Study populationKailuan study is a prospective community-based cohort study that was conducted in Tangshan, northern China. The detailed design has been described previously [10,11]. Briefly, a total of 101 510 participants were enrolled from June 2006 to October 2007 and underwent questionnaire assessments, physical examinations and laboratory tests. Resurveys were conducted every 2 years thereafter. In the current study, 29 197 participants who were aged at least 50 years in the 2006–2007 survey and participated the biennial resurveys of 2008–2009 and 2010–2011 were included. We further excluded 1906 participants who had incomplete data on SBP, and 292 participants who had history of atrial fibrillation before the resurvey of 2010–2011. Finally, the remaining 26 999 participants were eligible for the current analyses. The study protocol was approved by the ethics committee of Kailuan General Hospital. All participants provided their informed written consents.
Assessment of visit-to-visit variability of SBPBlood pressure was measured at least two times using calibrated mercury sphygmomanometer by trained physicians and nurses, and was measured again if the difference between the two measurements was at least 5 mmHg. All participants were required to rest in a sitting position at least 5 min before measurement. The final blood pressure was calculated as the average value of the measurements. We used average real variability (ARV) of blood pressure measurements in 2006, 2008 and 2010 surveys to assess the visit-to-visit variability of SBP. ARV is the average of absolute differences between consecutive measurements and calculated as [|SBP2008 − SBP2006| × (time2008 − time2006) + |SBP2010 − SBP2008| × (Time2010 − Time2008)]/(Time2010 − Time2006) [12]. In the current study, we also assessed the variability of SBP using standard deviation (SD), coefficient of variation and variability independent of mean (VIM) for further analyses. VIM was calculated as the SD divided by the mean to the power of X. Power X was modeled as SD = k × meanX and was derived from fitting curves by nonlinear regression analysis [12].
Data collection and definitionsData on demographic covariates, including age, sex, height, weight, lifestyles, and medical history was collected via standardized questionnaire and anthropometric measurements. BMI was calculated as body weight (kg) divided by the square of height (m2). Smoking status and drinking status were categorized as never, past and current. Heart rate was measured via 12-lead ECG. Laboratory tests included fasting blood glucose (FBG), triglycerides, total cholesterol (TC), serum creatinine, and C-reactive protein (CRP). All blood samples were collected after an overnight fast and analyzed by an auto-analyzer (Hitachi 747; Hitachi). The estimated glomerular filtration rate (eGFR) was calculated using the Chronic Kidney Disease Epidemiology Collaboration creatinine equation [13]. According to the seventh Joint National Committee recommendation, hypertension was defined as BP measurement at least 140/90 mmHg, or self-reported use of antihypertensive medications [14].
Incidence of atrial fibrillationIncident atrial fibrillation was determined by standard 12-lead ECG during the resurveys. Individuals who met the following criteria were identified as atrial fibrillation cases [15]: irregular RR intervals; absence of distinct P waves, regular atrial electrical activity may be seen in some ECG leads; atrial cycle length was usually variable and less than 200 ms (>300 beats/min). Two cardiologists independently reviewed all ECGs. In addition, we also collected information on atrial fibrillation diagnosis via medical records from Municipal Social Insurance Institution database and discharge registers from all 11 Kailuan hospitals, which covered all participants in Kailuan study. The incident atrial fibrillation case was defined as the first occurrence of atrial fibrillation during the follow-up. Participants were followed for atrial fibrillation or death until 31 December 2020.
Statistical analysesAll participants were categorized according to the quartiles of the ARV of SBP across three visits. Continuous variables were exhibited as mean ± SD or median (interquartile range) according to distribution and compared using one-way analysis of variance or Kruskal–Wallis test as appropriate. Categorical variables were described as N (percentages) and compared using chi-square test.
We used Cox proportional hazards regression model to estimate the hazard ratios and 95% confidence intervals (CI) according to the quartiles of SBP variability. Multivariate-adjusted model was adjusted for age, sex, smoking status, drinking status, antihypertensive medication use, BMI, SBP, DBP, heart rate, FBG, triglycerides, TC, eGFR, and CRP. The proportional hazards assumption was checked by using Schoenfeld residuals. We used restricted cubic splines to examine the relationship between the ARV of SBP as a continuous variable and the risk of atrial fibrillation after adjusting for potential confounders.
To test the robustness and consistency of our results, we conducted several sensitivity analyses. First, to further validate the results of our study, we assessed visit-to-visit variability using SD, coefficient of variation, and VIM. Second, we conducted an analysis taking into account the competing risk of death. Third, given the effect of cardiovascular diseases (CVD) on SBP variability and incident atrial fibrillation, we excluded participants having CVD (including myocardial infarction, stroke and heart failure) before 2010 in a sensitivity analysis. Fourth, to rule out the effect of antihypertensive agents on the variability of SBP, we excluded participants with antihypertensive agents use during 2006 to 2010. Lastly, we excluded participants who had atrial fibrillation events within the first year of the follow-up to minimize potential reverse causation. In addition, we also performed stratified analyses to explore the potential interaction between visit-to-visit variability of SBP and age, sex, and hypertension. Two-sided P value less than 0.05 was considered statistically significant. All statistical analyses were conducted using SAS version 9.4 (SAS Institute, Cary, North Carolina, USA).
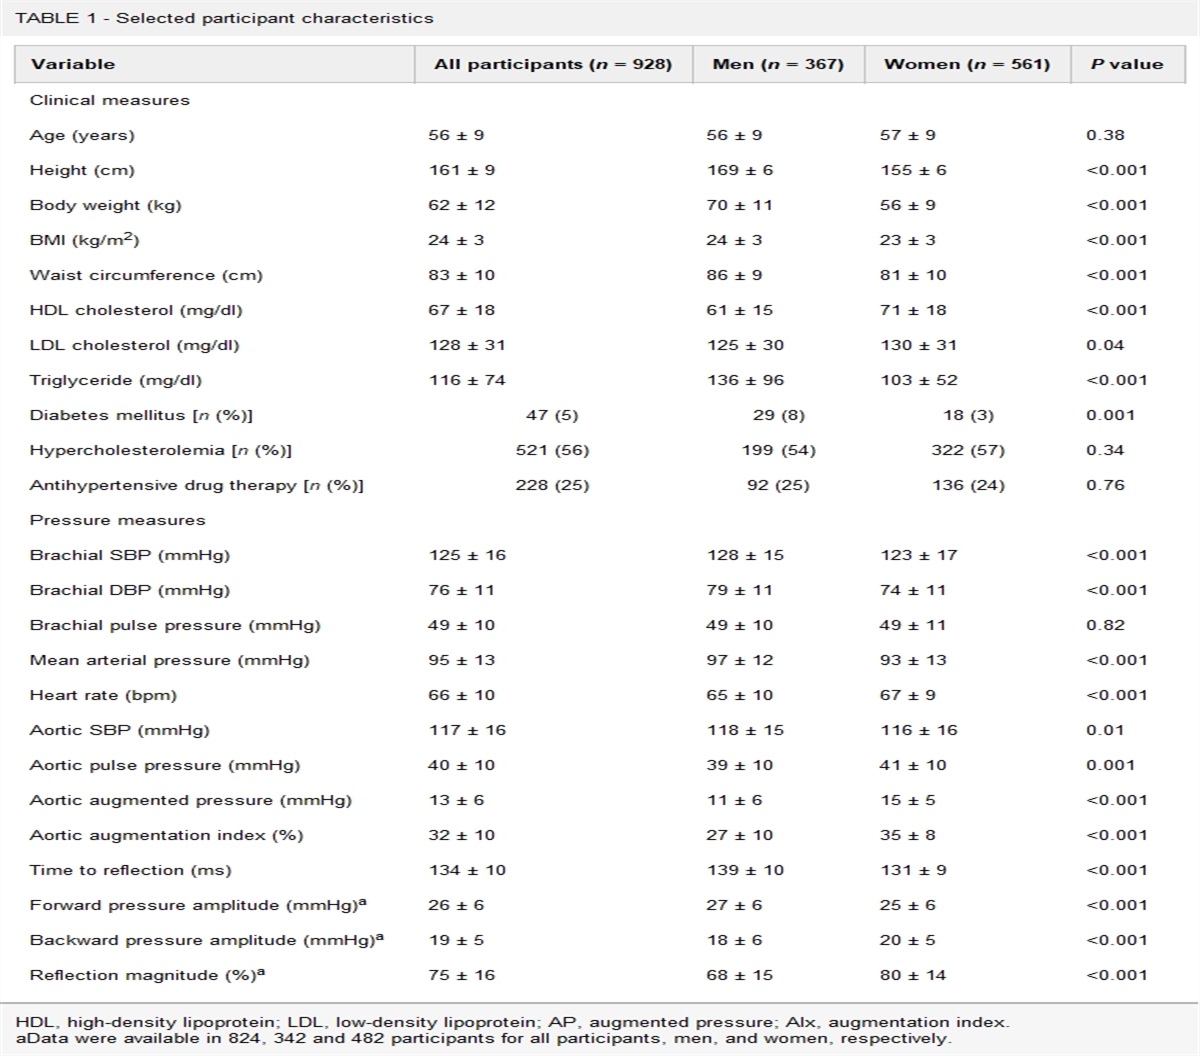
RESULTSOf 26 999 participants included in the present study, 79.14% (21,366) were men and 20.86% (5633) were women. The mean age at the beginning of the follow-up was 63.24 ± 7.49 years. The ARV ranges according to the quartiles were as follows: quartile 1, ARV 7.64 or less; quartile 2, 7.64 < ARV ≤ 12.69; quartile 3, 12.69 < ARV ≤ 19.54; quartile 4, ARV greater than 19.54. Relative to those with lower quartile groups, participants in the highest quartile were older, and had lower proportions of unhealthy lifestyles and a higher proportions of antihypertensive agents use. They also had higher BMI, SBP, DBP, heart rate, higher serum concentrations of FBG, CRP and lower level of eGFR (Table 1).
TABLE 1 - Characteristics of participants according to the quartiles of visit-to-visit variability of SBP during 2006 to 2010 Variables Quartile 1 Quartile 2 Quartile 3 Quartile 4 P value No. of participants 6758 6736 6757 6748 − Age (years) 62.40 ± 7.18 62.72 ± 7.25 63.37 ± 7.48 64.47 ± 7.87 < 0.01 Men N (%) 5369 (79.45) 5330 (79.13) 5358 (79.30) 5309 (78.68) 0.71 Smoking status N (%) < 0.01 Never 4481 (66.31) 4484 (66.57) 4585 (67.87) 4712 (69.83) Past 357 (5.28) 381 (5.66) 391 (5.79) 386 (5.72) Current 1920 (28.41) 1871 (27.78) 1780 (26.35) 1650 (24.45) Drinking status N (%) < 0.01 Never 4781 (70.75) 4849 (71.99) 4911 (72.69) 5060 (74.99) Past 72 (1.07) 62 (0.92) 55 (0.81) 56 (0.83) Current 1905 (28.19) 1825 (27.09) 1790 (26.49) 1632 (24.18) Antihypertensive agents use N (%) 1497 (22.17) 1716 (25.50) 2026 (30.05) 2606 (38.69) < 0.01 BMI (kg/m2) 25.08 ± 3.24 25.25 ± 3.23 25.40 ± 3.38 25.43 ± 3.36 < 0.01 SBP (mmHg) 132.03 ± 16.52 135.35 ± 18.19 139.07 ± 19.84 144.29 ± 23.32 < 0.01 DBP (mmHg) 83.69 ± 9.85 84.69 ± 10.37 86.15 ± 10.96 87.67 ± 12.07 < 0.01 Heart rate (beats per minute) 72.14 ± 10.17 72.26 ± 10.36 72.77 ± 10.69 73.09 ± 11.02 < 0.01 FBG (mmol/l) 5.76 ± 1.65 5.76 ± 1.60 5.84 ± 1.66 5.92 ± 1.74 < 0.01 TG (mmol/l) 1.23 (0.90, 1.80) 1.23 (0.89, 1.79) 1.25 (0.91, 1.81) 1.24 (0.91, 1.79) 0.31 TC (mmol/l) 5.10 ± 1.03 5.08 ± 1.03 5.12 ± 1.05 5.11 ± 1.08 0.27 eGFR (ml/min per 1.73m2) 84.39 ± 16.80 83.72 ± 17.32 82.59 ± 19.29 80.10 ± 19.02 < 0.01 CRP (mg/l) 1.18 (0.60, 2.70) 1.20 (0.60, 2.70) 1.20 (0.67, 2.83) 1.40 (0.70, 3.10) < 0.01Continuous variables were presented as mean ± standard deviation or median (interquartile range) according to distribution.BMI, body mass index; CRP, C-reactive protein; DBP, diastolic blood pressure; eGFR, estimated glomerular filtration rate; FBG, fasting blood glucose; SBP, systolic blood pressure; TC, total cholesterol; TG, triglyceride.
During the average follow-up of 9.24 years, a total of 420 cases of new-onset atrial fibrillation were identified. The incidence rates of atrial fibrillation (per 1000 person-year) consistently increased with higher quartile groups of SBP variability (Table 2). The Kaplan–Meier cumulative risk for atrial fibrillation within groups was presented in Fig. 1. After adjustment for potential confounders, participants in the highest quartile of variability showed 53% higher risk of atrial fibrillation compared with those in the lowest quartile (hazard ratio 1.53; 95% CI 1.15–2.04). Participants in the third quartile also experienced a significantly higher risk of atrial fibrillation (hazard ratio 1.35; 95% CI 1.01–1.82) (Table 2). We observed a dose–response relationship between SBP variability and risk of atrial fibrillation (P for trend <0.05), which was further supported by restricted cubic spline regression analysis (Fig. 2).
TABLE 2 - Hazard ratios (95% confidence interval) for incident atrial fibrillation according to the quartiles of visit-to-visit variability of SBP during 2006–2010 Visit-to-visit SBP variability, HR (95% CI) Atrial fibrillation Quartile 1 Quartile 2 Quartile 3 Quartile 4 P-trend Cases, No. 78 97 112 133 Incidence rates, per 1000 person-years 1.23 1.53 1.81 2.19 Model 1 1 [Reference] 1.25 (0.93–1.68) 1.48 (1.11–1.97) 1.80 (1.36–2.38) <0.01 Model 2 1 [Reference] 1.22 (0.91–1.65) 1.40 (1.05–1.87) 1.60 (1.21–2.12) <0.01 Model 3 1 [Reference] 1.21 (0.90–1.64) 1.35 (1.01–1.82) 1.53 (1.15–2.04) <0.01 Model 3 using SD 1 [Reference] 1.12 (0.84–1.51) 1.22 (0.91–1.62) 1.39 (1.04–1.85) 0.02 Model 3 using CV 1 [Reference] 0.99 (0.74–1.31) 1.05 (0.79–1.40) 1.34 (1.02–1.75) 0.02 Model 3 using VIM 1 [Reference] 1.08 (0.82–1.43) 1.07 (0.81–1.42) 1.29 (0.98–1.69) 0.08 Competing risk model 1 [Reference] 1.22 (0.90–1.65) 1.34 (1.00–1.79) 1.49 (1.11–2.00) <0.01 Model 3 excluding participants having CVD before 2010 1 [Reference] 1.23 (0.89–1.72) 1.30 (0.94–1.80) 1.50 (1.09–2.06) 0.01 Model 3 excluding participants with antihypertensive agents use during 2006 to 2010 1 [Reference] 1.39 (0.95–2.02) 1.47 (1.01–2.12) 1.52 (1.05–2.21) 0.03 Model 3 excluding participants with AF events within the first year of the follow-up 1 [Reference] 1.22 (0.90–1.65) 1.33 (0.99–1.79) 1.46 (1.09–1.96) <0.01Model 1 was nonadjusted model; model 2 was adjusted for age (years) and sex; model 3 was further adjusted for smoking status (never, past, or current), drinking status (never, past, or current), antihypertensive agents use (yes or no), BMI, SBP, DBP, heart rate, fasting blood glucose, triglycerides, total cholesterol, estimated glomerular filtration rate and C-reactive protein. AF, atrial fibrillation; CI, confidence interval; CV, coefficient of variation; CVD, cardiovascular disease; HR, hazard ratio; SD, standard deviation; VIM, variability independent of mean.
 FIGURE 1:
 Kaplan–Meier estimates of cumulative incidence of atrial fibrillation according to the quartile groups of SBP variability across three visits. The ARV ranges for the four quartile groups were: quartile 1, ARV 7.64 or less; quartile 2, 7.64 < ARV ≤ 12.69; quartile 3, 12.69 < ARV ≤ 19.54; quartile 4, ARV greater than 19.54. ARV, average real variability.
 FIGURE 2:
 The hazard ratios and 95% confidence intervals of SBP variability for incident atrial fibrillation using restricted cubic spline regression. Restricted cubic spline regression was conducted using three knots with placed at the 5th, 50th, and 95th percentiles of the ARV of SBP. The red solid line represented hazard ratio and the blue dashed lines represented 95% confidence interval. The reference line was placed at the 25th percentiles of the ARV of SBP. ARV, average real variability.
Higher quartile of SBP variability was associated with increased atrial fibrillation risk when assessing variability using SD and CV (Table 2). Similar results were also generated after considering the competing risk of death, excluding participants with history of CVD, excluding participants with antihypertensive agents use, and excluding participants who had atrial fibrillation events within the first year of the follow-up period (Table 2). There is no significant interaction between SBP variability and age, and sex. However, the association with atrial fibrillation was observed to be stronger in participants without hypertension, relative to those with hypertension (P interaction = 0.03) (Table 3).
TABLE 3 - Hazard ratios (95% confidence interval) for incident atrial fibrillation according to the combined categories of visit-to-visit variability of SBP and age, sex, and hypertension Visit-to-visit SBP variability, HR (95% CI) Quartile 1 Quartile 2 Quartile 3 Quartile 4 P-interaction Age (years) <65 (n = 17 968)a 1 [Reference] 1.18 (0.78–1.78) 1.05 (0.68–1.61) 1.50 (1.00–2.25) 0.34 ≥65 (n = 9031)a 1 [Reference] 1.64 (1.09–2.49) 1.85 (1.23–2.78) 1.58 (1.04–2.42) Sex Women (n = 5633) b 1 [Reference] 1.10 (0.42–2.85) 2.73 (1.22–6.12) 2.54 (1.12–5.76) 0.09 Men (n = 21 366)b 1 [Reference] 1.22 (0.89–1.67) 1.21 (0.88–1.67) 1.43 (1.05–1.95) Hypertension No (n = 11 055)c 1 [Reference] 0.99 (0.56–1.77) 1.68 (1.00–2.82) 2.22 (1.36–3.64) 0.03 Yes (n = 15 944)c 1 [Reference] 1.13 (0.80–1.60) 1.16 (0.83–1.64) 1.34 (0.96–1.88)CI, confidence interval; HR, hazard ratio.
aAdjusted for sex, smoking status (never, past, or current), drinking status (never, past, or current), antihypertensive agents use (yes or no), BMI, SBP, DBP, heart rate, fasting blood glucose, triglycerides, total cholesterol, estimated glomerular filtration rate and C-reactive protein.
bAdjusted for age (years), smoking status (never, past, or current), drinking status (never, past, or current), antihypertensive agents use (yes or no), BMI, SBP, DBP, heart rate, fasting blood glucose, triglycerides, total cholesterol, estimated glomerular filtration rate, and C-reactive protein.
cAdjusted for age (years), sex, smoking status (never, past, or current), drinking status (never, past, or current), BMI, heart rate, fasting blood glucose, triglycerides, total cholesterol, estimated glomerular filtration rate, and C-reactive protein.
In this large community-based cohort study, we found that higher visit-to-visit variability of SBP was associated with increased risk of developing atrial fibrillation in middle-aged and older population over 9.24 years of follow-up. The results persisted after adjusting for potential confounders (including mean BP) and across sensitivity analyses. According to the stratified analyses, the association between SBP variability and atrial fibrillation risk was more significant in participants without hypertension.
Independent of mean SBP, visit-to-visit variability of SBP has been well recognized as a risk factor of cardiovascular diseases, kidney impairment, cognitive decline, and loss of life [16–20]. Although, to the best of our knowledge, only two prospective studies investigated the association of SBP variability with incident atrial fibrillation. In consistence with our findings, a population-based study in Korea suggested that individuals in the highest quartile of SBP variability was associated with 6% higher risk of atrial fibrillation relative to those in the lowest quartile [9]. However, the atrial fibrillation cases in this previous study were obtained only from claims data, while we collected incident atrial fibrillation cases from medical insurance records, discharge registers and ECG examinations in biennial resurveys to minimize the neglect of asymptomatic atrial fibrillation. In our study, we found a stronger graded association between SBP variability and atrial fibrillation compared with this previous work. In contrast, another systematic review of 14 randomized trials in patients with hypertension did not find an increased risk in patients with higher SBP variability [8]. This previous study only included rigorously screened patients with hypertension in clinical trials, while our study included a community-based population. Thus, we were able to show a more significant relationship of SBP variability with atrial fibrillation risk in participants without hypertension, a novel finding extending previous studies. Taken together, our study provided further evidence that higher visit-to-visit variability of SBP contributes to incident atrial fibrillation by evaluating this question in a well characterized Chinese cohort with more complete outcomes data capture.
The underlying mechanisms for the association of visit-to-visit variability of SBP with risk of atrial fibrillation are as follows. First, higher long-term BP fluctuation is associated with increased shear stress and left ventricular dysfunction [21,22], resulting in atrial stretch that may induce cardiac inflammation and atrial fibrosis [1,23]. Second, previous studies have suggested that increased BP variability causes vascular endothelial dysfunction [24,25], and the acceleration of arterial stiffness progression was also observed in population with higher long-term SBP variability [26]. These pathophysiological changes could lead to ischemia in atrial myocardium, which promotes the process of atrial remodeling [1]. Furthermore, several traditional risk factors of atrial fibrillation (for instance, diabetes and chronic kidney disease) [1], which are recognized as potential consequences of high variability of SBP [27], may mediate the association of SBP variability and risk of atrial fibrillation. Our study consistently found that participants in the highest quartile had higher FBG and lower eGFR, although, additional adjustment for FBG and eGFR did not change the results. In the stratified analyses, there was a significant interaction between hypertension status and SBP variability on the risk of atrial fibrillation, with a stronger association in individuals without hypertension. Consistently, several cohort studies observed similar results based on the outcomes of end-stage renal disease, dementia, and mortality [16,28]. This result may be partly explained by the viewpoint that preexisting hypertension masked the relation between SBP variability and risk of atrial fibrillation. However, detailed mechanism remains unknown. Further studies aimed at the differential consequences of increased SBP variability in individuals with and without hypertension are still warranted.
These findings add to accumulating evidence that increased visit-to-visit variability of SBP is a strong predictor of incident atrial fibrillation in middle-aged and older population. However, the assessment of visit-to-visit variability of SBP were commonly overlooked in clinical practice and public awareness. Given the consistently increasing prevalence of atrial fibrillation in middle-aged and older population [7], policies to focus on BP fluctuation, encourage long-term self-monitoring, and promote public health education can help to reduce the society burden of atrial fibrillation and its severe complications in aged population. Moreover, our study also advocates the need of BP management strategies aimed at maintaining stable BP levels. Although, previous work has indicated that calcium-channel blockers and nonloop diuretics should be a preferred consideration for lowering BP variability [29–31]. Further studies on nonpharmacological intervention of high BP variability are still needed, especially in people without hypertension.
Strengths and limitationsThe strengths of our study include large-scale community-based cohort, biennial medical examinations, long period of follow-up and close to complete data on atrial fibrillation events. These enable us to collect precise information on characteristics and track the outcome events in all participants. We followed standardized procedures in all BP measurements, which minimized the measurement error to the greatest extent. Another strength is that we conducted many sensitivity analyses, including assessing variability using multiple indexes, a competing risk analysis, analyses restricted to participants with no prior CVD and no antihypertensive intervention, and analysis to minimize the reverse causation, to test the robustness of the association between visit-to-visit variability of SBP and the risk of atrial fibrillation.
There are several limitations in our study. First, the observational design cannot determine the causality. Although our analyses had adjusted for a wide spectrum of confounders, there were still several potential confounding factors that were not included in the study protocol, for instance, the mental state. Second, the assessment of visit-to-visit variability of SBP was based on BP measurements over three visits in the interval of 2 years. Further studies assessing BP variability with more visits and shorter interval would add to the understanding of its association with atrial fibrillation. Third, the participants of our study were only enrolled from China, which may limit the generalizability of our findings. Given the higher prevalence of atrial fibrillation in people with Caucasian ethnicity, how visit-to-visit variability of SBP related with incident atrial fibrillation in Caucasian population merits further investigation.
In this large community-based cohort study, higher visit-to-visit variability of SBP was significantly associated with greater risk of atrial fibrillation in middle-aged and older population. The results persisted after adjustment for relevant covariates, and across several sensitivity analyses. Our findings emphasize the importance of focusing on long-term BP fluctuation in the prevention of atrial fibrillation, and support the efforts to maintain stable BP in people with normal BP but higher BP variability. Further trails on the benefits of variability-lowering intervention are still needed.
ACKNOWLEDGEMENTSWe sincerely thank all the survey teams of the Kailuan Study Group for their contribution and the study participants who contributed their information.
Funding: this work was supported by the grants from the National Natural Science Foundation of China (No. 81570383 and No. 82070433).
Conflicts of interestThere are no conflicts of interest.
REFERENCES 1. Kirchhof P, Benussi S, Kotecha D, Ahlsson A, Atar D, Casadei B, et al. 2016 ESC Guidelines for the management of atrial fibrillation developed in collaboration with EACTS. Europace 2016; 18:1609–1678. 2. Gillis AM. Atrial fibrillation and ventricular arrhythmias: sex differences in electrophysiology, epidemiology, clinical presentation, and clinical outcomes. Circulation 2017; 135:593–608. 3. Chugh SS, Havmoeller R, Narayanan K, Singh D, Rienstra M, Benjamin EJ, et al. Worldwide epidemiology of atrial fibrillation: a Global Burden of Disease 2010 Study. Circulation 2014; 129:837–847. 4. Wang Z, Chen Z, Wang X, Zhang L, Li S, Tian Y, et al. The disease burden of atrial fibrillation in China from a national cross-sectional survey. Am J Cardiol 2018; 122:793–798. 5. Krijthe BP, Kunst A, Benjamin EJ, Lip GY, Franco OH, Hofman A, et al. Projections on the number of individuals with atrial fibrillation in the European Union, from 2000 to 2060. Eur Heart J 2013; 34:2746–2751. 6. Schnabel RB, Yin X, Gona P, Larson MG, Beiser AS, McManus DD, et al. 50 year trends in atrial fibrillation prevalence, incidence, risk factors, and mortality in the Framingham Heart Study: a cohort study. Lancet 2015; 386:154–162. 7. Hindricks G, Potpara T, Dagres N, Arbelo E, Bax JJ, Blomstrom-Lundqvist C, et al. 2020 ESC Guidelines for the diagnosis and management of atrial fibrillation developed in collaboration with the European Association for Cardio-Thoracic Surgery (EACTS): The Task Force for the diagnosis and management of atrial fibrillation of the European Society of Cardiology (ESC) Developed with the special contribution of the European Heart Rhythm Association (EHRA) of the ESC. Eur Heart J 2021; 42:373–498. 8. Webb AJ, Rothwell PM. Blood pressure variability and risk of new-onset atrial fibrillation: a systematic review of randomized trials of antihypertensive drugs. Stroke 2010; 41:2091–2093. 9. Lee SR, Choi YJ, Choi EK, Han KD, Lee E, Cha MJ, et al. Blood pressure variability and incidence of new-onset atrial fibrillation: a nationwide population-based study. Hypertension 2020; 75:309–315. 10. Zhang Q, Zhou Y, Gao X, Wang C, Zhang S, Wang A, et al. Ideal cardiovascular health metrics and the risks of ischemic and intracerebral hemorrhagic stroke. Stroke 2013; 44:2451–2456. 11. Wu S, Huang Z, Yang X, Zhou Y, Wang A, Chen L, et al. Prevalence of ideal cardiovascular health and its relationship with the 4-year cardiovascular events in a northern Chinese industrial city. Circ Cardiovasc Qual Outcomes 2012; 5:487–493. 12. Kim MK, Han K, Park YM, Kwon HS, Kang G, Yoon KH, et al. Associations of variability in blood pressure, glucose and cholesterol concentrations, and body mass index with mortality and cardiovascular outcomes in the general population. Circulation 2018; 138:2627–2637. 13. Levey AS, Stevens LA, Schmid CH, Zhang YL, Castro AF 3rd, Feldman HI, et al. A new equation to estimate glomerular filtration rate. Ann Intern Med 2009; 150:604–612. 14. Chobanian AV, Bakris GL, Black HR, Cushman WC, Green LA, Izzo JL Jr, et al. The Seventh Report of the Joint National Committee on Prevention, Detection, Evaluation, and Treatment of High Blood Pressure: the JNC 7 report. JAMA 2003; 289:2560–2572. 15. Camm AJ, Kirchhof P, Lip GY, Schotten U, Savelieva I, Ernst S, et al. Guidelines for the management of atrial fibrillation: the Task Force for the Management of Atrial Fibrillation of the European Society of Cardiology (ESC). Europace 2010; 12:1360–1420. 16. Gosmanova EO, Mikkelsen MK, Molnar MZ, Lu JL, Yessayan LT, Kalantar-Zadeh K, et al. Association of systolic blood pressure variability with mortality, coronary heart disease, stroke, and renal disease. J Am Coll Cardiol 2016; 68:1375–1386. 17. Muntner P, Shimbo D, Tonelli M, Reynolds K, Arnett DK, Oparil S. The relationship between visit-to-visit variability in systolic blood pressure and all-cause mortality in the general population: findings from NHANES III, 1988 to 1994. Hypertension 2011; 57:160–166. 18. Rouch L, Cestac P, Sallerin B, Piccoli M, Benattar-Zibi L, Bertin P, et al. Visit-to-visit blood pressure variability is associated with cognitive decline and incident dementia: The S.AGES Cohort. Hypertension 2020; 76:1280–1288. 19. Muntner P, Whittle J, Lynch AI, Colantonio LD, Simpson LM, Einhorn PT, et al. Visit-to-visit variability of blood pressure and coronary heart disease, stroke, heart failure, and mortality: A cohort study. Ann Intern Med 2015; 163:329–338. 20. Wang Y, Zhao P, Chu C, Du MF, Zhang XY, Zou T, et al. Associations of long-term visit-to-visit blood pressure variability with subclinical kidney damage and albuminuria in adulthood: a 30-year prospective cohort study. Hypertension 2022; 79:1247–1256. 21. Nwabuo CC, Yano Y, Moreira HT, Appiah D, Vasconcellos HD, Aghaji QN, et al. Long-term blood pressure variability in young adulthood and coronary artery calcium and carotid intim
留言 (0)