Cell culture and characterization
The MSCs were purchased from Cyagen Biosciences Inc. (Shanghai, China) and were cultured in DMEM containing 10% fetal bovine serum (Gibco, USA) in a humidified atmosphere at 37 °C and 5% CO2. MSCs were characterized by cell surface markers (CD29, CD34, CD45 and CD90) using flow cytometric analysis. The HUVECs were purchased from FuHeng Biology (Shanghai, China) and were cultured in ECM (ScienCell, USA) containing 5% fetal bovine serum and 1% endothelial cell growth supplements. Cells were maintained at 37 °C in a humidified atmosphere of 5% CO2. HUVECs were characterized by CD31.
Lentiviral vector transfection
The MIR155HG-expressing lentivirus vector was pCDH-CMV-MIR155HG-EF1-copGFP-T2A-Puro(rLv-MIR155HG) obtained from OLIGOBIO Co., Ltd. (Beijing, China). The rLv-MIR155HG vector and control vector were, respectively, co-transfected with packaging vectors PCDH-CMV-MCS-EF1-copGFP-T2A-puro, psPAX2 and p MD2.G into HEK-293T cells using Lipofectamine 2000 transfection reagent. The MIR155HG-knockdown lentivirus vector was plvx-shRNA2-Zsgreen-T2A-puro. Short-hairpin RNAs (shRNAs) against MIR-155HG were constructed in pcDNA3.1 by OLIGOBIO Co., Ltd. (Beijing, China). The target sequence of sh-MIR155HG was GCATTCACGTGGAACAAAT, and the control sequence was TTCTCCGAACG- TGTCACGT. Primary MSCs were incubated with recombinant MIR155HG-GFP or sh-MIR155HG-GFP lentivirus vectors at a multiplicity of infection (MOI) of 60. Cells were infected with the lentivirus medium. After 6 h, 2 ml fresh medium was added to dilute polybrene. Then, the lentivirus culture medium was replaced with a fresh medium for another 24 h. The green fluorescent protein signal was detected using a fluorescence microscope, and gene transfection efficiency was verified using PCR 48 h later. Primers were as follows: MIR155HG forward 5′-GCTTGCTGAAGGC TGTATGC-3′, MIR155HG reverse 5′-GTCTTGTCATCCTCCCACGG-3′; GAPDH forward 5′-GATTTGGCCGTATCGGAC-3′, GAPDH reverse 5′-GAAGACGCCA GTAGACTC-3′. Each reaction was replicated three times. Fold changes in cDNA relative to GAPDH endogenous control were calculated using the 2−ΔΔCt method.
Chemical treatment
NF-κB inhibitor BMS-345541 was purchased from MCE (New Jersey, USA). Cells were treated with 5 μM BMS-345541 for 2 h. The NF-κB pathway was significantly inhibited at this concentration, but no apoptosis was observed.
Cell viability assay
Cell viability was assessed using a Cell Counting Kit-8 (CCK-8) (MCE, New Jersey, USA). Cells were seeded onto 96 well plates and incubated for 24, 48, 72, and 96 h. Then, 10% CCK-8 solution was added to each well according to the manufacturer’s instructions. Two hours later, the absorbance at 450 nm was detected using enzyme micro-plate reader (Tecan F50, Switzerland).
Cell proliferation assay
Cell proliferation was assessed using a kFluor555 Click-iT EdU Kit (Keygen Biotech, Nanjing, China) according to the manufacturer’s instructions. KFluor555 stained the proliferating nuclei in red, and Hoechst 33342 stained the nucleus in purple. The proliferation rate equals the number of cells in proliferation state (red) divided by the number of total cells (purple).
Quantitative real-time PCR (qRT-PCR)
Total RNA was isolated from samples using TRIzol reagent (Invitrogen, USA), and reverse transcription was performed using the PrimeScript RT reagent kit (Takara, Japan). QRT-PCR with SYBR Green was performed using a Bio-Rad real-time PCR system according to the manufacturer’s protocol. Melt curve analysis was conducted to verify that only one product was produced. RNA levels were calculated relative to GAPDH levels using the 2−ΔΔCt method.
Western blot
Proteins were subjected to SDS-PAGE on polyacrylamide gels (8–10%) and transferred onto a PVDF membrane. After blocking with 5% non-fat milk in TBS containing 0.1% Tween-20, the membrane was incubated at 4 °C overnight with one of the following primary antibodies: anti-p-NF-κB P65, anti-NF-κB P65, anti-p-mTOR, anti-p-ERK, anti-ERK, anti-PDCD4, anti-GNA12 (Affinity, USA); anti-mTOR, anti-GAPDH, anti-TSG101, anti-CD63, anti-CD81, anti-Bax (Proteintech, USA); anti-Bcl-2 (Abclonal, China). Subsequently, the peroxidase-conjugated AffiniPure goat anti-rabbit or mouse IgG (Proteintech, USA) was added. Bound antibody was visualized via ECL plus TM Western blotting system detection kit (Amersham, USA).
Migration assay
A cell migration assay was performed using a transwell (8 μm pore size) (Corning, USA) to observe the migration function of MSCs. 200 μL transfected MSCs (1.5 × 10⁵/ml) were seeded in the upper chamber, and 600 μl complete medium with SDF-1a (100 ng/ml, Proteintech, USA) were placed into the lower chamber. Cells on the upper side of the membrane were removed after 12 h. Cells on the bottom surface of the membrane were stained with 0.1% crystal violet and counted in 5 randomly selected microscopic fields.
Cell-surface phenotype analysis
Experimental groups of MSCs were stained with rabbit anti-rat CXCR4 antibody (1:250, abcam, UK). The blank control group was stained with the isotype control antibody. Cells were incubated at 4 °C for 1 h. Then, the secondary antibody Cy3 goat anti-rabbit IgG (H + L) (Abclonal, China) was added and incubated at 4 °C for 20 min. Flow cytometry was used to identify the phenotypes of MSCs.
Cell apoptosis
The flow cytometry was performed using an Annexin V/PI apoptosis detection kit (Keygen Biotech, Nanjing, China) to quantify the apoptosis of the MSCs according to the manufacturer’s instructions.
ELISA assay
The culture medium of each group of MSCs was collected and centrifuged at 1000 g for 20 min to obtain the supernatant. The HGF or VEGF concentration in the supernatant was quantified using an enzyme-linked immunosorbent assay (ELISA) kit (ExCellBio, Shanghai, China).
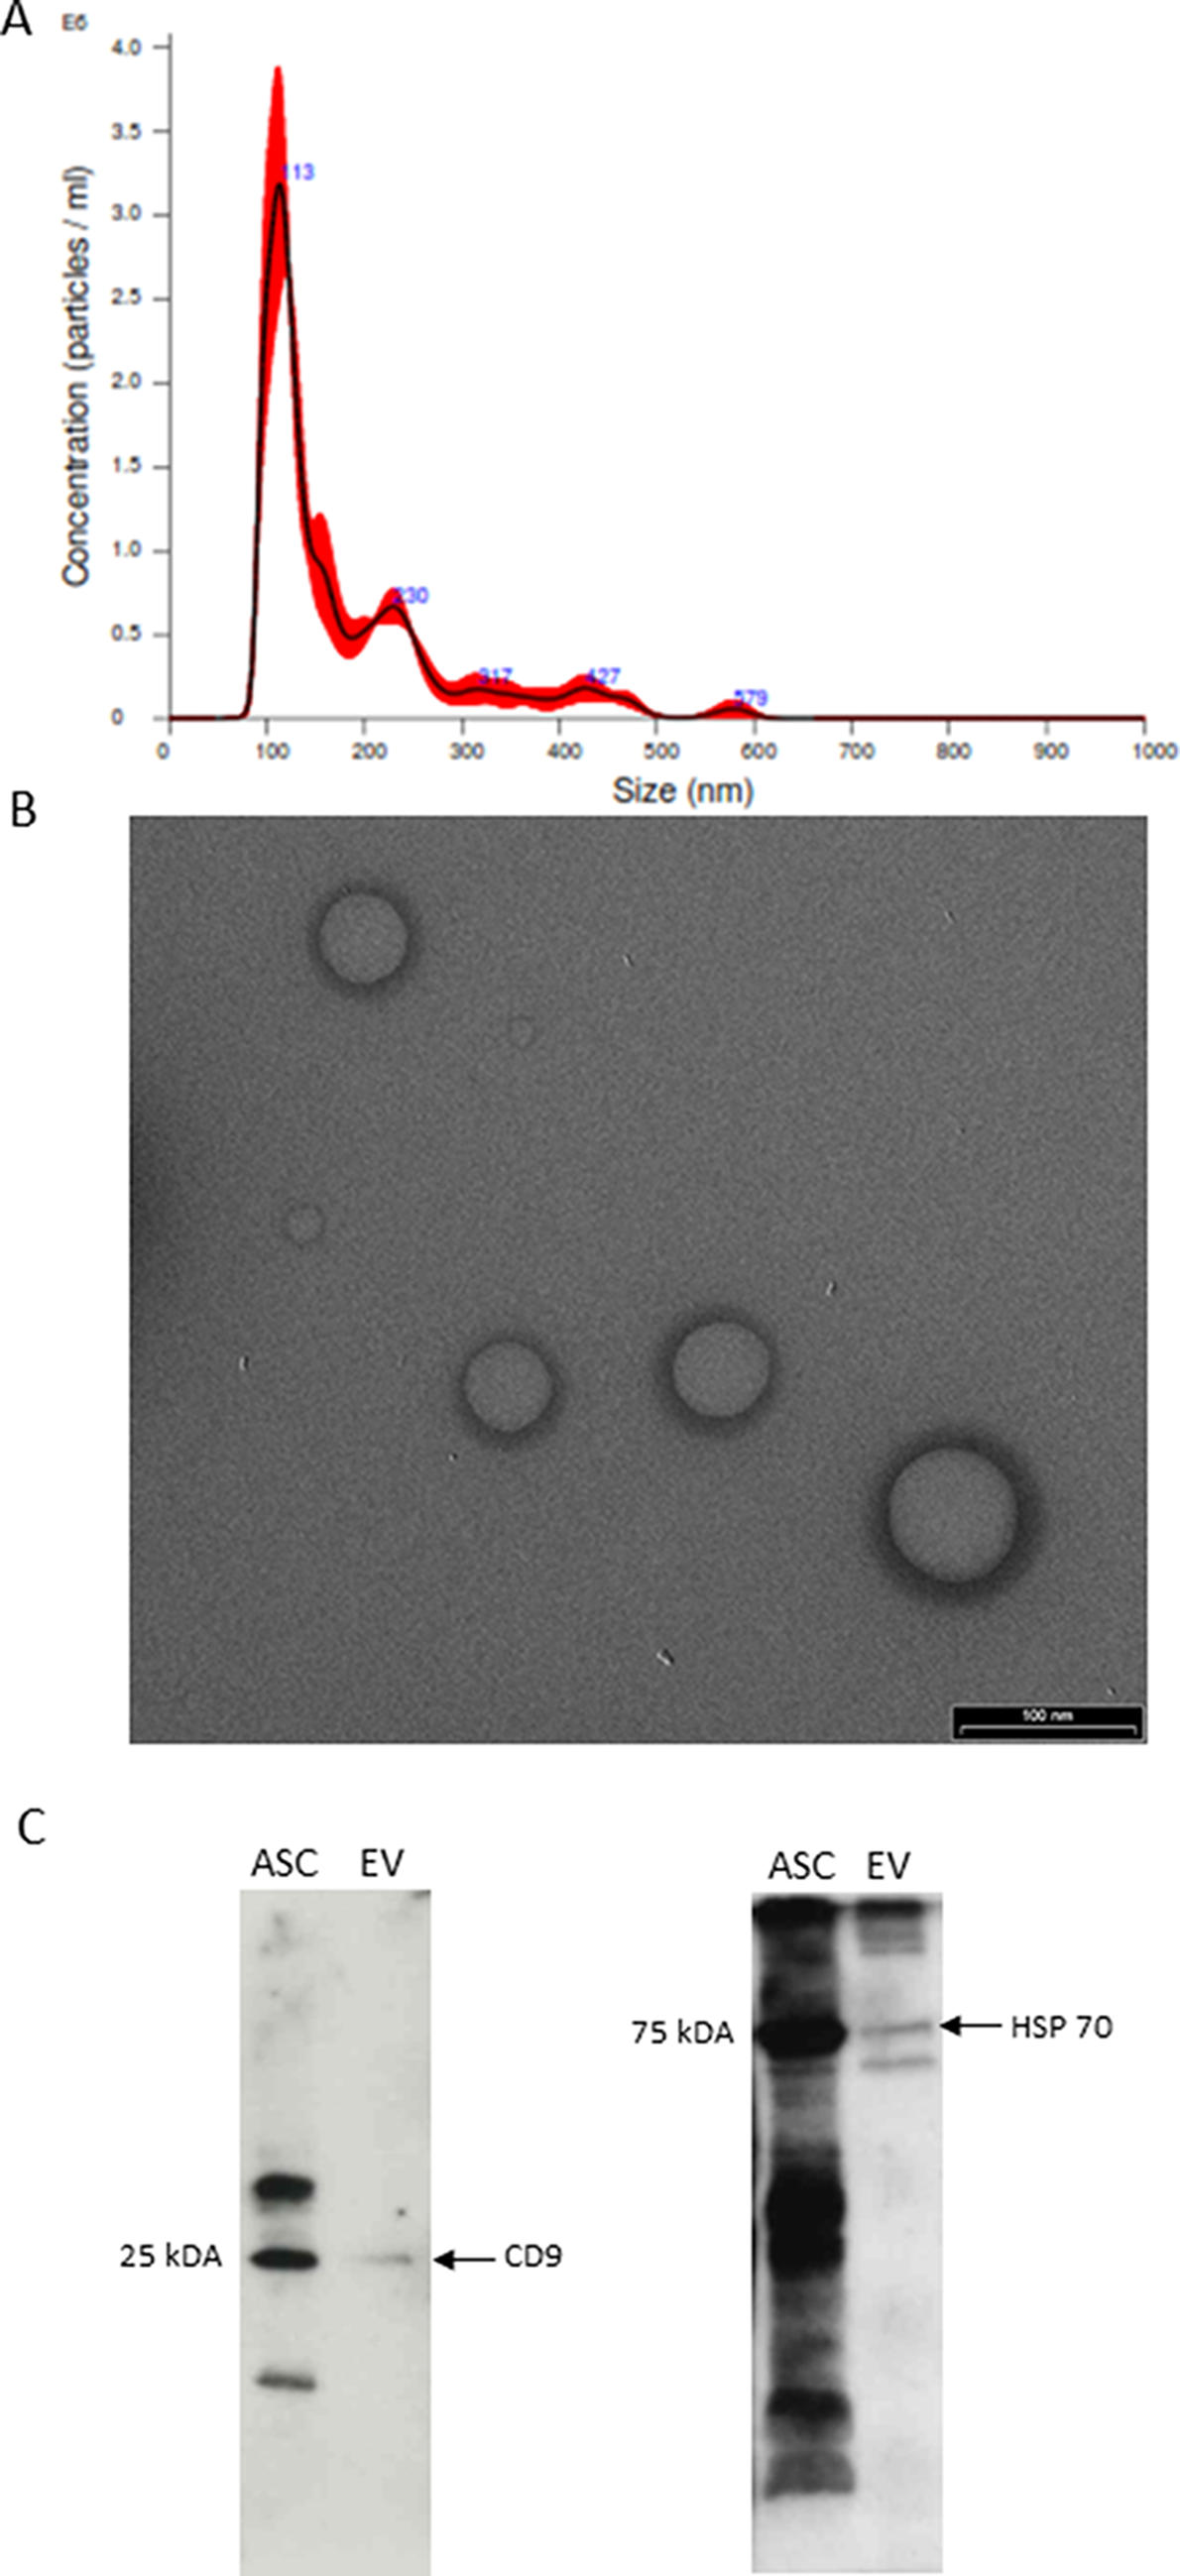
Extraction and identification of exosomes derived from MSCs
Exosomes were extracted from supernatants of MSCs cultures using density gradient ultracentrifugation. Morphology of exosomes was observed using a transmission electron microscope after uranyl acetate staining. Exosome particle size was detected using a nanometer particle size detector. The markers of exosomes, including CD63, CD81, and TSG101, were identified using western blot. Uptake of exosome by HUVECs was observed using confocal laser microscopy (Leica, Germany).
Vein grafting models
All the Sprague–Dawley (SD) rats weighing 250–300 g were purchased from Charles River (Beijing, China). The external jugular vein was harvested without damage from the neck of the rats. Small branches of blood vessels were ligated using thin silk threads. The length of the obtained vein was approximately 1.5 cm. Vein grafting was performed with the cuff technique and inserted into the infrarenal abdominal aorta in the same rat. Heparin (100U/100 g) was used before and after grafting. Transfected cells (5 × 10⁷/ml × 0.2 ml) and exosome (400 μg protein suspended in 0.2 ml PBS) were injected into rat model through the caudal vein 24 h after grafting. Rats were humanely killed one week after operation to evaluate MSC homing using fluorescence microscopy. All remaining rats were killed four weeks after the operation for histological detection. All the experimental procedures were performed with the approval of the Ethical Committee of the Qilu Hospital of Shandong University (KYLL-2021(KS)-976) and followed the Institutional Animal Care and Use Committee guidelines.
Histological examination
Vascular specimens were fixed in 4% paraformaldehyde and then embedded in paraffin. Paraffin specimen sections (4-μm-thick) were prepared by dewaxing. Van Gieson (VG) stain was used to assess collagen infiltration according to the manufacturer’s instruction. The morphology of the vascular intima was observed using light microscopy. The nucleus was stained in blue, muscle fibers were stained in yellow, and collagen fibers appeared bright red.
For the immunohistochemistry test, the sections were incubated with rabbit anti-rat PCNA (1:100) or NF-κB P65 (1:100) overnight at 4℃. Then, sections were incubated with biotinylated goat anti-rabbit IgG (1:200) for 30 min. Positive staining was identified using diaminobenzidine (DAB). Positive staining for PCNA or NF-κB P65 was observed as brown areas. We applied Image J software to calculate the integral optical density (IOD) of each field.
Immunofluorescence microscopy
First, the sections were stained with anti-CD31 (Affinity, USA) overnight at 4°C. The secondary antibody was added after the primary antibody was washed with PBS. Sections were incubated for 45 min at room temperature. Nuclei were counterstained with DAPI. Images were observed using a fluorescent microscope (OLYMPUS, Japan).
Statistical analysis
Data were expressed as means and standard deviations (SD). SPSS version 20.0 software (SPSS, Chicago, USA) was used to analyze differences between samples, either using the two-sample student t test or one-way ANOVA for differences between selected pairs of samples. P value < 0.05 was considered statistically significant.


留言 (0)