
記住我


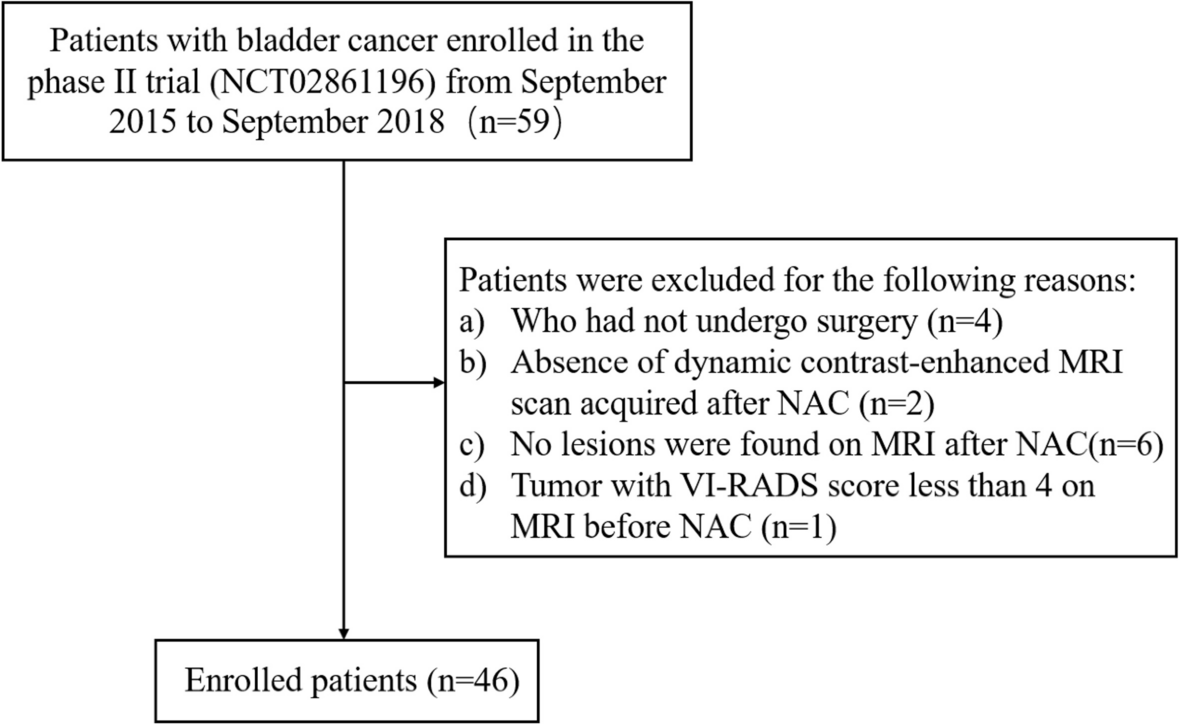


Inclusion criteria were: a) gastroscopic biopsy-proven esophageal squamous cell carcinoma (SCC) before treatment; b) chest enhanced CT examination at baseline; c) patients treated with chemotherapy or CRT; d) assessing whether esophageal fistula was presented after treatment by CT, endoscopy, barium esophagography or operation at follow-up of 6 months; e) availability of quality diagnostic images for measuring lesions. Patients who were not in accord with inclusion criteria were excluded. Patients with esophageal cancer accompanied by esophageal fistula after chemotherapy or CRT were identified from January 2011 to December 2019. In addition, esophageal SCC patients with no esophageal fistula after chemotherapy or CRT were included in this study from January 2016 to December 2017 in a 1:3 ratio of non-fistula and fistula groups. A total of 204 patients were enrolled in this study. Totally 54 patients with esophageal fistula were identified. In parallel, 150 esophageal SCC patients with non-esophageal fistula after treatment were included in this study. The patients were allocated to the primary and validation cohorts in a 1:1 ratio according to the time of inclusion. The first 102 patients (27 patients with fistula and 75 patients without fistula) were allocated to the primary cohort, and the subsequent 102 patients (27 patients with fistula and 75 patients without fistula) were allocated to the validation cohort. The complete patient enrollment process is shown in Supplementary Fig. 1.
Chemotherapy or CRTPatients treated with chemotherapy received a platinum-based regimen, mainly including paclitaxel (175 mg/m2 i.v. on day 1 of every 3-week cycle) and cisplatin (75 mg/m2 i.v. on day 1 of every 3-week cycle). Other patients were treated with concurrent chemoradiotherapy, with a radiotherapy dose of 50-60Gy and platinum-based chemotherapy.
Computed tomographyAll patients received enhanced multi-slice CT (MDCT) scanning of the chest before and during chemotherapy or CRT. Scans were performed using a 64-row helical CT scanner (Lightspeed VCT; General Electrical Medical Systems, Milwaukee, WI, USA). All patients were in the supine position. Generally, the scan began at 2.0 cm above the lung apices and extended through the adrenal glands. The following imaging parameters were used: 120–140 kVp tube voltage; 300 mA tube current; 64 × 0.625 mm detector collimation; 0.6 s/gantry rotation speed, and 1.5 helical pitch. Axial, coronal and sagittal images were reconstructed using a section width of 5.0 mm. One hundred milliliters of the non-ionic contrast medium iohexol (Omnipaque 300; GE Healthcare) were injected at a rate of 3.0 mL/s through the median cubital vein. The enhanced CT scan was performed 55 s after the start of the contrast medium injection.
Image interpretationMDCT imaging data was transferred to a picture archiving and communication system (PACS). Two radiologists with 8 years (Dr. Wei) and 12 years (Dr. Shi) of experience in thoracic CT independently reviewed the axial and reconstructed CT images obtained at baseline. Both reviewers were blinded to final results about esophageal fistula. All qualitative and quantitative parameters were assessed on enhanced images before treatment. Final quantitative measurements were determined by averaging the values obtained by the two radiologists. For qualitative analysis, the diagnosis was confirmed by a third experienced radiologist in case of disagreement.
Qualitative analysisTumor locations were classified as cervical, upper thoracic, middle thoracic, or lower thoracic esophagus. An important factor in assessing cancer location was to determine the center of the tumor in the esophagus. The tumor was staged by MDCT before therapy according to AJCC/TNM classification, 8th edition. The MDCT status was defined as follows [18]: CT T0, wall thickness < 5.0 mm and no signs of adventitial penetration; CT T1–2, a wall thickness of at least 5–10 mm without evidence of adventitial penetration; CT T3, tumor exhibiting a wall thickness of > 10 mm, possibly appearing as ill-defined, abnormal soft tissue around the tumor but no invasion of adjacent structures; CT T4a, invasion of the pleura, pericardium and diaphragm; T4b, invasion of the aorta, vertebral body and trachea. In the last two stages, the tumor had a wall thickness of > 10 mm and invaded adjacent structures. Intrathoracic and abdominal lymph nodes > 10 mm and supraclavicular lymph nodes > 5.0 mm in short-axis diameter were considered metastatic lymph nodes [18]. N staging was classified as negative (N-) or positive (N+) metastatic lymph nodes. CT imaging findings related to tracheal or bronchial invasion of the tumor were analyzed. The tumor range was classified as four types, including 0–1/4, 1/4–1/2, 1/2–3/4 and 3/4–1 (Fig. 1). The range of esophageal cancer was evenly classified as four types. If the esophageal tumor occupied up to a quarter of the esophageal wall, the range of tumor would be defined as type of 0–1/4. If the tumor occupied a quarter to a half of the esophageal wall, the tumor range would be defined as type of 1/4–1/2. Similarly, if the tumor occupied a half to three quarters of the esophageal wall, the tumor range would be defined as type of 1/2–3/4. Then, if the tumor occupied three quarters to whole of the esophageal wall, the tumor range would be defined as type of 3/4–1. Esophageal stenosis and deep ulcer were also evaluated. The morphological patterns of the tumor were graded as focal or diffuse type.
Fig. 1
Schematic diagram of esophageal carcinoma range and measurement of a deep ulcer. A Schematic diagram demonstrated that the esophageal lumen was evenly divided into four parts. The tumor (red) range was diagnosed as 0–1/4 (two blue arrow), 1/4–1/2 (yellow arc), 1/2–3/4 (green arc) and 3/4–1 (grey arc). B Schematic diagram demonstrated how ulcer depth (U, black), residual esophageal wall in the ulcer layer (R, red) and the the thickness of the lesion adjacent to ulcer (A, yellow) were measured
Quantitative analysisTumor wall thickness (THK-tumor) of esophageal SCC was measured perpendicularly to the lumen on axial images using the workstation’s electronic caliper. If the lumen was not visible in esophageal cancer with diffuse type, thickness of tumor was obtained through the following method. The entire diameter of the esophagus including the invisible lumen and the tumor was measured, and then multiplied by a factor of 0.5. The above method had been used in some researches [18, 19]. When the lumen was not visible in esophageal cancer with focal or eccentric type, the boundary of tumor in the lumen side was defined through observing sagittal and coronal images by radiologists and then maximal thickness was measured [18, 19]. Tumor length (the longest diameter of tumor, L-tumor) was measured on sagittal CT images. The region of interest (ROI) of the maximum CT value (HU-max) of tumor was placed on the highest enhanced area and that of the minimum CT value (HU-min) of tumor on the lowest enhanced area (Fig. 2). The area of each ROI was 3–5 mm2, averaging three measurements. The depths of low and high intensity enhancement areas were also measured (Fig. 2). Tumor ulceration was quantitatively assessed by measuring ulcer depth (DEP-ulcer), the thickness of the residual wall in the ulcer layer (THK-residue), and the thickness of the lesion adjacent to the ulcer (THK-adjacency) on cross-sectional CT images (Figs. 1 and 2). In case of no ulcer in the tumor, DEP-ulcer was recorded as 0, and THK-residue and THK-adjacency were the same as the wall thickness of the tumor. The ulcer-to-tumor ratio (R-ulcer) was calculated by the following equation: DEP-ulcer/THK-adjacency. The THK-residue-to-tumor ratio (R-residue) was derived as THK-residue/THK-adjacency. The HU-min to HU-max (R-HU) ratio was obtained as HU-min/HU-max. The joint predictive efficiency of continuous variables was defined as Y1. Y1 combining qualitative signs were defined as Y2.
Fig. 2
Axial enhanced CT at baseline examination showing ROI delineation and deep ulcer measurement. (A-C) CT images in a 42-year-old woman with esophageal cancer. A CT image showed an esophageal mass with a deep ulcer in the right wall. B The same CT image showed the measurement of the depth of deep ulcer (red line) at 10 mm, residual esophageal wall (green line) at 7 mm and the thickness of adjacent wall to ulcer (yellow line) at 17 mm in the ulcer layer. The ratio of ulcer depth to adjacent tumor thickness of 58.8% and tumor thickness of 17 mm could predict fistula formation after treatment. C The esophageal fistula occurred in the region of the deep ulcer after three chemotherapy cycles and radiotherapy. D-F CT images in a 50-year-old man with esophageal cancer. D CT image showed an esophageal mass with a thickness of 15 mm. E The highest (red circle; 119 HU) and lowest enhancement (blue circle; 20 HU) zones, the ratio of minimum to maximum enhanced CT value of 16.8% and a tumor thickness of 15 mm could predict fistula formation after treatment. F Esophageal fistula occurred in the region of the lowest zone after three chemotherapy cycles and radiotherapy
Definition of esophageal fistulaEsophageal fistula was defined as a connection between the esophagus and adjacent organs or tissues [20] detected by CT, endoscopy, esophagography or operation. On CT images, esophageal fistula was diagnosed by discontinuous or defective esophageal wall, gas and fluid accumulated around the esophagus, or pneumonia associated with esophageal fistula. By esophagography, esophageal fistula was identified as contrast medium leakage into the mediastinum or bronchus.
Statistical analysisDifferences in qualitative parameters in patients with esophageal SCC between the primary and validation cohorts were assessed by the Mann-Whitney test or the Chi-square test/Fisher’s exact test. Differences in quantitative factors were examined by independent-samples t test or the Mann-Whitney test. The associations of quantitative measurements were evaluated by Pearson correlation coefficient; a coefficient > 0.6 suggested a moderate or strong correlation. Only parameters with weak correlation were substituted into the multivariate equation. Receiver operating characteristic (ROC) curve analysis was applied to evaluate the predictive capability of the quantitative analysis for predicting esophageal fistula, with the area under the ROC curve (AUC). Intraclass correlation coefficients (ICCs) were determined to evaluate inter-observer agreement in terms of CT quantitative measurements. Data analysis was conducted with SPSS 22.0 (IBM Corporation, Armonk, NY, USA) and STATA 12.0 (Stata Corporation, College Station, TX, USA).
留言 (0)