
記住我
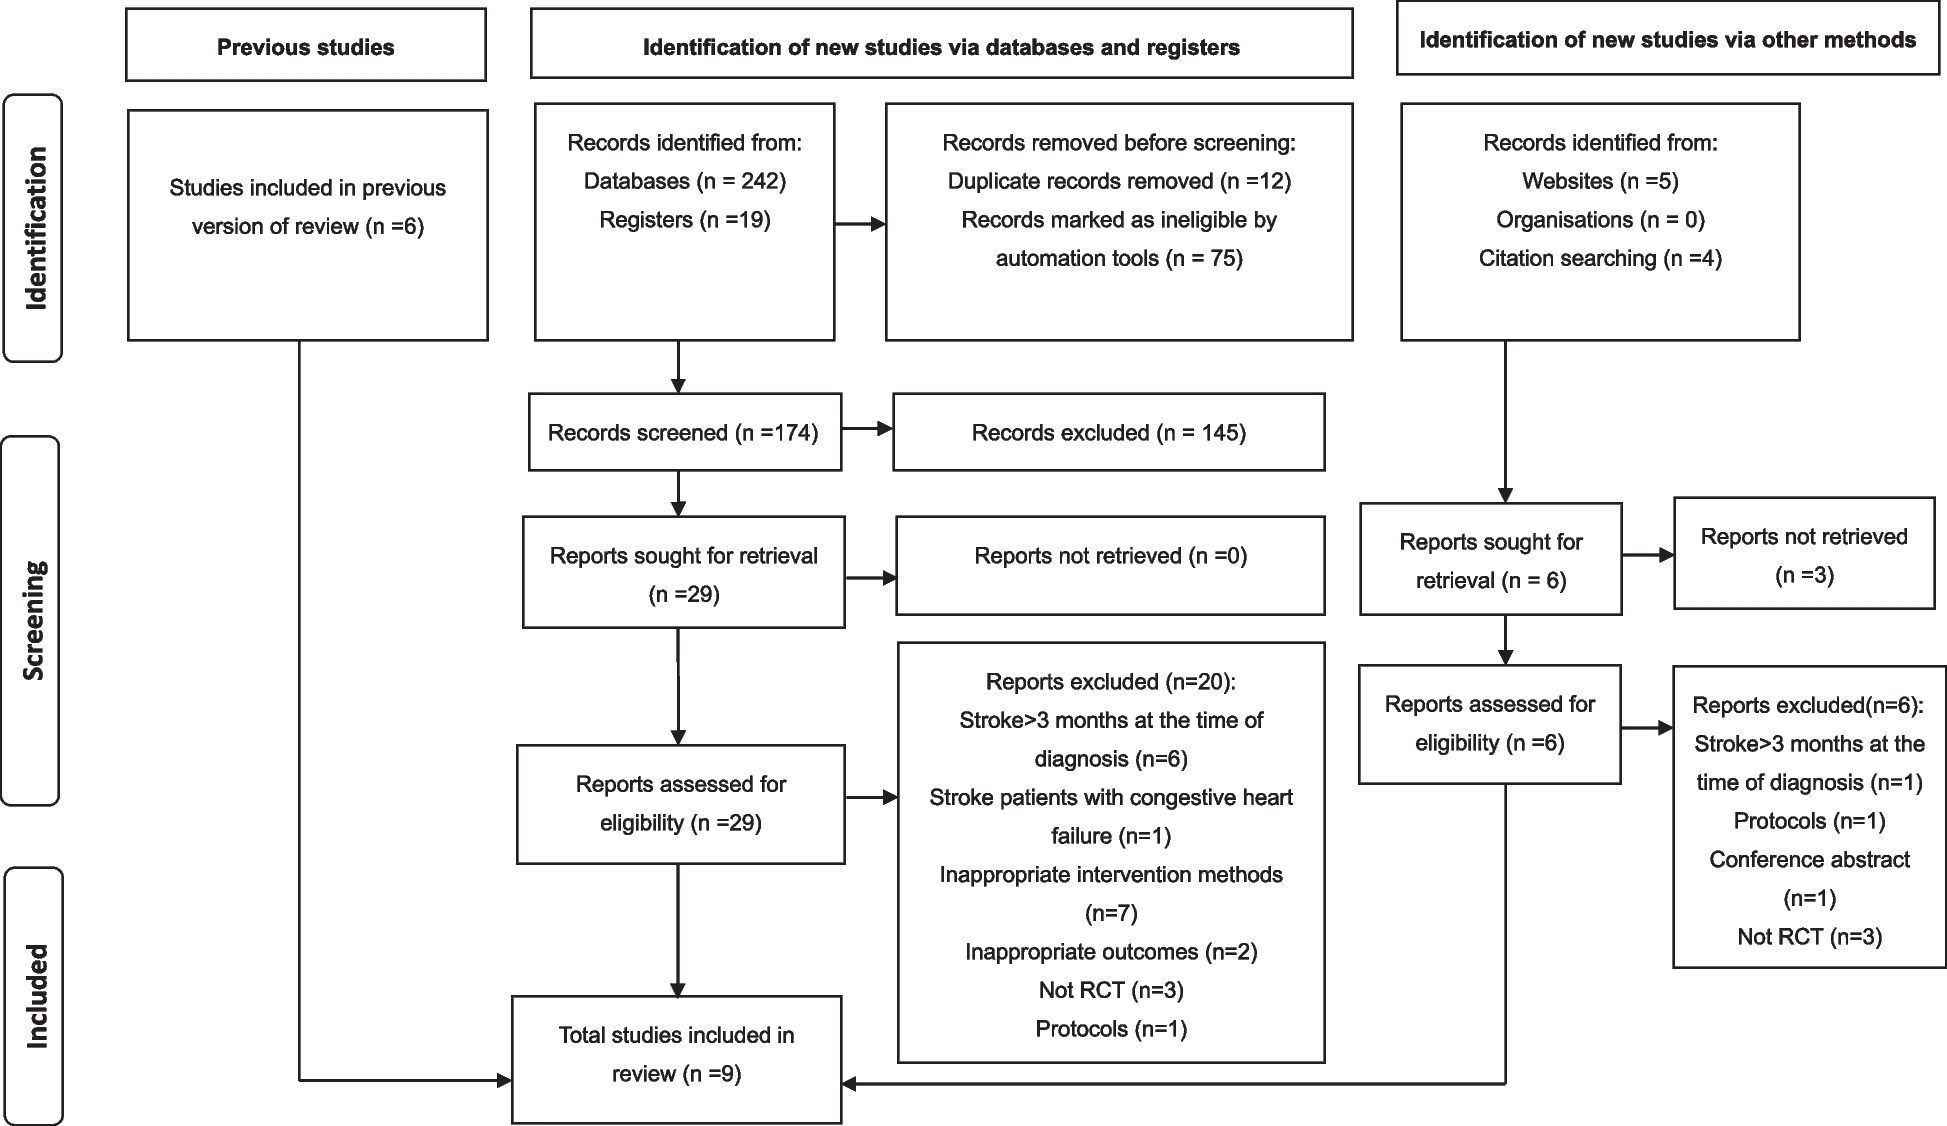
We reviewed a total of 491 charts of patients with PPMs and 280 charts of patients with ICDs, respectively. Of these, 332 PPM patients and 244 ICD patients met study inclusion criteria (Fig. 1). Table 1 describes basic demographic information of the PPM patients and Table 2 reports these data for the ICD patient population. When patients with PPMs were stratified by active time (< 2h vs. ≥ 2h), individuals who averaged < 2h/day of active time during the early pandemic period were older (82 ± 10 vs. 73 ± 13 years, N = 128 vs. 204 P < 0.001), more likely to be female (54% vs. 43%, P = 0.04), and more likely to have a creatinine clearance < 60 mL/min (54% vs. 42%, P = 0.04). Those with a history of atrial fibrillation were more likely to have a higher atrial fibrillation burden (16% vs. 9%, P = 0.05).
Fig. 1
Consort diagram of the study population
Table 1 Permanent Pacemaker Subject Characteristics Table 2 Implantable Cardioverter Defibrillation Subject CharacteristicsFor patients with ICDs, individuals with < 2h of active time per day were more likely to be older (72 ± 12 vs. 62 ± 14 years, N = 130 vs. 114, P < 0.0001), female (35% vs. 22%, P = 0.02), have hypertension (P = 0.01), ischemic heart disease (P = 0.002), LVEF < 35% (P = 0.003), diabetes mellitus (P = 0.01), a creatinine clearance < 60 mL/min (P < 0.001), a biventricular device (P = 0.02), and take warfarin, a HMG-CoA reductase inhibitor, or an ARNI (P = 0.001, 0.04, 0.04, respectively). Individuals with < 2h of active time per day were also less likely to be taking a calcium channel blocker (P = 0.006).
Impact of the onset of the pandemic in the US on active time in PPM patientsOf the 334 PPM patients included in the study, a total of 63 PPM patients had data for all six time points. The total number of subjects with a data point for each of the 5 non-pandemic time periods were as follows: January-March 2020, N = 296; October-December 2019, N = 250; March-May 2019, N = 183; January-March 2019, N = 180; October-December 2018, N = 186.
In the initial model comparing active time during the pandemic period compared to all other periods including time period, active time < 2h or ≥ 2h, and the interaction of time period and active time < 2h, a significant drop in active time was seen for both individuals who had < 2h of active time [-0.55 ± 0.08h, t(1093)=-7.16, Cohen’s d=-0.43, FDR-adjusted P < 0.0001] and those who had ≥ 2h of active time [-0.29 ± 0.06h, t(1093)=-4.80, Cohen’s d=-0.29, FDR-adjusted P < 0.0001]. The effect was minimally perturbed when age, number of comorbidities, and number of medications were added into the model as covariates: for those with < 2h of active time [-0.55 ± 0.08h, t(1093)=-7.16, Cohen’s d=-0.43, FDR-adjusted P < 0.0001] and those who had ≥ 2h of active time [-0.29 ± 0.06h, t(1093)=-4.80, Cohen’s d=-0.29, FDR-adjusted P < 0.0001]. Age [F(1, 1093) = 12.99, \(_^\)=0.01, P<0.001] and number of medications (F(1, 1093)=4.40, \(_^\)=0.004, P=0.04) were also significantly associated with changes in active time, while number of comorbidities was not associated with changes in active time with the onset of the pandemic [F(1, 1093)=2.13, \(_^\)=0.002, P = 0.15].
We constructed additional models to determine whether differences in active time between the early pandemic time period (March 15-May 15, 2020) differed between the five other prior time periods we specifically investigated. In a model that included each time period, active time categorization of < 2h or ≥ 2h, and the interaction of duration and active time category, whether an individual was active ≥ 2h or < 2h (active time category, F(1, 1085) = 347.70, \(_^\)=0.24, P<0.0001) and the interaction term for the active minute categories and time period of active time measurement [F(1, 1085)=2.62, \(_^\)=0.002, P=0.02] were significantly associated with changes in active time. The changes in active time for each time period compared to the early pandemic period are depicted in the Fig. 2 broken down active time group (< 2h and ≥2h).
Fig. 2
Changes in Active Minutes during the Early Pandemic Period in the United States (March 15-May 15, 2020) in Patients with Pacemakers and Defibrillators. Time differences expressed as the difference in active hours between the early pandemic period and the time frame indicated below each bar. J-M: January-March; O-D: October-December; M-M: March-May.
Significant drops in active time were seen comparing the early pandemic period to all other time periods measured for those who were active for < 2h on average per day (Table 3). We additionally found there was a significant reduction in active time noted between January 1 and March 15, 2020 versus January 1 and March 15, 2019 for this group (-0.28 ± 0.12h, t(1085)=-2.35, Cohen’s d=-0.14, FDR-adjusted P = 0.03). No significant reduction in active time were noted between the other pair of non-pandemic periods that were one year apart [Oct1-Dec 31, 2019 vs. Oct 1-Dec 31, 2018, (-0.18 ± 0.12h, t(1085)=-1.56, Cohen’s d=-0.09, FDR-adjusted P = 0.14)]. Following adjustment for age, number of comorbidities, and number of medications, the differences noted remained (Table 4).
Table 3 Comparison of Active Time During Early Pandemic Period to Earlier Time Periods in Patients with PPMs. Table 4 Comparison of Active Time During Early Pandemic Period to Earlier Time Periods in Patients with PPMs with Adjustment for Age, Number of Comorbidities, and Number of MedicationsFor individuals who performed ≥ 2h of active time, we found no significant difference between the early pandemic time period and the January 1- March 15, 2020 time period (-0.13 ± 0.08h, t(1085)=-1.69, Cohen’s d=-0.10, FDR-adjusted P = 0.12, Table 3). Active time for this group was lower during the early pandemic period compared to each of the other four time periods (Table 3). Neither of the paired non-pandemic periods one-year apart showed significant changes in active time for those with active time ≥ 2h (Table 3). Following adjustment for age, number of comorbidities, and number of medications, the significant reduction in active time between the early pandemic period and January 1-March 15, 2019 was no longer significant (-0.19 ± 0.09h, t(1085)=-2.06, Cohen’s d=-0.13, FDR-adjusted P = 0.06). All other significant differences between the pandemic period and other time periods remained (Table 4).
Impact of the onset of the pandemic in the US on active time in ICD patientsOf the 244 ICD patients included in the study, a total of 43 ICD patients had data for all six time points. The changes in active time for each time period compared to the early pandemic period are depicted in the Fig. 2 broken down active time group (< 2h and ≥ 2h). The total number of subjects with a data point for each of the 5 non-pandemic time periods were as follows: January-March 2020, N = 186; October-December 2019, N = 169; March-May 2019, N = 132; January-March 2019, N = 129; October-December 2018, N = 159. In the initial model comparing active time during the pandemic period compared to all other periods including time period, active time < 2h or ≥ 2h, and the interaction of time period and active time < 2h, a significant drop in active time was observed for individuals who had < 2h of active time [-0.48 ± 0.07h, t(804)=-6.68, Cohen’s d=-0.47, FDR-adjusted P < 0.0001] but not those who had ≥ 2h of active time [-0.14 ± 0.08h, t(804)=-1.86, Cohen’s d=-0.13, FDR-adjusted P = 0.06). The interaction was minimally perturbed when age, number of comorbidities, and number of medications were added into the model as covariates for those with < 2h of active time [-0.48 ± 0.07h, t(803)=-6.70, Cohen’s d=-0.47, FDR-adjusted P < 0.0001] and those who had ≥ 2h of active time (-0.14 ± 0.08h, t(803)=-1.91, Cohen’s d=-0.13, FDR-adjusted P = 0.06)]. Age [F(1, 803) = 19.18, \(_^\)=0.02, P<0.0001] was significantly associated with changes in active minute time, while number of comorbidities [F(1, 803)=0.49, \(_^\)=0.0006, P=0.49] and number of medications taken [F(1, 803)=1.05, \(_^\)=0.001, P = 0.30] were not associated with changes in active time with the onset of the pandemic.
We constructed additional models to determine whether differences in active minutes between the early pandemic time period (March 15-May 15, 2020) differed between the five other prior time periods we specifically investigated. In a model that included each time period, active time categorization of < 2h or ≥ 2h, and the interaction of duration and active time category, whether an individual was active ≥ 2h or < 2h (active time category F(1, 796) = 392.70, \(_^\)=0.33, P<0.0001) and the interaction term for the active minute categories and time period of active time measurement (F(1, 796)=4.13, \(_^\)=0.005, P=0.001) were significantly associated with changes in active time. Significant drops in active time were seen comparing the early pandemic period to all other time periods measured for those when were active for < 2h on average per day (Table 5). For those who averaged ≥ 2h of active time per day, the early pandemic period active time was significantly lower compared to only the Oct-Dec 2019 (-0.32±0.10h, t(796)=-3.15, Cohen’s d=-0.22, FDR-adjusted P = 0.004) and March-May 2019 (-0.37±0.11h, t(796)=-3.45, Cohen’s d=-0.24, FDR-adjusted P = 0.002) time periods (Table5).
Table 5 Comparison of Active Time During Early Pandemic Period to Earlier Time Periods in Patients with ICDsWe also found for those with < 2h active time, there was also significant reduction in active time noted between October 1-December 31, 2019 versus October 1-December 31, 2018 for this group [-0.27 ± 0.11h, t(796)=-2.56, Cohen’s d=-0.18, FDR-adjusted P = 0.02]. No significant reduction in active time were noted between the other pair of non-pandemic periods that were one year apart [January 1-March 15, 2020 vs. January 1-March 15, 2019, [-0.19 ± 0.11h, t(796)=-1.67, Cohen’s d=-0.12, FDR-adjusted P = 0.13]. Following adjustment for age, number of comorbidities, and number of medications, the differences noted remained for all comparisons (Table 6).
Table 6 Comparison of Active Time During Early Pandemic Period to Earlier Time Periods in Patients with ICDs with Adjustment for Age, Number of Comorbidities, and Number of MedicationsFor individuals who performed ≥ 2h of active, neither of the paired non-pandemic periods one-year apart showed significant changes in active time for those with active time ≥ 2h (Table 5). Following adjustment for age, number of comorbidities, and number of medications, no significant changes were seen in comparison to the previous model (Table 6).
Impact of the onset of the pandemic in the US on admissions and ED visits for PPM and ICD patientsDuring the first two months of the pandemic period, 51 PPM (15.3%) and 37 ICD (13.1%) patients were admitted to the hospital or ED. Patients with < 2h of activity per day were more frequently admitted to the hospital or ED (PPM 19.7% and ICD 19.2%) than those with ≥ 2h (PPM 12.7% and ICD 10.5%), though these differences were not statistically significant (P = 0.06). Notably, during the measured pandemic period, 2 PPM and 0 ICD patients tested positive for COVID.
For PPM patients, in univariate models including only changes in active minutes as an independent variable, changes in active minutes compared to the early pandemic period were only associated with an increased risk of an ED visit or hospitalization when compared to the Oct 1-Dec 31, 2019 and Jan 1-March 14, 2019 time periods (Table 7). These associations remained following adjustment for age, number of comorbidities, and number of medications (Table 7). The interaction terms for active time category (< 2h or ≥ 2h) with change in active minutes was not significant for any comparison (data not shown).
Table 7 Logistical Regression Models to Determine Whether Changes in Active Minutes Between the Early Pandemic Period and Five Earlier Time Periods are Associated with an Increased Risk of Hospitalization or an Emergency Department Visit for Patients with PPMsFor ICD patients, in models that include the change in active minutes, < 2h or ≥ 2h of active time, and an interaction term, the change in active minutes was not predictive of an emergency room visit or hospitalization for any comparison (Table 8).
Table 8 Logistical Regression Models to Determine Whether Changes in Active Minutes Between the Early Pandemic Period and Five Earlier Time Periods are Associated with an Increased Risk of Hospitalization or an Emergency Department Visit for Patients with ICDs
留言 (0)