
記住我
Advanced hepatocellular carcinoma (HCC) has a poor prognosis with very limited treatment options. However, immune checkpoint inhibitors (ICIs) have shown remarkable advancement in cancer research and the combination of ICIs anti-PD-1 nivolumab and anti-CTLA-4 ipilimumab was approved for HCC. Despite great strides being made in the treatment of HCC, more than 50% of patients do not respond to treatment. Quantitative systems pharmacology (QSP) models are being increasingly used in both academic research and the pharmaceutical industry to develop a mechanistic understanding of the disease-drug interactions and ultimately improve patient outcomes to treatment.
HOW THIS STUDY MIGHT AFFECT RESEARCH, PRACTICE OR POLICYIntroductionHepatocellular carcinoma (HCC) is the most common type of liver cancer, accounting for approximately 80% of primary liver malignancies.1 HCC is caused by chronic infection of hepatitis B or C virus, excess alcohol consumption, diabetes, obesity, and ingestion of aflatoxin-contaminated food.2 It is the third-leading cause of cancer-related death worldwide3 and despite efforts to screen at-risk individuals, approximately 80% of patients are diagnosed at late stages when curative intervention (ie, surgical resection or transplantation) is no longer possible.4 Since 2020, the preferred first-line treatment for patients with advanced HCC (aHCC) with preserved liver function is the combination of atezolizumab (anti-PD-L1) and bevacizumab (anti-vascular endothelial growth factor). This combination is associated with improved overall survival, progression-free survival, and quality of life than the historical standard of care, sorafenib.5 6 However, the prognosis for patients treated with modern systemic therapy continues to lag many other tumor types, with a median progression-free survival of 6.8 months and a medial overall survival of 19 months.4 Multiple second line therapies were developed for patients receiving first line sorafenib therapy (including regorafenib, cabozantinib, and ramucirumab),7–9 but the optimal management of patients progressing on first line bevacizumab and atezolizumab remains unclear.
There has been an increased interest in immunotherapy due to the success of a programmed cell death protein 1 (PD-1) blockade trial for the treatment of advanced melanoma.10 This led to many successful immunotherapy trials for the treatment of various solid tumors, with the main targets for immune checkpoint blockade being PD-1, programmed cell death ligand 1 (PD-L1) and cytotoxic T lymphocyte-associated antigen 4 (CTLA-4).11 12 This promotes antitumor response in T cells and prevents T cell exhaustion.13 For HCC, the US Food and Drug Administration (FDA) has recently granted accelerated approval of immune checkpoint inhibitors pembrolizumab (anti-PD-1), nivolumab (anti-PD-1) and the combination of nivolumab and ipilimumab (anti-CTLA-4) as second line treatment based on the results of KEYNOTE-22414 and CheckMate 04015 16
Nivolumab treatment for aHCC was first evaluated in CheckMate 040, a phase I/II study that included 48 patients in the dose-escalation phase and 214 patients in the dose-expansion phase; this study showed an objective response rate (ORR) of 20%.15 The median overall survival times were 28.6 months for first-line therapy and 15 months for patients who were previously treated with sorafenib,17 which led to the FDA approval for nivolumab as a second-line therapy for aHCC following the failure of sorafenib treatment. Nivolumab is currently being evaluated for first-line therapy in two phase III trials (CheckMate 459, NCT02576509 and CheckMate 9DX, NCT03383458). The combination of nivolumab and ipilimumab is currently being evaluated in HCC as second-line therapy (CheckMate 040, NCT01658878) and has been granted accelerated approval by the FDA for patients previously treated with sorafenib. This combination has shown promising results in other cancers starting with its success in melanoma.18 Despite the success of this treatment, response rate is moderate; 33% at a median follow-up time of 28 months in the ongoing CheckMate 040 trial (NCT01658878).19
There is clearly a need for biomarker identification to increase the success rate of the treatment of aHCC. Additionally, the complex biological mechanisms explaining the success of different combinations of drugs remain unknown.20 Having a qualitative understanding of the interplay between the immune cells and cancer cells is not sufficient to fully optimize the treatment. This is where quantitative mechanistic mathematical and computational models can become useful.
Mathematical and computational modeling has been an essential tool in drug development for decades. In conventional pharmacokinetic/pharmacodynamic (PK/PD) modeling, the uptake, distribution and target interactions are modeled to create a link between the pharmacology and clinical outcomes. These models, however, do not take full advantage of existing mechanistic knowledge. Quantitative systems pharmacology (QSP) modeling integrates mechanistic knowledge of molecular and cellular interactions and PK/PD modeling to mechanistically link drug pharmacology to clinical outcomes. QSP is becoming an increasingly popular tool in both academia and industry for studying disease response to drugs. Pharmaceutical companies use QSP models to make decisions at all stages in the development cycle, and they may become standard practice and used in the approval by regulatory agencies. QSP models have shown to be useful in both prospective and retrospective analyses of immunotherapies in multiple cancer types.21–28 Rule-based QSP model was developed by Abrams et al, to predict dose-response relationship for trispecific antibodies.29 For a detailed review of QSP modeling in immuno-oncology (IO), see the recent review article by Chelliah et al.30 While there are multiple computational models that exists for hepatic diseases31–34 there is only one QSP model for liver, non-alcoholic fatty liver disease (NAFLDsym),35 36 derived from DILIsym37 that incorporates key components of steatosis and lipotoxicity in NAFLD patients. There is an unmet need for a detailed large-scale QSP model for HCC to search for novel therapies and design of clinical trials.
In this study, we develop a QSP model for aHCC using our platform, QSP-IO,38 to simulate therapy with immune checkpoint inhibitors nivolumab and ipilimumab using virtual patients generated from the CheckMate 040 trial results of nivolumab monotherapy in aHCC.15 We then use the model in a detailed analysis of the CheckMate 040 clinical trial for different dose regimens of the combination therapy with the objective of determining predictive biomarkers that could facilitate patient selection and ultimately improve the success of this treatment.
MethodsComputational model overviewThe proposed QSP model was developed using QSP-IO, our modular MATLAB (MathWorks, Natick, MA) SimBiology-based platform for developing QSP models in IO.38 The resulting model structure is similar to that of models introduced in our previous studies.21–26 39 The model is a four-compartment model describing relevant immune interactions in tumor, tumor-draining lymph node (LN), central (blood), and peripheral (all other organs) compartments, thus representing the entire patient.
Our model considers logistic tumor growth dynamics with a tumor cell death-dependent release of antigens which are taken up by antigen-presenting cells (APCs), for example, dendritic cells. Antigens within dendritic cell endosomes are broken down and can bind major histocompatibility complex molecules, which translocate to the surface to be presented to naïve T cells. Naïve T cells are modeled by a zeroth order source term in the central compartment and can migrate to the other compartments. Naïve T cells in the LN compartment can interact with APCs to become activated where they undergo proliferation and become mature cytotoxic T cells that can migrate between compartments; the model also considers regulatory T cell (Treg) dynamics that is similar to that of the cytotoxic T cells. The model also incorporates immune checkpoints PD-1, PD-L1, PD-L2 and CTLA-4. Figure 1 summarizes the interactions considered in the model. For completeness and reproducibility, all equations and parameter values are included in online supplemental information, and the code used to produce the results can be found at www.github.com/popellab/qspio/.
 Figure 1
 Diagram of the immuno-oncology QSP model interactions. APC, antigen presenting cells; mAPC, mature antigen presenting cells; MHC, major histocompatibility complex; N, naïve T cells; P, proliferating T cells; QSP, quantitative systems pharmacology.
The base model for HCC consists of 69 ordinary differential equations, and 116 parameters plus 12 parameters related to each of the immune checkpoint inhibitor for a total of 140 parameters. Physiologically realistic parameter ranges were estimated from the literature; the details for each parameter are given in online supplemental table S6.
Parameter selection and virtual patient generationWe generated virtual patients following the methods by Allen et al40 with minor modifications to their original approach described below. In their method, Allen et al randomly generated a parameter set such that the values of all parameters were physiologically realistic. Next, they used simulated annealing (SA), a Markov Chain Monte Carlo optimization algorithm, to ensure that the simulation outputs from the parameter set were also within physiologically realistic range. This was accomplished using an objective function that evaluated the squared Euclidean distance from the physiological output range; such that the contribution of the simulation outputs would be zero to the objective function if the outcome is within the physiological range. This reduces the computational cost of minimization since the optimization is not to specific points but within the plausible range. This process was repeated to get a large number of plausible patients; the final virtual patient population was then chosen such that the distribution of selected outputs matched that of the data. Selection was done using a Bayesian-based rejection sampling procedure40 where the probability of inclusion of a plausible patient as virtual patient is given by
 12\* MERGEFORMAT ()
where f (r) is the empirical probability density function of the clinical data,  approximates the density of plausible patients (as number of patients per unit volume) at the output value, r, using V5(r) which is the volume of a hypersphere whose radius is the distance to the 5th nearest neighbor. The proportionality factor, β, was fit using SA with the Kolmogorov-Smirnov (KS) statistic from a two-sample univariate KS test as the objective function.
In contrast, we used Latin Hypercube Sampling (LHS) to sample the parameter space using different estimated distributions for each of the parameter with descriptive statistics adjusted within the physiological ranges. The details of the parameters used for virtual patient generation are shown in online supplemental table S3. Out of 140 parameters, 89 parameters were selected to be sampled based on their relevance to HCC and to account for the biological mechanism of interaction of the drugs nivolumab (anti-PD-1) and ipilimumab (anti-CTLA-4) in the tumor. The detailed description of model parameters and their relevance has been highlighted in online supplemental tables S3 and S6. There are a total of 17 parameters that are cancer-specific out of which 16 were included in the sampling for virtual patient population to capture variability across HCC patients. Simulations that did not reach the initial tumor diameter during the initialization procedure (7%), failed to converge due to numerical instabilities (3%), or whose T cells densities were outside of a normal range for patients with HCC (18%) were rejected from the plausible patient population. To estimate the plausible patient cohort from proposed patient, we accept or reject the plausible patient as virtual patient based on physiological T cell densities in aHCC. Activated CD8+T cell density in the tumor was in the range of 0–63,000 cell/µL41 and CD4+FoxP3+ T cell density in the blood was 0–50 cell/µL.42 For our analysis we assumed two-fold CD4+ cell density in the blood rather than the range reported in the literature.42 This is due to the small sample size of the patients analyzed and to account for patient variability. In the study by Kalathil et al,42 blood samples of only 19 patients with aHCC were analyzed. T cell density in the tumor was calculated from area densities in immunohistochemistry images following the procedure in the study by Mi et al..43
To determine the virtual patient population, we employed the tumor size data of target lesion at individual patient level from the waterfall plot of CheckMate 040 in Yau et al.16 The best percent change in tumor diameter of the plausible patient population was compared with data obtained from the CheckMate 040 clinical trial for patients with aHCC treated with nivolumab and ipilimumab.16 Rejection sampling was used to determine the final virtual patient population using equation 1 with given a priori distribution of plausible population to select from, as done by Allen et al. Since any given value of β can result in different virtual populations, the objective function was the mean KS statistic out of five virtual populations generated from β. A graphical representation of the algorithm is presented in figure 2.
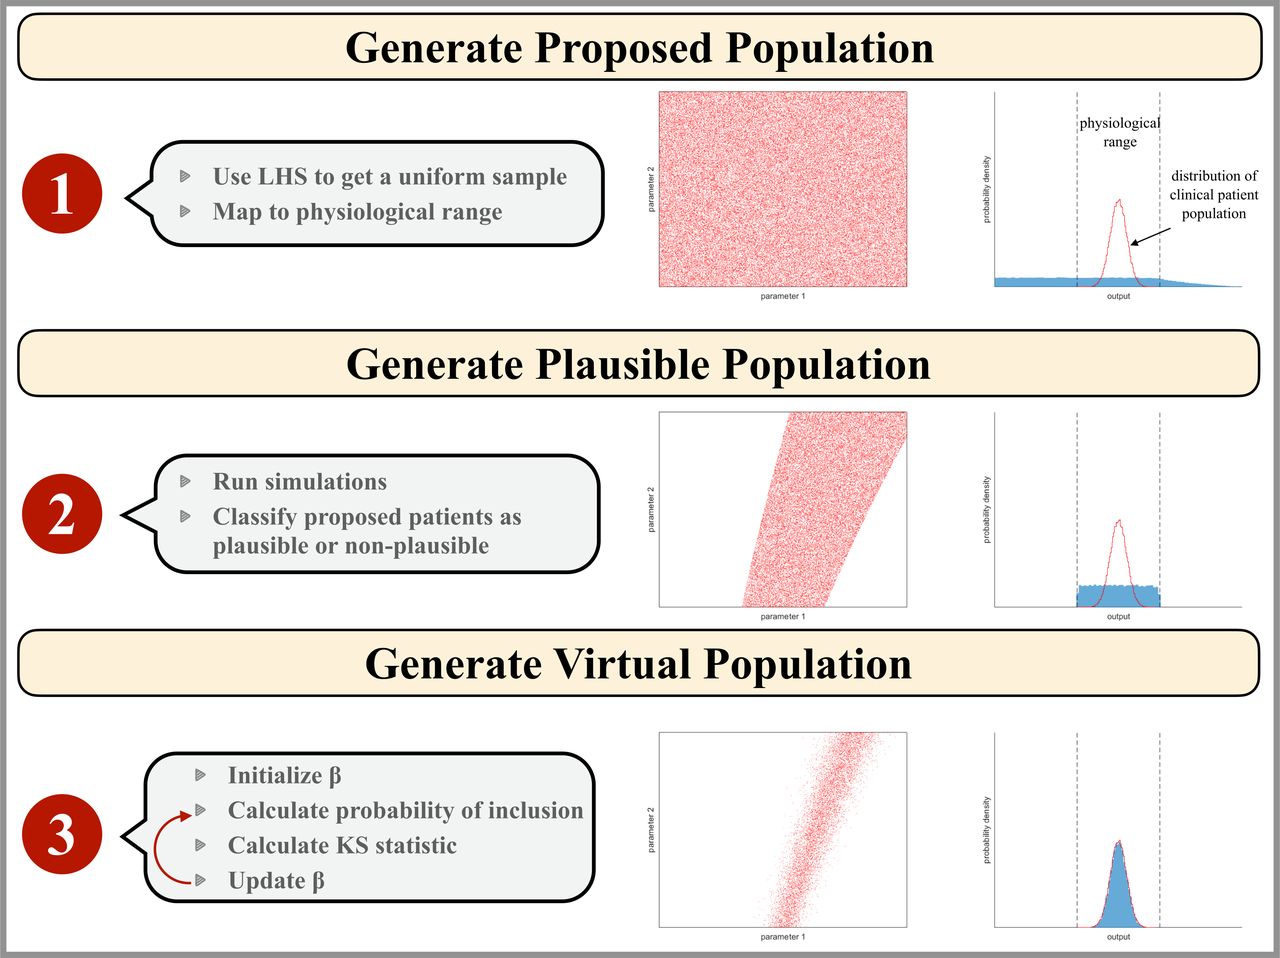 Figure 2
 Illustration of the virtual patient generation algorithm. Input parameter values are represented as red points in a two-dimensional parameter space which would correspond to a hyperspace for our model analysis. The blue histogram represents the model outputs that correspond to the clinical patient data available. The physiological range of output values is outlined by black dashed lines and the empirical distribution of the clinical population data is shown as a red line. Step 1: the proposed patient population is generated by mapping a Latin Hypercube Sampling (LHS) on the interval (0–1) to parameter space assuming a physiological parameter range for each parameter. Step 2: the plausible patient population is the subset of the proposed patient population whose simulation outputs are physiologically realistic. Step 3: the virtual patient population is a subset of the plausible patient population such that the distribution of virtual patient outputs reflects that of the clinical patient population.
Virtual clinical trialThe virtual clinical trial consisted of six treatment groups: no drugs, 3 mg/kg of nivolumab given every 2 weeks starting at t=0,15 1 mg/kg of ipilimumab given every 3 weeks starting at t=0 and three groups for the combination regimes of nivolumab and ipilimumab corresponding to the three arms (A, B, C) in the clinical trial, CheckMate 040. In arm A, 1 mg/kg of nivolumab and 3 mg/kg of ipilimumab were administered every 3 weeks (for 4 doses), followed by 240 mg of nivolumab every 2 weeks (flat dose). In arm B, 3 mg/kg of nivolumab and 1 mg/kg of ipilimumab were administered every 3 weeks (for four doses), followed by 240 mg of nivolumab every 2 weeks (flat dose). In arm C, 3 mg/kg of nivolumab was administered every 2 weeks with 1 mg/kg of ipilimumab administered every 6 weeks.16
Response Evaluation Criteria in Solid Tumors (RECIST)The analyses in this study were based on the RECIST V.1.1 classification,44 presented here for convenience. RECIST provides a means for classifying solid tumors based on their response to treatment; the classification is determined by the percent change in tumor diameter compared with baseline/smallest diameter recorded. Tumor diameter is defined as the sum of the longest diameters for each lesion of interest. In this study, we consider only one lesion and calculate its diameter based on the tumor volume assuming the tumor is spherical. The baseline tumor diameter is above 10 mm for the lesions to be measurable.
To perform the virtual patient evaluation by RECIST V.1.1 criteria, we assessed tumor diameter every 6 weeks with the first measurement at week 6 and baseline at time 0. The frequency of tumor measurement (ie, 6 weeks) corresponds patient evaluation in the CheckMate 040 trial. We assume tumor diameter less than or equal to 2 mm as complete disappearance of tumor. The criteria are summarized as follows. Complete response (CR) is characterized by a complete disappearance of the tumor with confirmation at consecutive assessment of 6 weeks. Partial response (PR) is defined as percent change between −30% and −100%, with reference as the baseline tumor diameter, PR is confirmed at the subsequent assessment. Progressive disease (PD) is characterized by an increase of at least 20% in the tumor diameter with reference to the smallest measured diameter; in addition, there must be an absolute increase of 5 mm in the tumor diameter. Stable disease (SD) is characterized by neither sufficient decrease nor increase in the tumor diameter to be classified as PR or PD, with smallest tumor diameter as the reference. We assume a minimum duration of 6 weeks for stable disease as followed in the clinical study. The overall response rate is calculated as the proportions of virtual patients with complete and PR. In the virtual clinical trial, we followed the above criteria, to closely mimic the clinical situation.
Random forestIn this study, we used random forest, a supervised machine learning technique, to assess the importance of biomarkers in determining whether a patient will respond to treatment. Briefly, random forests are an ensemble of decision trees generated using a subset of the predictors and a bootstrapped sample of the data; the decision of the random forest is the majority decision of the decision trees. The TreeBagger function in MATLAB was used to train the random forests. The number of trees was determined by using the out-of-bag (OOB) error, an estimate of the prediction error. OOB error converges as the number of trees are increased; online supplemental figure S6 shows the convergence of the OOB error for 1000 trees.
The random forest was trained using the simulation results from the QSP model of HCC for all the virtual patients treated with the combination of nivolumab and ipilimumab. The accuracy of the random forest was assessed using the simulation results from 50 additional randomly generated virtual patients; only the results of successful simulations were considered. The importance of the predictors was estimated by randomly permuting all the observations of the predictor and calculating the influence of the predictor on the model’s ability to predict patient response. This is performed by finding the change in OOB error which would be affected on permutating the values of the predictor. Predictors with the largest changes in OOB error were considered to be important predictors, that is, biomarker in our application.
ResultsFive thousand parameterizations of the model were generated by varying 89 of the 140 parameters by using a LHS that was mapped to a physiological range. Details of the parameterizations are given in online supplemental table S1. Each model parameterization was simulated six times: once without treatment, once with nivolumab treatment, once with ipilimumab treatment and three times with the combination of nivolumab and ipilimumab for the three arms with different dose regimen (see methods) in CheckMate 040 clinical trial. All our simulations were performed in MATLAB SimBiology Toolbox using the ode15s solver.
Unlike actual clinical trials, in virtual clinical trials the same patient can be treated with different treatments. To predict the outcome of all the treatments, we generate a cohort of virtual population from the initial 5000 proposed patients using the clinical information of the patients with HCC and data from the CheckMate 040 trial, for the combination therapy of nivolumab and ipilimumab. Of the 5000 parameter sets, 3622 sets were successful in all six treatment groups, giving us a large set to perform virtual trials. The remaining proposed patients either did not reach the initial tumor size or failed to converge or their T cell count was outside the normal range of that in patients with HCC. These parameter set are the common proposed patients that are used as input for determination of the plausible patients based on the physiologically reasonable range of T cell counts in HCC patients. Out of these proposed patients, 1747 were identified as plausible patients common to all the treatment groups. The final virtual cohort was generated using the information of the best percent change in tumor diameter for the combination treatments of all the three arms of CheckMate 040.16 We compare the distribution of the best percent change in tumor diameter from the simulations of the combination treatment arm A to combination treatments of CheckMate 040. We chose arm A since among the three arms in CheckMate 040 with different dose regimens, only arm A was approved by the FDA.45 The distribution of the plausible patient population which were used as initial virtual population was significantly different from that of CheckMate 040 (p<0.05; KS=0.28). After fitting, the distribution of final virtual patient population was the same as that of CheckMate 040 as assessed by the KS goodness-of-fit test (p<0.05; KS=0.004) with beta=1080.5.
For each treatment group, we calculated the response rate and classified the plausible and virtual patients into four categories according to RECIST V.1.1: CR, PR, stable disease (SD), and PD. The overall response rate for monotherapy of nivolumab, ipilimumab and combination therapy of nivolumab plus ipilimumab with dose regimen of arm A for plausible patient cohort was 16.05% (95% CI 11% to 22%), 3.29% (95% CI 1% to 6%), and 19.62% (95% CI 10% to 32%), respectively. The corresponding response rate for virtual patient cohort was 19.41% (95% CI 14% to 26%), 2.64% (95% CI 1% to 6%), and 23.08% (95% CI 12% to 36%), respectively. The overall response rate reported in CheckMate 04015 for monotherapy of nivolumab (dose expansion phase, 3 mg/kg) and combination of nivolumab and ipilimumab with arm A regimen was 20% (95 % CI 15% to 26%) and 32% (95% CI 20% to 47%), respectively. This shows an agreement between the model prediction and the clinical results of CheckMate 040 trial. The response of virtual cohort is improved as compared with that of the plausible cohort implying that the virtual cohort is a close representation of the patients in the clinical trial. The comparison of the response rate predicted by the model with the clinical results of all the treatment groups is shown in figure 3. Notably, there has not been a clinical trial for monotherapy of ipilimumab in HCC. Here, the 95% CIs were calculated using bootstrap sampling of the virtual patients. The bootstrap sampling size was set to the number of patients enrolled in the respective clinical study with the assumption of 200 patients in both no treatment and monotherapy of ipilimumab. The corresponding two-sided CIs were estimated using the Clopper-Pearson method in the clinical trial.
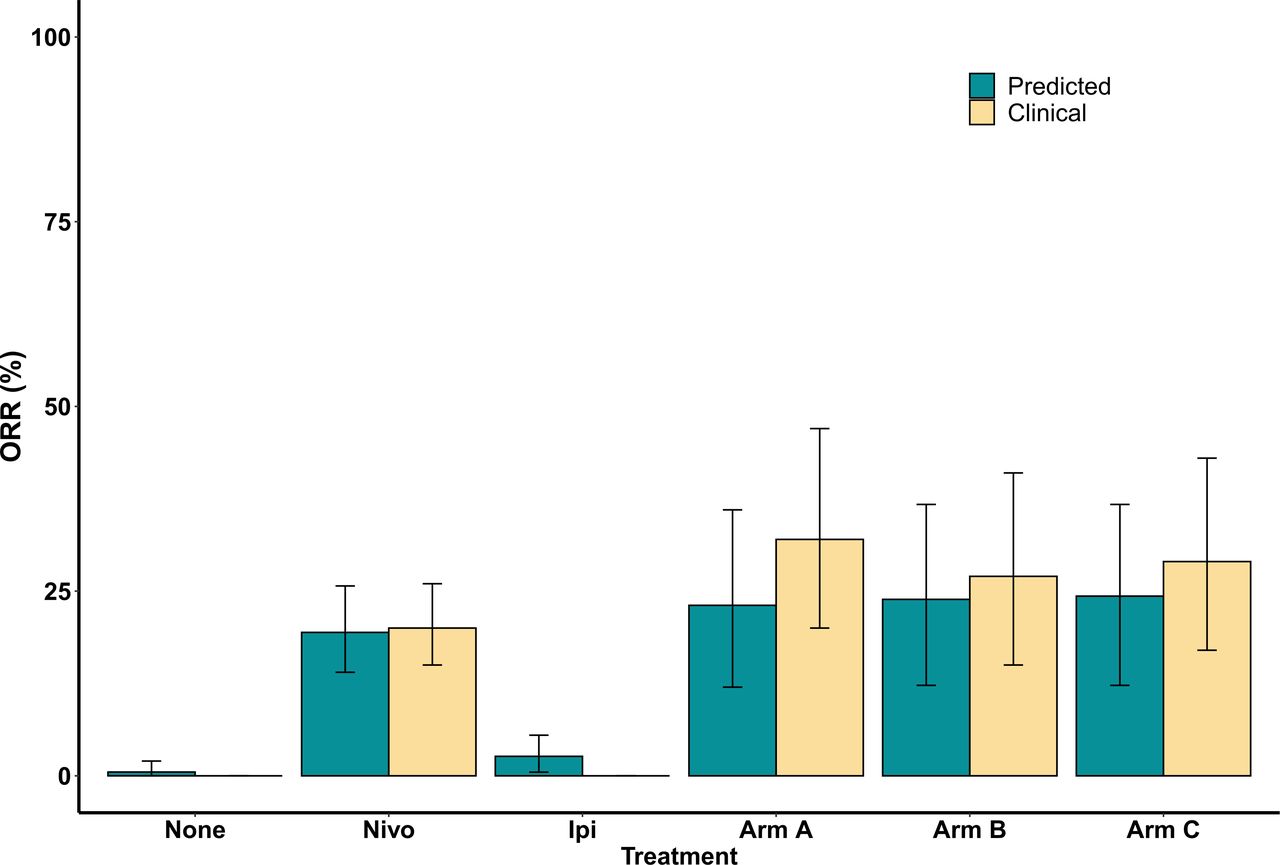 Figure 3
 Overall objective response rate (ORR) comparison between model prediction and clinical trial CheckMate 040 results for all the treatment groups.
In the above analysis, we followed the RECIST V.1.1 criteria of confirming the complete and partial responders at subsequent tumor measurement To compare we also assessed the response status without confirmation of complete and partial responder at subsequent tumor measurement. We found that the overall response for virtual cohort for monotherapy of nivolumab and combination treatment (arm A) was 23.1 and 27.8% (online supplemental table S2) which is higher than the above-mentioned results. We suspect this is because some patients may relapse after initial response to the treatment and so at subsequent assessment they are not considered as responders.
The simulation outcomes of all the virtual patients were classified into different response status based on RECIST V.1.1. Our model can predict both partial and complete responders. The virtual patient cohort is common in all the treatment groups while the number of plausible patients varied. There were 1915 plausible patients in no treatment group out of which 1,365 were determined as virtual patients (620 PD; 738 SD; 7 PR; 0 CR); 2,143 plausible patients with nivolumab treatment with 1,365 virtual patients (482 PD; 618 SD; 242 PR; 23 CR); 1,916 plausible with ipilimumab treatment with 1365 virtual patients (485 PD; 844 SD; 36 PR; 0 CR); 2,171 plausible with arm A combination treatment with 1365 virtual patients (377 PD; 673 SD; 299 PR; 16 CR); 2,185 plausible patients for arm B combination treatment with 1,365 virtual patients (373 PD; 666 PD; 309 PR; 17 CR); and 2,193 with arm C combination treatment with 1,365 virtual patients (362 PD; 671 PD; 315 PR; 17 CR). Table 1 shows the comparison of this classification for the simulation results of nivolumab monotherapy and the combination of nivolumab and ipilimumab (arm A) with that of the clinical trial of CheckMate 040.16 Online supplemental table S2 shows the results of virtual patients for the remaining four treatment groups.
Table 1Summary of the endpoint results of the virtual patients in the simulations and CheckMate 040 for monotherapy of nivolumab (dose expansion phase, 3 mg/kg) and combination treatment of nivolumab and ipilimumab (arm A)
The predictions from the simulations for the per cent changes in tumor diameters for the course of the treatment in each class (CR, PR, SD, and PD) are shown in figure 4. The solid line is the mean for individual class and the shaded region is the 95% prediction interval. Figure 5 shows the waterfall and spider plots for patients from the CheckMate 040 clinical trial, the virtual clinical trial of nivolumab only, the virtual clinical trial of ipilimumab only, and the virtual clinical trial of nivolumab in combination with ipilimumab for the three arms of CheckMate 040. Outcomes of the virtual patients from the simulations are consistent with those reported in the clinical trial.
 Figure 4
 Mean per cent change in tumor diameter as a function of the time after the beginning of treatment for virtual patients. Simulations were grouped according to RECIST criteria; progressive disease (PD; x>20%; red), stable disease (SD; −30%≤x ≤ 20%; yellow), partial response (PR; x < −30%; cyan), and complete response (CR; x = −100%; green). Shaded regions correspond to the 95% CI of the simulations in the corresponding RECIST category. RECIST, Response Evaluation Criteria in Solid Tumors.
 Figure 5
 Waterfall (left) and spider plots (right) are shown for clinical trial CheckMate 040 and as predicted by the proposed QSP model for HCC. (A) CheckMate 040, (B) monotherapy of nivolumab, (C) ipilimumab monotherapy, combination treatments for (D) arm A (E) arm B (F) arm C. The waterfall plots show the best percent change in tumor diameter from baseline for each patient in the trial. The spider plots show the per cent change in tumor diameter at each measurement time point (every 6 weeks) for 100 randomly selected virtual patient. CR, complete response; HCC, hepatocellular carcinoma; PD, progressive disease; PR, partial response; QSP, quantitative systems pharmacology; SD, stable disease.
To determine potential biomarkers that can predict if a patient will respond to treatment, we performed subgroup analysis using 11 measurable pretreatment biomarkers. Virtual patients were divided into subgroups based on the median value for each biomarker, and the ORR was calculated for each subgroup (figure 6). Based on the analysis of the combination therapy, the biomarkers responsible for the largest changes in ORR were T cell density, Treg density and antigen binding affinity. The analyses for nivolumab and ipilimumab as monotherapy and as combination therapy for dose regimen of arm B and C are given in the online supplemental information and figures S1–S4, respectively.
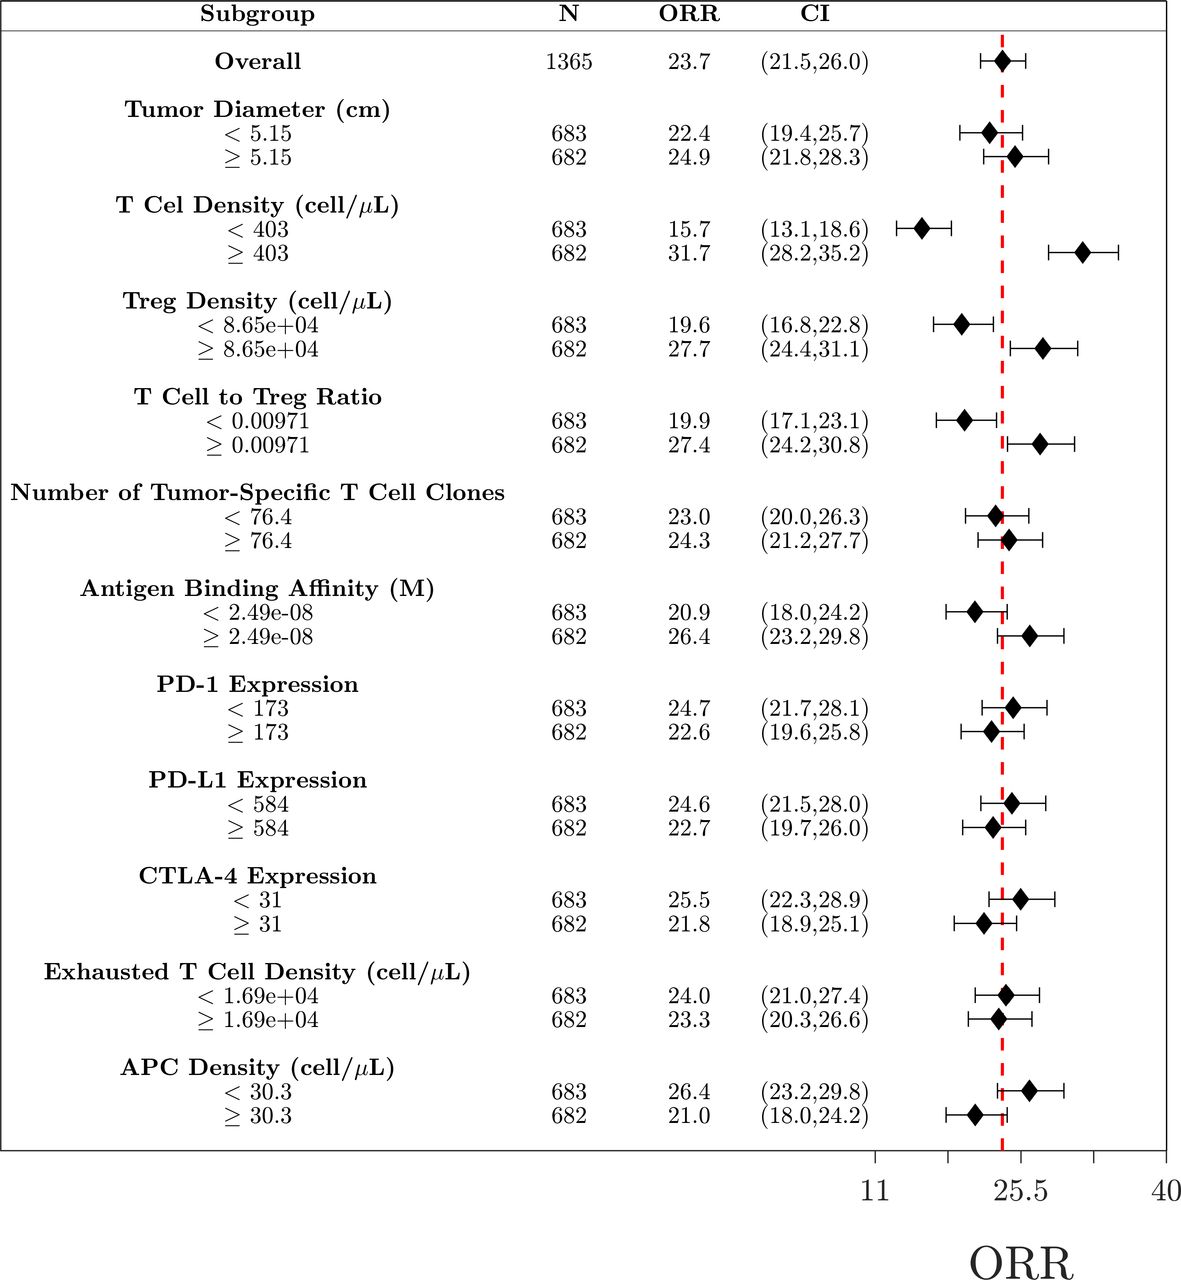 Figure 6
 Subgroup analysis of the combination therapy. Virtual patients (N=1365) are divided into 22 subgroups based on the pretreatment values of selected biomarkers. Objective response rates (ORR) for each group are given along with the 95% CI estimated by the Agresti-Coull interval. The red dashed line indicated the ORR for the total population. APC, antigen-presenting cell.
A random forest consisting of 1,000 trees using the 11 biomarkers as predictors was trained using the simulation results from the combination therapy arm A (1,365 virtual patients). The prediction error was 22.9%, estimated by the OOB error (online supplemental figure S6). To get a more accurate assessment of the prediction error, a test set of 50 new virtual patients was generated. The random forest was able to correctly classify 95.7% of the patients (4.3% false positive rate and 0% false negative rate) resulting in a prediction error of 4.3%. The importance of each biomarker was assessed by calculating the mean increase in OOB error caused by the random permutation of all the observation of each predictor; the results are shown in figure 7. A similar assessment was performed for all the treatment groups to identify the important biomarkers (online supplemental figure S5).
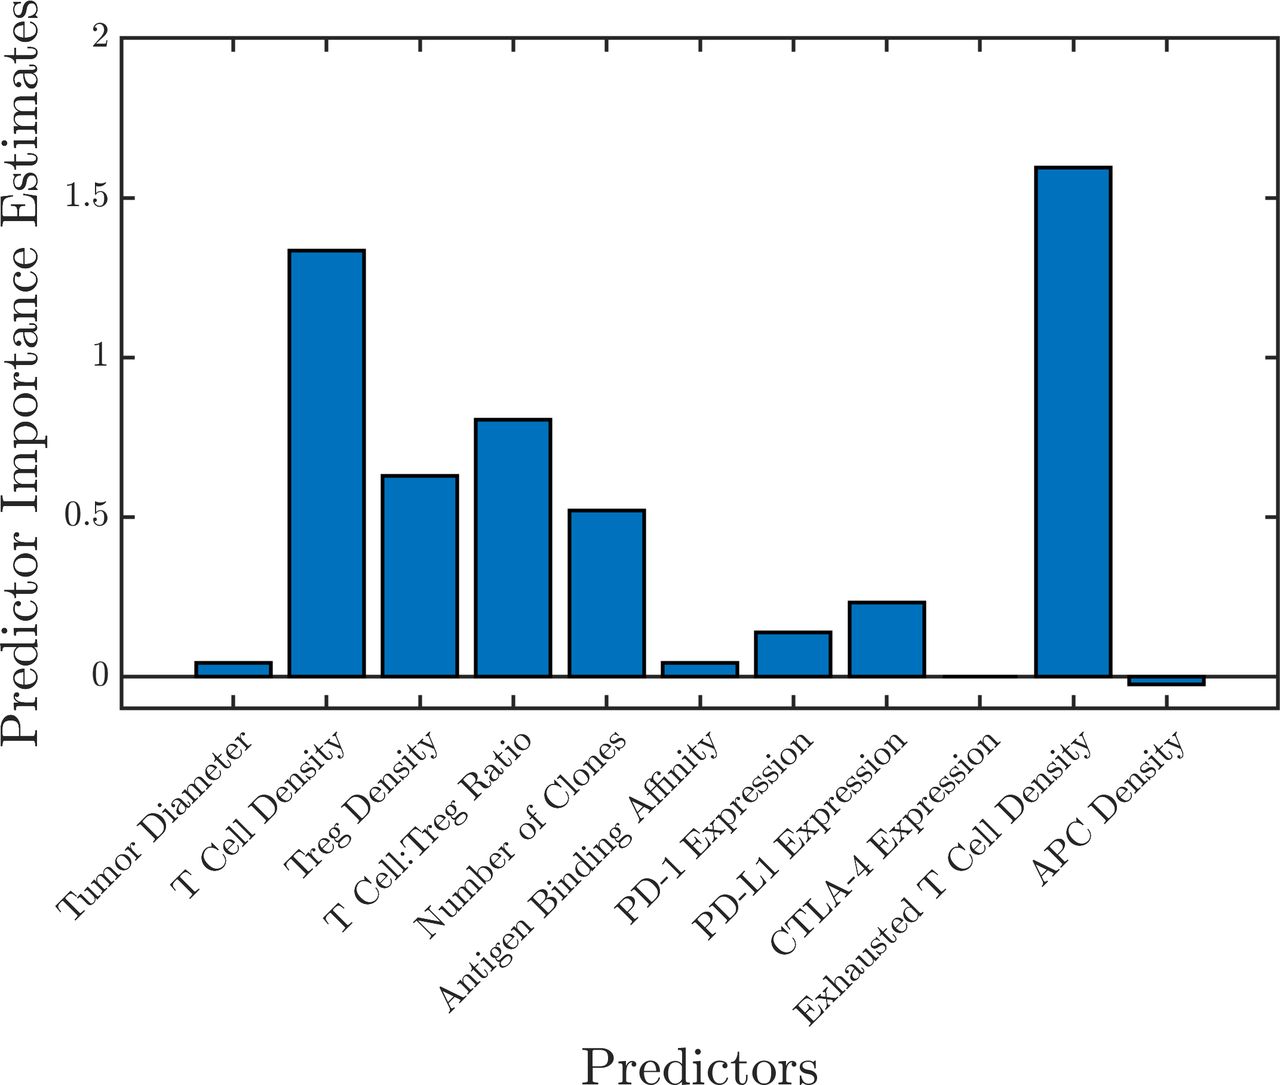 Figure 7
 Predictor importance estimated by random forest using the mean increase in out-of-bag error caused by permuting the observations of each predictor. This shows the important predictive biomarkers for the combination therapy (arm A). APC, antigen-presenting cells.
A second random forest (1,000 trees; OOB error 22.7%) was created using the six most important biomarkers in all the treatment groups: cytotoxic T cell density, Treg density, T cell to Treg ratio, number of tumor-specific T cell clones, PD-L1 expression, and exhausted T cell density. This forest was able to predict the classification of 91.3% of the patients (6.5% false positive rate and 2.2% false negative rate) resulting in a prediction error of 8.7%. The convergence of OOB error with the number of trees used to generate the random forest for all the treatment groups is shown in online supplemental figure S6. The pretreatment and post-treatment distribution of the top six predictive biomarkers estimated by the random forest for combination therapy of nivolumab and ipilimumab (arm A) is shown in figure 8. This shows that virtual patients with high T cell count and high T cell to Treg ratio respond better to the treatment. These can potentially be important predictive biomarkers in aHCC patients for anti-PD1 and anti-CTLA4 immunotherapy.
 Figure 8
 Distribution of potential biomarkers at pretreatment and post-treatment in responders and non-responders for the treatment of combination of nivolumab and ipilimumab (arm A) in HCC patients. Statistical significance is calculated using Wilcoxon test. HCC, hepatocellular carcinoma; ns, not significant; ***, p<=0.001; ****, p<=0.0001.
DiscussionIn this study, we presented an analysis of the treatment of aHCC using PD-1 and CTLA-4 immune checkpoint inhibitors, nivolumab and ipilimumab, using a QSP model of aHCC. To our knowledge this is the first QSP model of HCC. We also presented our procedure for virtual patient generation which extends from the work of Allen et al.40 We then applied our virtual patient generation procedure to retrospectively predict the clinical trial results of the combination of nivolumab and ipilimumab for the treatment of aHCC. Additionally, we used a machine learning approach to quantify the importance of potential biomarkers.
The FDA has approved nivolumab and ipilimumab combination therapy for the treatment of several cancers including metastatic melanoma, advanced renal cell carcinoma (RCC), colorectal cancer (CRC), HCC, non-small cell lung cancer (NSCLC) and, most recently, malignant pleural mesothelioma. This combination immunotherapy had ORR of 50% in melanoma (CheckMate 06746) 42% in RCC (CheckMate 21447), 49% in CRC (CheckMate 14248), 32% in HCC (CheckMate 040); and 36% in NSCLC (CheckMate 22749). Simulating the treatment with our mechanistic QSP model of HCC, we predicted that the combination therapy would have an ORR of 27.8% (arm A) which falls within the confidence interval (21.8%–48.9%) of the results of the CheckMate 040 clinical trial16 for HCC providing partial validation that modeling approach is predictive and cancer-specific. To further test the predictability of our model, we also conducted a preliminary analysis for monotherapy of pembrolizumab on 1,000 proposed patients in accordance with the clinical trial, Keynote-224.14 The simulated per cent change in tumor diameter over the course of treatment in each class of patients (based on RECIST V.1.1) is shown in online supplemental figure S7. Our prediction for overall response rate was 16.6% which is close to the response rate of 17% as observed in Keynote-224 (online supplemental table S3). This shows that such detailed mechanistic models can be used to design new combination therapies for HCC and the optimum dose by predicting the efficacy of different dosing strategies.
Virtual patient generation has become an active area of research as QSP becomes a more prominent tool in the pharmaceutical industry. Despite the mechanistic detail included in the models, the population level statistics are highly sensitive to virtual patient generation. There are various approaches for virtual patient generation. A comprehensive study of methodological considerations for virtual population in QSP model was done by Cheng et al.50 A simple approach is to select input parameters from a known distribution.21 23–26 51 This approach has the benefit of both being simple to implement, and computationally inexpensive. The drawback being that the distribution of outputs may not reflect the clinical population. Another approach is to assign weight to virtual patients such that the distribution reflects the clinical population.52–54 These methods tend to be more computationally expensive, but have the benefit of accurately representing the population level statistics. One potential drawback is that this approach limits the diversity of the virtual patient population.55 A third approach is to generate physiologically plausible patients and use rejection sampling to fit the population level statistics.40 55 This approach has the benefit of both being computationally efficient and reduces the likelihood that unlikely patients get overrepresented in the virtual population.40 55
The approach presented in this work follows that of Allen et al40 with some modifications. The main differences are in the way our plausible patients are generated. In their study, Allen et al randomly chose a physiologically realistic point in parameter space, and then optimized that point so that the outputs are also physiologically realistic. In our approach, we randomly choose a physiologically realistic point in parameter space, then either accept or reject it based on the outputs of the solution. Although, we end up rejecting just over 35% of our simulations, we found that, for application of QSP models, our approach is computationally more efficient than using an optimization to generate plausible patients.
Rieger et al55 expanded on the work by Allen et al40 by exploring three other means of generating the plausible patient population by using either nested SA (NSA), a modified genetic algorithm (GA) for optimization or a modified Metropolis-Hastings (MH) algorithm to replace the original SA optimization step from Allen et al. In their study, the authors compared the algorithms on the basis of the efficiency of going from the plausible population to the virtual patient population (ie, number of proposed patients needed to reach a specified goodness-of-fit), the computational cost, the convergence of the virtual population to the clinical population and the diversity of the virtual patient population. They concluded that their NSA approach is the most efficient, but also the most computationally costly and the MH approach was computationally fastest, however, the final virtual population was less diverse than the other approaches.
Although we did not make direct comparisons to their approaches, our approach converged to the clinical population and had low computational cost. We also expect our approach to be less efficient since we used a rejection-based approach rather than an optimization routine to generate the plausible patient population from the proposed population.
One of the biggest challenges is the availability of clinical data that can be used to obtain our final virtual patient population. In this study, we used the best per cent change in tumor diameter, which is often provided in the form of a waterfall plot. Despite its availability, using tumor diameter poses a problem for predicting novel therapies. However, other population-level information could be extremely valuable, such as distribution of the densities of different T cell populations in the tumor, T cell densities in the blood, or the densities of other cell types in the tumor immune microenvironment.56 57 Using pretreatment distributions could potentially be an effective way to create virtual patients for predictive studies.
Using subgroup analysis and machine learning on our simulation results, we identified six important biomarkers for the prediction of immunotherapy response in HCC. Based on our analyses, patients with high tumor infiltrating lymphocyte (cytotoxic T cells, Tregs and exhausted T cells) densities and high T cell to Treg ratio are more likely to respond to this treatment. Increased CD8+T cell infiltration has been associated with response to immune checkpoint inhibitor treatment in HCC58–60 and in other cancers.61 62 Infiltration of CD8+T cells and CD4+T cells has been reported in HCC in a recent study of communication landscape in tumor microenvironment.57 PD-L1 expression may affect response to this therapy and their expression can be controlled by epigenetic modifications, genomic alterations, regulation at transcription, post-transcription and post-translation levels for better response rates.63 Our subgroup analysis also shows that patients with high antigen binding affinity are more likely to respond to this treatment. Although no single biomarker has been confirmed for immune checkpoint inhibitors in HCC,64 65 several studies report positive correlation with response to immune checkpoint inhibitors in melanoma and lung cancer.61 66–68
There have been many efforts recently to incorporate machine learning into mechanistic modeling.69–72 For example, Ribba et al used reinforcement learning with a mechanistic model of tumor inhibition in glioma response to chemotherapy and radiotherapy in application to precision dosing69 Despite the lack of clinical data availability, QSP model simulations produce a large amount of data that can be difficult to analyze by using traditional techniques. In this study, we have demonstrated one
留言 (0)