
記住我
In this study, it was discovered that metformin increases HNC NK cell numbers and metformin inhibits the CXCL1 pathway resulting in patient with enhanced HNC NK cellular cytotoxicity of HNC tumor cells.
HOW THIS STUDY MIGHT AFFECT RESEARCH, PRACTICE OR POLICYIntroductionHead and neck cancers (HNC) are the sixth most common malignancy worldwide.1 Most cancers of the head and neck are squamous cell carcinoma (HNSCC). Etiologic factors include alcohol and tobacco use, and infection with oncogenic viruses including human papilloma virus (HPV). Over 70% of new HNSCC cancers present as locally advanced disease (LAHNSCC) requiring multimodality treatment.2 For patients with locally advanced disease ineligible for resection, concurrent cisplatin-based chemoradiotherapy (CRT) is still recognized as the standard of care treatment.3 Despite improved outcomes with CRT, there is still a high level of disease recurrence, especially in the HPV-negative, smoking population, necessitating improved treatment regimens.3 4
Treatment combinations involving immunotherapy have emerged as promising options to combat advanced stage disease. Additionally, alternative drug development studies have begun to explore repurposing medications originally intended to treat other non-cancer diseases. Metformin, a biguanide, is Food and Drug Administration approved to treat type II diabetes, polycystic ovary disease, and has recently been examined in cancer clinical trials.5 6 In preclinical studies, metformin has been shown to have anticancer effects in solid tumors,7–9 mainly through stimulation of the AMP-activated protein kinase (AMPK), and subsequent inhibition of the mechanistic target of rapamycin (mTOR).10 11 Furthermore, in HNSCC, it has been shown to prevent the development and progression of oral tumors in mouse models.12
Recent evidence suggests metformin may also impact the host immune system by playing a key role in maintaining the multifunctional capacity of tumor-infiltrating lymphocytes (TILs),13 including infiltration and activation of effector memory T cells (TEM), natural killer cells (NK), and natural killer-like T (NKT) cells in a liver-injury mouse model.14 Reducing oxygen consumption further potentiated TIL functionality, and, in combination with anti-programmed death 1 signaling blockade, metformin resulted in enhanced tumor growth inhibition.15 Despite the evidence of the effect of metformin on lymphocytes in the tumor microenvironment (TME), little is known about these effects in peripheral blood mononuclear cells (PBMC) which migrate to the tumor site on antigen stimulation. In accordance with the phase I open-label single site dose escalation study combining metformin and CRT in LAHNSCC, we investigated the effects of metformin on peripheral immune cells from patients on a clinical trial and further investigated these responses ex vivo.6
Here, we show that metformin increases both number and activity of peripheral NK cells and rescues patient with HNSCC NK cell-mediated cytotoxicity at least partially through CXCL1 inhibition revealing a new mechanism by which metformin exerts an antitumorigenic effect. Our findings provide further understanding of the antitumorigenic role of NK cells in HNSCC and potential new targets for rational combinations with other immunotherapeutic agents to yield improved clinical outcomes in patients with HNSCC.
MethodsHuman samplesPeripheral blood and serum were obtained from patients from the phase 1 clinical trial of metformin in combination with CRT in patients with locally advanced (Stage III/IV) HNSCC (NCT02325401) at the University of Cincinnati. Key eligibility criteria for patient inclusion on trial were confirmation by tissue biopsy of newly diagnosed LAHNSCC that was unresectable with no prior chemotherapy or radiation treatment. Key exclusion criteria included metastatic disease, known history of diabetes requiring insulin, or nasopharyngeal carcinoma as the primary tumor site. In addition, it was confirmed that patients had not received metformin prior to study entry. Blood samples were collected before and after 14 days of treatment with metformin and prior to chemotherapy and radiation. Primary tumor specimens were obtained from subjects enrolled in another previous investigator-initiated HNSCC surgical trial carried out in accordance with the recommendations of the Thomas Jefferson University Institutional Review Board (IRB) (NCT02083692). Criteria for NCT02083692 can be found in Amin et al.16 Samples used in this study were from patients with no prior history of chemoradiation prior to surgical resection. Patients received metformin for 9–24 days prior to surgery. Additional ex vivo studies were performed on age-matched peripheral blood obtained from IRB-approved studies UCCI-UMB-14–01 (IRB #2014–4755) and general specimen collection protocol (IRB #2017–2137) to investigate differences in molecular and immune cell markers compared with clinical outcomes in patients with HNSCC and normal healthy controls. The studies were approved by the IRB at the University of Cincinnati and were conducted in accordance with Good Clinical Practice guidelines and the Declaration of Helsinki. Written informed consent was received from all participating patients prior to enrollment.
Cell linesHuman-derived HNSCC cell lines UMSCC-47s (kindly gifted by Randall Kimple, University of Wisconsin) and Cal27s (kindly gifted by Nira Ben-Jonathan, University of Cincinnati). Cell lines were were grown and maintained in 1× Dulbecco’s Modified Eagle Medium (DMEM) high glucose, 8 mM L-glutamine, 10% fetal bovine serum (FBS), 1% Pen/Strep and 1× non-essential amino acids. All cell lines were cultured at 37°C with 5% CO2. Cell culture reagents were obtained from Corning, with the exception of FBS (Omega Scientific). Mycoplasma presence was checked every 3 months (MycoProbe, R&D Systems, Minneapolis, Minnesota, USA) and reported no cases of contamination within these cell lines as of February 2022. UMSCC47 and Cal27 cell lines were STR Profiled confirmed by Cincinnati Children’s Hospital Medical Center Cytogenics Laboratories in May 2020.
Primary cell lines and TILsTumor tissue was collected from patients with untreated HNSCC undergoing surgical resection. Tissue was minced and digested in 0.25% trypsin. Half of the tissue was plated onto irradiated T293 feeder cells to establish primary cell lines in keratinocyte media (DMEM/F12, 24.2 µg/mL Adenine Sigma, 1× non-essential amino acids, 100 µg/mL Primocin, 0,4 µg/mL hydrocortisone Sigma, 5% FBS, 1× sodium pyruvate, 8.3 ng/mL high Cholera toxin Sigma, 10 µM rock inhibitor Cayman chemical, 1× ITS Thermo Fisher and 0.05 µg/mL EGF Sigma)) and half was plated into 24-well plates in TIL media (Roswell Park Memorial Institute [RPMI], 1× Pen/Step, 1× sodium pyruvate, 2.5 mL of 7.5% stock solution sodium bicarbonate, 0.00025% 2-mercaptoethanal Fisher, 10% human serum Sigma, 6000 U/mL interleukin (IL)-2 (PeproTech), and 100 µg/mL Primocin) Invivogen. Cells were continuously cultured and split regularly to maintain growth.
Flow cytometry for peripheral immune cell characterizationFlow cytometry was performed on thawed PBMC samples. Cells were quickly thawed, washed in flow buffer (FB) (1× phosphate buffered saline + 2% FBS), and fixed for 1 hour at room temperature (RT) in 1.6% paraformaldehyde (PFA, Electron Microscope Sciences, Hatfield, Pennsylvania, USA). Cells were then washed and stained with the appropriate antibodies for 1 hour at RT in the dark, washed in FB, and analyzed by flow cytometry. For intracellular staining, cells were quick thawed, washed in FB, and fixed with 1.6% PFA for 1 hour at RT, followed by washing with FB. Cells were then permeabilized with buffer (Thermo Fisher Scientific) and stained with intracellular antibodies for 1 hour at RT in the dark. Cells were washed and analyzed by flow cytometry. Flow cytometry was performed at Shriner’s Hospital for Children in Cincinnati, Ohio, USA, using a 5-laser BD LSRII equipped with a ultraviolet laser (355 nm). Data were analyzed with FlowJo V.10. Populations are defined as follows: CD56brightCD16–CD3– were considered cytokine producing NK cells, CD56dimCD16+CD3– were considered cytotoxic NK cells, CD56+CD3+ were considered NKT cells, CD56–CD3+CD8+ were considered cytotoxic T cells, and CD56–CD3+CD4+ were considered helper T cells.
ELISAELISA kits for interferon (IFN)-γ, transforming growth factor beta (TGF-β), and CXCL1 were obtained from R&D Systems. ELISA for perforin obtained from ABCAM. ELISAs were performed according to the manufacturer’s protocol.
Single-cell multiplex cytokine profilingPBMCs were thawed and stimulated with 100 U/mL of IL-2 for 16 hours. PBMCs were prepared per manufacturers protocol for CD56 isolation (Miltenyi Biotec #130-050-400). Isolated CD56+ cells were prepped according to IsoPlexis’ Isocade Single Cell Polyfunctional Strength protocol and treated with 12 mM metformin. Approximately 30,000 cells were loaded onto IsoPlexis Single Cell Secretome IsoCode chips (IsoPlexis, Haven, Connecticut, USA) and analyzed with the IsoLight system.
Tissue stainingTissue slides were baked for 1 hour at 60°C. Slides were deparaffinized and incubated in antigen retrieval solution (BioGenex HK086-9K) for 20 min at 90°C. Slides were then washed, blocked in 10% goat serum and 1% bovine serum albumin (BSA) in tris-buffered saline (TBS) overnight, incubated in primary in the block agent overnight, washed in TBS and incubated overnight with secondary (Invitrogen 2149786). Slides were washed, incubated overnight with conjugated antibodies, washed, and stained with 1:1000 diluted DAPI in block agent for 15 min. Slides were washed and mounted with Fluoromount-G (Invitrogen 00-4958-02) and imaged on Zeiss Axio Observer Z1 inverted microscope connected to a Zeiss LSM710 confocal with available laser lines of 405, 458, 488, 514, 561 and 633 nm. Images were analyzed using ImageJ (NIH). Number of NK cells were determined by using the measure particles function on NKp46 only images. Number of infiltrating NK cells was determined as particles within pan-cytokeratin (PCK) stained areas.
Natural killer cytotoxicity assayNK cells were isolated from PBMCs using the EasySep Human NK Cell Isolation Kit (STEMCELL Technologies). Cells were washed in Robobuffer and treated with drug indicated in legend for 24 hours in culture medium. One day before co-culture, cells were collected, washed, and stained with 5 (6)-Carboxyfluorescein diacetate N-succinimidyl ester (CFDA-SE) (STEMCELL Technologies). Untreated UMSCC47, Cal-27, or matched primary HNC tumor cell lines cells were plated at 20,000 cell/mL and assumed to double overnight. NK cells were resuspended in RPMI 1640 (Corning) with 5% human serum at a density of 200,000 cells/mL. Cells were co-cultured for a target:effector ratio of 1:5 for 4 hours, collected, and washed in flow buffer. Cells were then stained with 7AAD Viability Staining Solution (BioLegend). Cells were immediately run on a 4-laser BD Instrument (University of Cincinnati Cancer Cell Biology Department, Cincinnati, Ohio, USA). Target cells were considered any cell that was CFDA-SE+. Any 7AAD+ cells were considered dead cells. NK killed cells were calculated by the following equation: (%CFDA-SE+7AAD+experimental co-culture) – (%CFDA-SE+7AAD+control no co-culture).
RNA sequencingHNC NK cells were isolated as above and were treated with vehicle or 12 mM metformin for 24 hours. Cells were washed, suspended in CyroStor, and frozen. Samples were sent to Genewiz/Azenta for standard RNA sequencing (RNA-seq) profiling. Sequence reads were aligned to the current reference mouse genome (GRCh38) using the STAR aligner17 18 and the reads aligned to each known gene were counted based on the latest GENCODE definitions of gene features.18 19
Western blot analysesNK92 cells were cultured with drug as described in legend. Cells were collected in radioimmunoprecipitation assay buffer (RIPA) (0.05% sodium deoxycholate, 150 nM NaCl, 50 nM Tris HCL, 0.1% SDS, 1% NP-40). Protein content was analyzed by Pierce BCA kit (Thermo 23225). 50 µg of protein was diluted in 1× loading buffer (SDS, bromophenol blue, 47% glycerol, Tris 0.5 M pH 6.8, 0.2 mM DTT-G) and heated to 90°C for 3 min. Prepared lysate was loaded into gradient gels (Bio-Rad 4561093) and run at 85V for 1.5 hour in Bio-Rad casing with a Bio-Rad powerpack in 1× running buffer (Tris, Glycine, SDS). Gels were transferred on nitrocellulose and run at 100V on bench for 1 hour in 1× transfer buffer (Tris, Glycine). Membranes were blocked in 5% BSA in TBS for 1 hour, washed, and incubated in primary diluted in 2% BSA in TBS overnight. Membranes were washed and incubated in Licor secondary (Licor 926–32211 and 925–68070) in 5% BSA in TBS for 1 hour. Membranes were washed and imaged on a Licor Odyssey Clx. Images were analyzed in Image Studio Lite V.5.2.
StatisticsUnpaired two-tailed t-test with Welch’s correction was used for analysis between flow cytometry in controls versus patients with HNSCC. A two-tailed Students t-test was used to compare differences between patients with HNSCC before and after treatment in flow cytometry and cytokine experiments. Differences in immune cell populations between three groups were compared by one-way analysis of variance with specific post-hoc contrasts. Natural killer cytotoxicity assay (NKCA) data were compared using a paired t-test. Statistical analysis was performed in GraphPad Prism (V.10). Differences between groups were considered statistically significant when p<0.05. Paired-sample differential gene expression analysis of RNA-seq data was performed by fitting a two-factor generalized linear model based on negative-binomial distribution of read counts as implemented in the edgeR Bioconductor package.17 20 In the two-factor model, the factor of interest was the metformin treatment and the blocking factor corresponded to five patients from whom the HNC NK cells were isolated. The p values for the metformin treatment effect were adjusted based on false discover rates.18 19
ResultsPeripheral blood NK cells are reduced and dysfunctional in patients with HNSCCLow NK cell counts in peripheral blood (PB) confer a poor prognosis in patients with both solid and non-solid tumors21 while the presence of highly activated PB NK cells correlate with improved prognosis.22 Circulating levels of NK cells in patients with HNSCC are significantly lower compared with their healthy counterparts23 24 which was confirmed in our patient population via flow cytometry. Figure 1 shows a representative scatterplot of the cytokine-producing CD56brightCD16– and cytotoxic CD56dimCD16+ NK cell subpopulations in a healthy control sample (A) and patients with HNSCC (B). There are fewer NK cell populations in patients with HNSCC (n=8) compared with healthy controls (n=5) for CD56brightCD16– (p<0.002), CD56dimCD16+ (p<0.05), and NKT CD56+CD3+ cells (p<0.05) (figure 1C). Given that impaired NK cell activity is associated with tumor progression22 we evaluated IFN-γ secretion as a measure of NK cell activation. NK cells were negatively selected from cryopreserved PBMCs and primed overnight with low dose IL-2. Isolated NK cells were then activated with 1 ng IL-12 and 10 ng IL-18 for 24 hours to induce IFN-γ release and measured by ELISA (figure 1D–F). Overall, baseline IFN-γ production was higher in healthy controls (n=4) compared with patients with HNSCC (n=4) (p=0.005). On activation, HNSCC NK cells increase IFN-γ production significantly, but not to healthy donor levels (figure 1F). Altogether, these data support previous observations of decrease in circulating NK cell populations and decreased functional capacity in patients with solid tumors.
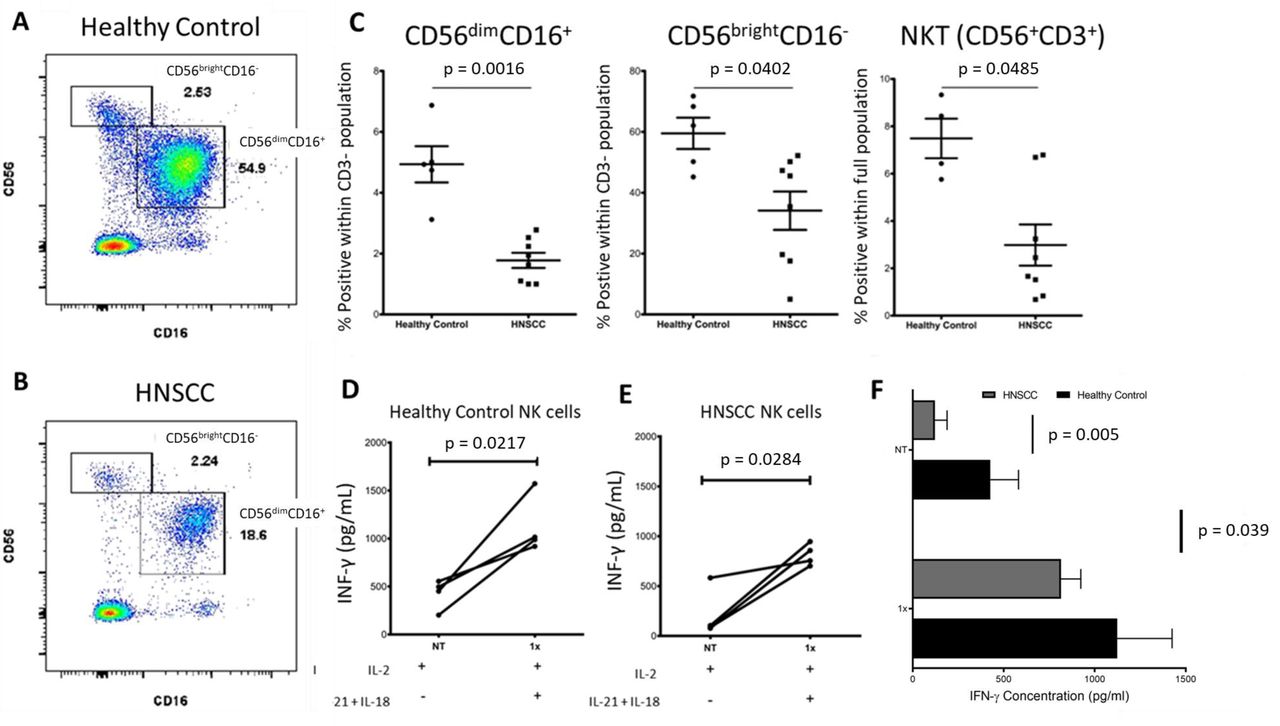 Figure 1
 Reduced NK cell populations and impaired IFN-γ production in peripheral blood of patients with locally advanced HNSCC. (A) Scatterplot representation of CD56+ NK cell populations in healthy control versus. (B) Patient with HNSCC. (C) Dot plots indicating per cent of CD56brightCD16–, CD56dimCD16+, and NKT cells for healthy controls versus patients with HNSCC. n=5 for controls, n=8 for patients with HNSCC (all human papilloma virus negative with advanced stage but heterogenous site of disease). (D) IFN-γ production of NK cells isolated from healthy controls primed with low dose IL-2, and activated with IL-12+IL-18. (E) IFN-γ production of NK cells isolated from patients with HNSCC primed with low dose IL-2, and activated with IL-12+IL-18. (F) Summary data of (C) and (D). Patients were heterogenous using two sites and three stages of HNSCC. Data in (C) were analyzed by an unpaired t-test with Welch’s correction; data in (D), (E), and (F) were analyzed by a paired Student’s t-test and two-way analysis of variance. HNSCC, head and neck are squamous cell carcinoma; IFN, interferon; IL, interleukin; NK, natural killer; NKT natural killer T cells.
Metformin treatment increases peripheral NK cells and subsequent expression of the NKG2D activation receptor in patients with LAHNSCCWe next evaluated whether patients’ NK cell phenotypes shifted after treatment with metformin. Using patient samples from a clinical trial (NCT02325401), 14 days of metformin treatment resulted in a relative but not significant increase in cytokine-producing CD56brightCD16– (figure 2A left, p=0.130) and cytotoxic CD56dimCD16+ (figure 2A right, p=0.0971) NK cells. However, only one of eight patients had a marked increase in CD56brightCD16–, while six of eight had an increase in CD56dimCD16+. Seven of eight patients experienced an increase in the ratio of per cent positive CD56dimCD16+:CD56brightCD16– cells (figure 2B), suggesting more functionally mature and cytotoxic NK cells in the periphery. Consistent with previous findings,25 NKT cells (figure 2C) in peripheral blood of patients with cancer are considerably lower compared with healthy control samples (p<0.05). After exposure to metformin, the absolute number of NKT cells increased in patients with HNSCC (p<0.05). Although IL-2 levels were similar, we observed a trend of higher levels of tumor necrosis factor (TNF) produced by NK cells but decreased IL-4 in the serum of healthy controls compared with patients with HNSCC which was rescued by metformin treatment (online supplemental figure 1). Consistent with previously published reports,13 we also detected a shift in T-cell memory phenotypes in human PBMCs after metformin treatment (online supplemental figure 2). CD8+ T cells in patients that received metformin had fewer cells expressing TN phenotypical markers and more cells expressing TEM phenotypes for which the exact mechanism is unknown (online supplemental figure 3).
 Figure 2
 Metformin treatment increases NK cell populations and increases expression of NKG2D in patients with locally advanced HNSCC. (A) Per cent positive for CD56brightCD16– and CD56dimCD16+ NK cell populations from patients with HNSCC before versus after metformin treatment. (B) Ratio of CD56dim/CD56bright NK cell populations in patients with HNSCC before versus after metformin treatment. (C) Per cent positive for CD56+CD3+ NKT cells from healthy controls and patients with HNSCC before and after metformin treatment. Horizontal black bars represent mean±SEM. (D) Per cent expression of NKG2D gated on CD56+CD3– NK cells from healthy controls and patients with HNSCC before and after metformin treatment. (E) Representative flow cytometry histograms showing NKG2D expression in CD56brightCD16– and CD56dimCD16+ NK cell populations from patients with HNSCC before versus after metformin treatment. (F) Mean fluorescence intensity of NKG2D measured in CD56brightCD16– (red) and CD56dimCD16+ (blue) NK cell populations from patients with HNSCC. n=5 for healthy controls, n=8 for patients with HNSCCs. Statistical significance indicated by p value. Data in (A) and (F) were analyzed by a paired Student’s t-test; data in (C) and (D) were analyzed by two-way analysis of variance (p=0.010 for (C) and p=0.05 for (D)). HNSCC, head and neck are squamous cell carcinoma; NK, natural killer.
To determine immune cell activation on metformin treatment, we analyzed expression of the activating receptor NKG2D (killer cell lectin like receptor K1 (KLRK1), CD314), which is necessary for cancer cell recognition and effector function, on NK cells and other cytotoxic lymphocytes.26 27 Healthy controls have a higher number of CD56+CD3– NK cells (figure 2D) that are NKG2D+ compared to patients with HNSCC (44.8% vs 25.85%, p<0.01). After metformin treatment, NKG2D expression is partially restored in patients with HNSCC to 35.89%. Figure 2F demonstrates increased surface expression of NKG2D (mean fluorescence intensity) on both CD56brightCD16– (p<0.025) and CD56dimCD16+ (p<0.02) NK cells in patients with HNSCC after metformin treatment.
Metformin treatment results in increased NK cell infiltration within the tumor, release of perforin, and cytotoxicityWe next examined if an increase in NK cell activation in the peripheral blood correlated with NK cell tumor infiltration. In an HNSCC surgical window of opportunity trial conducted by Curry et al, patient pretreatment (before) biopsy and post-metformin treatment surgically resected tissue (after) was collected.16 28 Patients received 500 mg of metformin daily for 3 days, and then 1000 mg daily up until day of surgery for at least 9 days. Tumor slides were stained with the tumor marker PCK, T-cell marker CD3, and NK cell marker NKp46 (figure 3A) and analyzed by immunofluorescence. Consistent with earlier results, CD3 tumor infiltration was increased in response to metformin treatment.16 28 However, NKp46+ cells were also significantly increased in post-treatment tissue confirming that metformin results in NK cell recruitment to tumor sites as well. Figure 3B represents quantification of total (left) and infiltrating (right) NK cells.
 Figure 3
 Metformin increases infiltration, perforin production, and cytotoxicity of HNSCC NK cells. (A) Immunofluorescence images of HNSCC tumor biopsy before treatment and resection after metformin treatment. Red=pan-cytokeratin, pink=NKG2D, orange=CD3, and blue=DAPI nuclear stain. (B) Quantification of total and infiltrating NK cells within the stained tumor tissue. Patients sourced from Amin et al. (C) Bulk cytokine analysis by IsoLight 24 hours after treatment with vehicle or 12 mM metformin treatment. (D) Cytotoxicity of HNC NK cells co-cultured with target cells treated with 12 mM metformin for 24 hours. Target cells included the established cell lines, CAL-27 which are HPV–, and UMSCC47 which are HPV+, and primary cells are derived from matched HNC tumor tissue from patients. Peripheral NK cells are derived from blood while infiltrating NK cells are derived from tumor-infiltrating lymphocytes. (E) Cytotoxicity of HNC cells compared with healthy donor (NML). (B), (C) and (D) were analyzed by paired student’s t-test. (E) was analyzed by two-way analysis of variance. HNC, head and neck cancers; HNSCC, head and neck are squamous cell carcinoma; HPV, human papilloma virus; IFN, interferon; IL, interleukin; NK, natural killer.
To determine how metformin alters cytokine secretion of NK cells, we isolated NK cells from PBMCs collected from newly diagnosed patients with HNSCC prior to any anticancer treatment and subjected them to 12 mM metformin or vehicle. The cells were analyzed on an IsoLight machine (IsoPlexis, Baltimore) for 24 hours to evaluate single cell multiplex cytokine secretion. Metformin treatment significantly increased the cytotoxic molecule perforin (p=0.00009) (figure 3C). Inflammatory cytokines MIP1-α (p=0.04), and IL-9 (p=0.02) were significantly reduced, while IL-8, IL-10, and IL-6 trended towards a decrease in response to metformin (p=0.3, 0.1, 0.1, respectively) (figure 3C). IL-6, IL-8, IL-9 and IL-10 increase STAT3 phosphorylation, and are considered tumorigenic in the TME.26
To elucidate whether metformin-induced perforin release was associated with enhanced NK cell cytotoxic function, we used a flow cytometry-based NKCA to determine HNSCC tumor cell killing by patient with HNSCC-derived NK cells. Given HPV+ compared with to HPV– tumors are more responsive to various treatments and both HPV+ and HPV– patients were included on the clinical trials, it was important to assess metformin-mediated cytotoxicity in both HPV+ and HPV– established cell lines. Patient with HNSCC-derived NK cells were treated with metformin and then co-cultured with HPV+ or HPV– cell lines in a 5:1 effector to target ratio. Metformin treatment results in a significant increase in HNSCC NK cell cytotoxicity in both HPV+ and HPV– cell lines (UMSCC47 and CAL-27, respectively) (figure 3D). To investigate whether peripheral and tumor-infiltrating NK cells had similar activity, we examined NK cells derived from TILs co-cultured with the same cell lines. HPV– primary and established HNSCC cell lines were killed more effectively by NK cells derived from TILs treated with metformin, compared with HPV+ cells (figure 3D). Given NK cells had been derived from primarily HPV– patients, we also performed NKCAs with NK cells and primary tumor cells from the same patient. Metformin also increased both peripheral and tumor-infiltrating NK cell cytotoxicity against autologous HNSCC primary cells derived from the same patient. Metformin did not significantly increase normal healthy donor NK cell cytotoxicity (figure 3E left two bars). However, normal healthy donor NK cell cytotoxicity is higher at baseline and metformin rescues HNSCC NK cell-mediated cytotoxicity to near normal donor levels (figure 3E).
Metformin increases NK cellular cytotoxicity through CXCL1 inhibitionTo better understand the direct effects of metformin on NK cells, NK cells were isolated from PBMCs, treated with vehicle or metformin, and analyzed by RNA-seq. CXCL1 expression was most significantly decreased in response to metformin, however many inflammatory pathways were also altered by metformin (figure 4A). Metformin-mediated CXCL1 inhibition of NK cells was confirmed by ELISA (figure 4B). To determine if CXCL1 regulation is important for NK-mediated cytotoxicity on metformin treatment, we treated isolated NK cells with vehicle, metformin, CXCL1, or combination. CXCL1 treatment indeed inhibited metformin-enhanced NK cytotoxic effects and could be reversed by a CXCR2 inhibitor, the receptor for CXCL1 (figure 4C). Perforin production was also decreased in response to CXCL1 in NK cells (figure 4D). CXCL1 alone did not significantly further reduce activity from vehicle baseline, but this may be due to already suppressed cytotoxicity activity in patient with HNSCC NK cells compared with healthy patient NK cells (figure 3E).
 Figure 4
 Metformin reduces CXCL1, activates pSTAT1, and inhibits pSTAT3. (A) RNA sequencing heat map of patient NK cells treated with vehicle or 12 mM metformin for 24 hours resulted in four most significantly downregulated and three most significantly upregulated genes (p value<0.0001 and fold change >1.5). Red indicates upregulated genes while blue indicates downregulated. (B) CXCL1 expression by ELISA in supernatant of HNC peripheral NK cells treated with vehicle or 12 mM metformin for 24 hours. (C) Cytotoxicity assay of HNC peripheral NK cells treated with 12 mM metformin, 50 ng CXCL1, or 10 µM CXCR2 inhibitor navarixin for 24 hours and subsequently co-cultured with CAL-27 target cells at 5:1 ratio. (D) Perforin in supernatant of experiment (C) analyzed by ELISA. (E) Western blot analysis of NK92 cells treated with 12 mM metformin, 50 ng CXCL1, or 10 µM CXCR2 inhibitor navarixin for 24 hours and probed for STAT1, STAT3, and actin. (F) Quantification of blot (E) using ImageJ. (B), (C), and (D) were analyzed by matched one-way analysis of variance. HNC, head and neck cancers; NK, natural killer.
Metformin-mediated NK cell cytotoxicity is pSTAT1 dependentWe next investigated potential downstream mediators of NK cytotoxicity on CXCL1 downregulation. TGF-β, which is known to be upregulated by CXCL1, and its downstream target IFN-γ secretion were not significantly affected by metformin or exogenous CXCL1 treatment at 24 hours (online supplemental figure 3). Therefore, we investigated pSTAT3, which is known to downregulate NK cell functions, and pSTAT1, which has been shown to increase perforin production in response to IFN-γ.29 Western blot analysis and subsequent quantification indicated that metformin increases pSTAT1 and decreases pSTAT3, but cannot overcome pSTAT3 activation by CXCL1 (figure 4E,F). To determine if pSTAT1 was necessary for metformin-mediated induction of NK cell cytotoxicity and perforin release, we treated NK cells with metformin, pSTAT1 inhibitor fludarabine, or CXCL1 and analyzed by NKCA and ELISA. pSTAT1 inhibition reversed metformin-mediated NK cell cytotoxicity similar to the addition of exogenous CXCL1 and perforin was also significantly reduced (figure 5A,B).
 Figure 5
 Metformin-mediated NK cellular cytotoxicity is AMPK independent, pSTAT1 dependent. (A) NKCA of peripheral HNC NK cells treated with 12 mM metformin, 50 ng CXCL1, or 10 µM pSTAT1 inhibitor for 24 hours against target cells CAL27 at target to effector ratio 1:5. (B) Perforin ELISA of supernatant from (A). (C) NKCA of peripheral HNC NK cells treated with 12 mM metformin, 50 ng CXCL1, 10 µM pSTAT3 inhibitor, or 10 µM pSTAT1 inhibitor for 24 hours against target cells CAL27 at target to effector ratio 1:5. (D) Perforin ELISA of supernatant from (C). (E) NKCA of peripheral HNC NK cells treated with 12 mM metformin or 10 µM AMPK inhibitor for 24 hours against target cells CAL27 at target to effector ratio 1:5.(F) Perforin ELISA of supernatant from (E). (G) NKCA of peripheral HNC NK cells treated with 12 mM metformin, 10 µM mTOR activator, or 10 µM mTOR inhibitor for 24 hours against target cells CAL27 at target to effector ratio 1:5. (H) Perforin ELISA of supernatant from (G). All figures analyzed by matched one-way analysis of variance. AMPK, AMP-activated protein kinase; HNC, head and neck cancers; mTOR, mechanistic target of rapamycin; NKCA, natural killer cytotoxicity assay; NK, natural killer.
To determine if inhibition of pSTAT3 by metformin is also important for NK-mediated cytotoxicity and if pSTAT3 inhibition could reverse the inhibitory effect of exogenous CXCL1, we treated NK cells with metformin, pSTAT3 inhibitor BP-1–102, or CXCL1. While pSTAT3 inhibition did increase cytotoxicity alone, and partially reversed the inhibitory effect of CXCL1, the cytotoxicity did not increase to the same level as metformin treatment alone (figure 5C). While metformin perforin release was inhibited by exogenous CXCL1, it was rescued by adding pSTAT3 inhibitor to CXCL1 and metformin suggesting pSTAT3 inhibition is important for perforin release (figure 5D).
Metformin-mediated NK cell cytotoxicity is AMPK independent and mTOR dependentMetformin is a known AMPK activator as well as a direct mTOR and pSTAT3 inhibitor in some cell types.30 31 To determine if metformin-mediated NK cell cytotoxicity was dependent on AMPK activation, we treated NK cells with metformin or an AMPK inhibitor alone or in combination. The addition of an AMPK inhibitor did not impact metformin-mediated NK cell cytotoxicity or perforin production, indicating metformin activates NK cells independent of AMPK (figure 5E,F). Given cellular cytotoxicity was independent of AMPK and that mTOR is a known inhibitor of pSTAT1, we next examined whether metformin-mediated mTOR inhibition was important for NK cell-mediated cytotoxicity. We treated NK cells with metformin, an mTOR activator, or an mTOR inhibitor. mTOR inhibition resulted in enhanced NK cell cytotoxicity and mTOR activation reversed metformin-mediated NK cell cytotoxicity (figure 5G). However, mTOR activation did not block perforin release suggesting that although cellular cytotoxicity was mTOR inhibition dependent, perforin release was likely controlled through additional mechanisms (figure 5H).32
DiscussionThe clinical trial cited in this paper explored metformin as a potential therapeutic in HNSCC, and here we found that NK cells are significant contributors to immune-oncologic activity. NK cells were more dramatically impacted than T cells outside of T(EM) cells, therefore we chose to further explore NK cell activation by metformin. Restoration of NK cell function is an emerging interest in cancer immunotherapy.33 34 Patients with HNSCC often have impaired tumor immune surveillance,35 highlighted by increased quantities of regulatory T cells in the TME and impaired functions of T cells, NK cells, and NKT cells. NK cells play a pivotal role in the antitumor innate immune response requiring strong stimulatory signaling by means of activating receptors that recognize stress-induced ligands on the surface of target cells. Immunotherapies designed to increase NK cell functionality have had mixed results, including an antibody to target the killer immunoglobulin-like receptor.36 Here, we report that patients with HNSCC have lower circulating subpopulations of NK cells with reduced functional capacity and expression of NKG2D receptors, which can be partially restored by metformin treatment. Importantly, circulating NK and NKT cells were reduced in our cohort of patients with HNSCC. These NK cells exhibited reduced IFN-γ secretion, indicative of suppressed functionality. While insufficient NK cell activity in cancer is thought to be modulated by immunosuppressive mediators such as activation of certain STAT pathways, the correct balance of pathway activation has not yet been elucidated.26 ,37 What is clear, is that a reduction in NK cells is an indicator of poor survival in patients with advanced stage HNSCC, and future therapeutics should target NK cells both directly and indirectly by impacting cytokine and chemokine balance.21
Metformin has been observed to be directly toxic to tumor cells mostly through AMPK activation and mTOR inhibition, but few studies have evaluated the antitumorigenic immune response to metformin in solid tumors in patients from clinical trials.5 In our study, although there is no overall difference in white blood cell count or absolute lymphocyte count after metformin treatment, there was a larger population of TEM cells after metformin treatment. Metformin also partially restored circulating NK and NKT cell populations with increasing expression of NKG2D back to levels seen in healthy controls. Analysis of the cytokine profiles of patient serum suggested activated antitumor activity, highlighted by increasing IL-2 and TNF (online supplemental figure 1). Additionally, IL-4 was decreased, which normally promotes tumor development by activating nuclear factor kappa-light-chain-enhancer of activated B cells (NF-κB)33 and favoring TH2 cells (online supplemental figure 1). However, given the paucity of patient samples and that most patients did well on clinical trial NCT02325401 (1-year overall survival and progression-free survival were 90%)21 (See online supplemental table 1) and survival data are not yet available for NCT02083692 (See online supplemental table 2), we were unable to elaborate on whether metformin-induced effects are correlated with improved survival in this study.
Metformin activates AMPK which in turn reduces mTOR, a pathway upregulated and targeted in cancer cells but important to maturation and function of immune cells.5 Metformin has also been identified as a direct inhibitor of mTOR and pSTAT3. pSTAT3 upregulation is a negative prognosis factor in many solid tumors, and negatively regulates NK cell functions.9 26 38 A recent publication indicated that mTORC1 inhibition by everolimus decreases NK cell maturation in peripheral NK cells in breast cancer.39 The impact on tumor-infiltrating cells was not explored and they found that despite lower maturation, NK cells had increased cytotoxic activity when mTOR is inhibited. Here, we also show in an ex vivo setting, metformin can rescue cytokine release and cytotoxicity of suppressed PBMCs and tumor-infiltrating NK cells and that metformin-mediated NK cellular cytotoxicity is dependent on mTOR inhibition but independent of AMPK (figure 5).
RNA-seq analysis of patient with metformin-treated HNSCC-derived NK cells revealed potential alterations of pathways outside of AMPK (figure 4). Interestingly, metformin-mediated significant downregulation of CXCL1, which is normally activated by pSTAT3 as well as NF-κB and mTOR, in NK cells.29 CXCL1 is a neutrophil recruiting chemokine that has been implicated as a negative prognosis factor in many cancers7 and is highly expressed by CD56dim NK cells.8 CXCL1 may recruit NK cells to a tumor site, but continued exposure results in increased pSTAT3 and NF-κB, which can ultimately lead to exhaustion of NK cells.8 40 As expected, metformin treatment inhibited pSTAT3
留言 (0)