
記住我

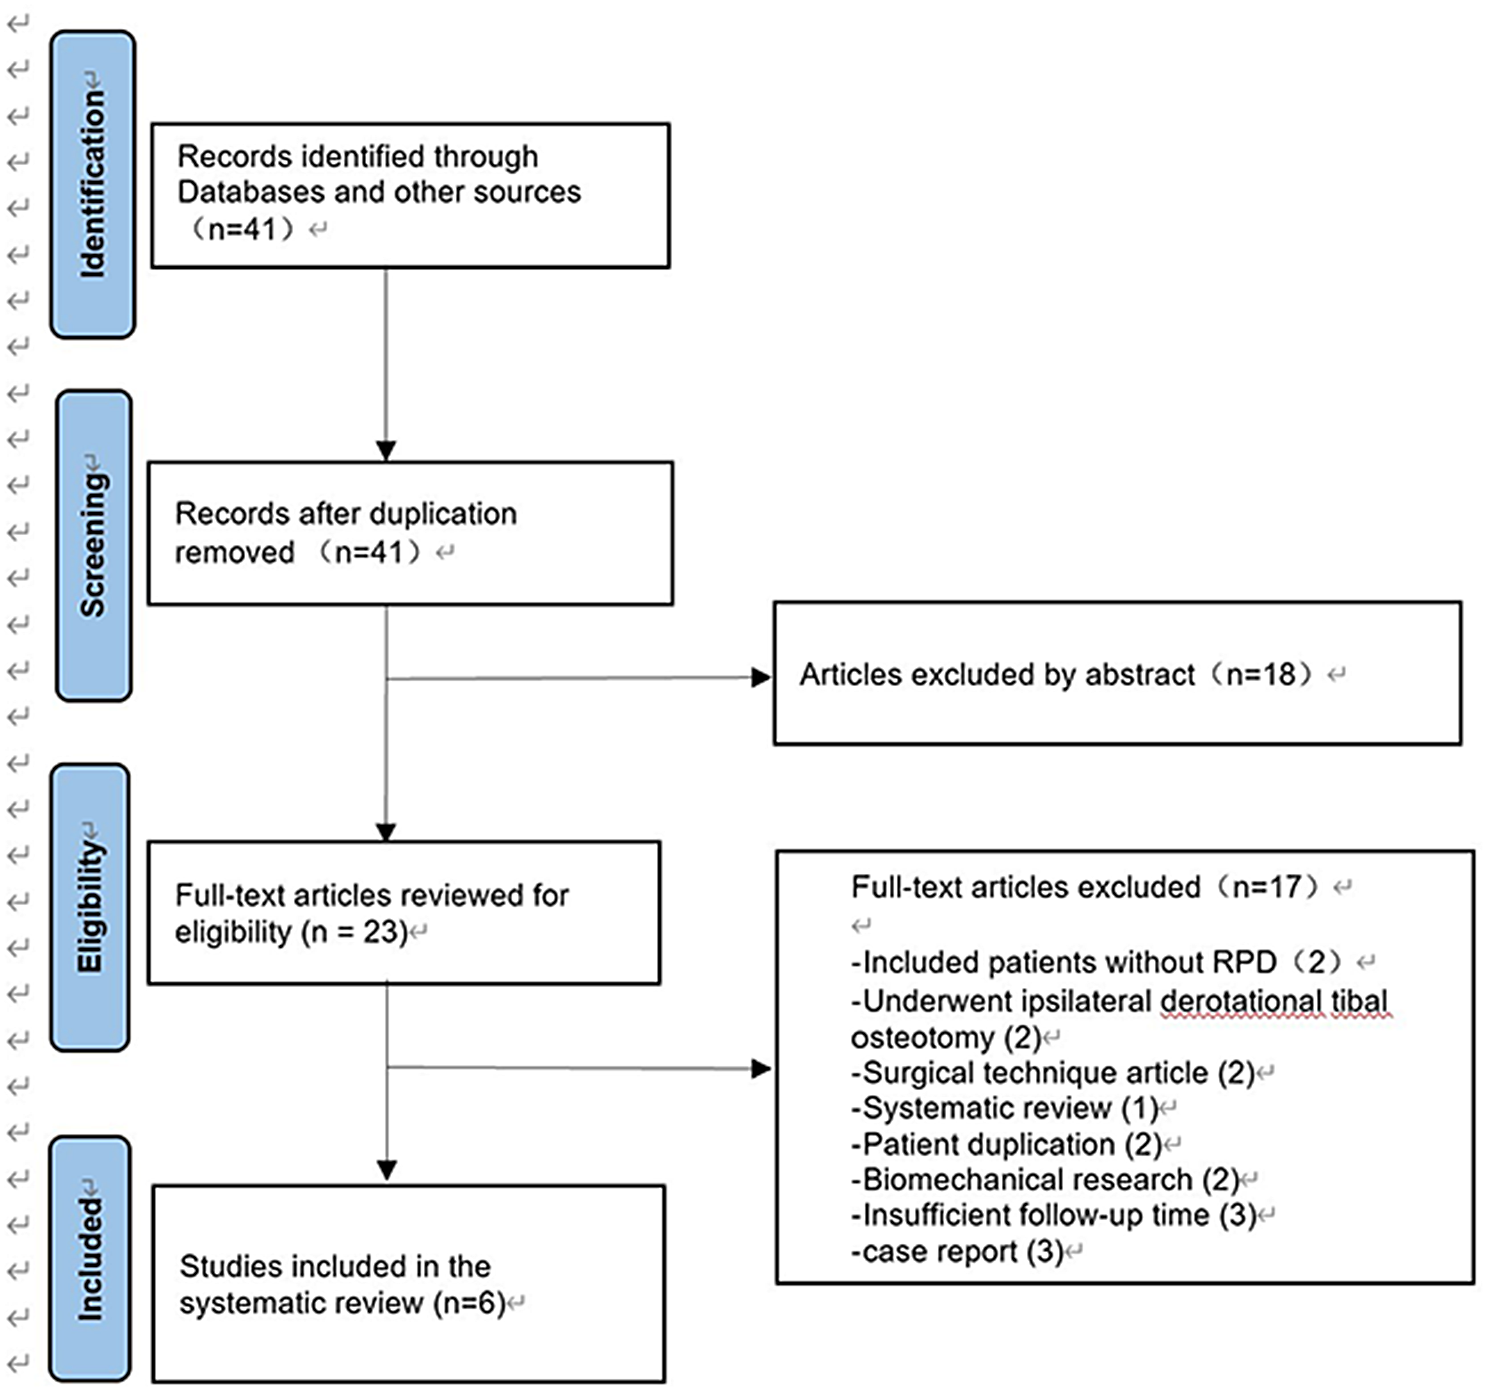

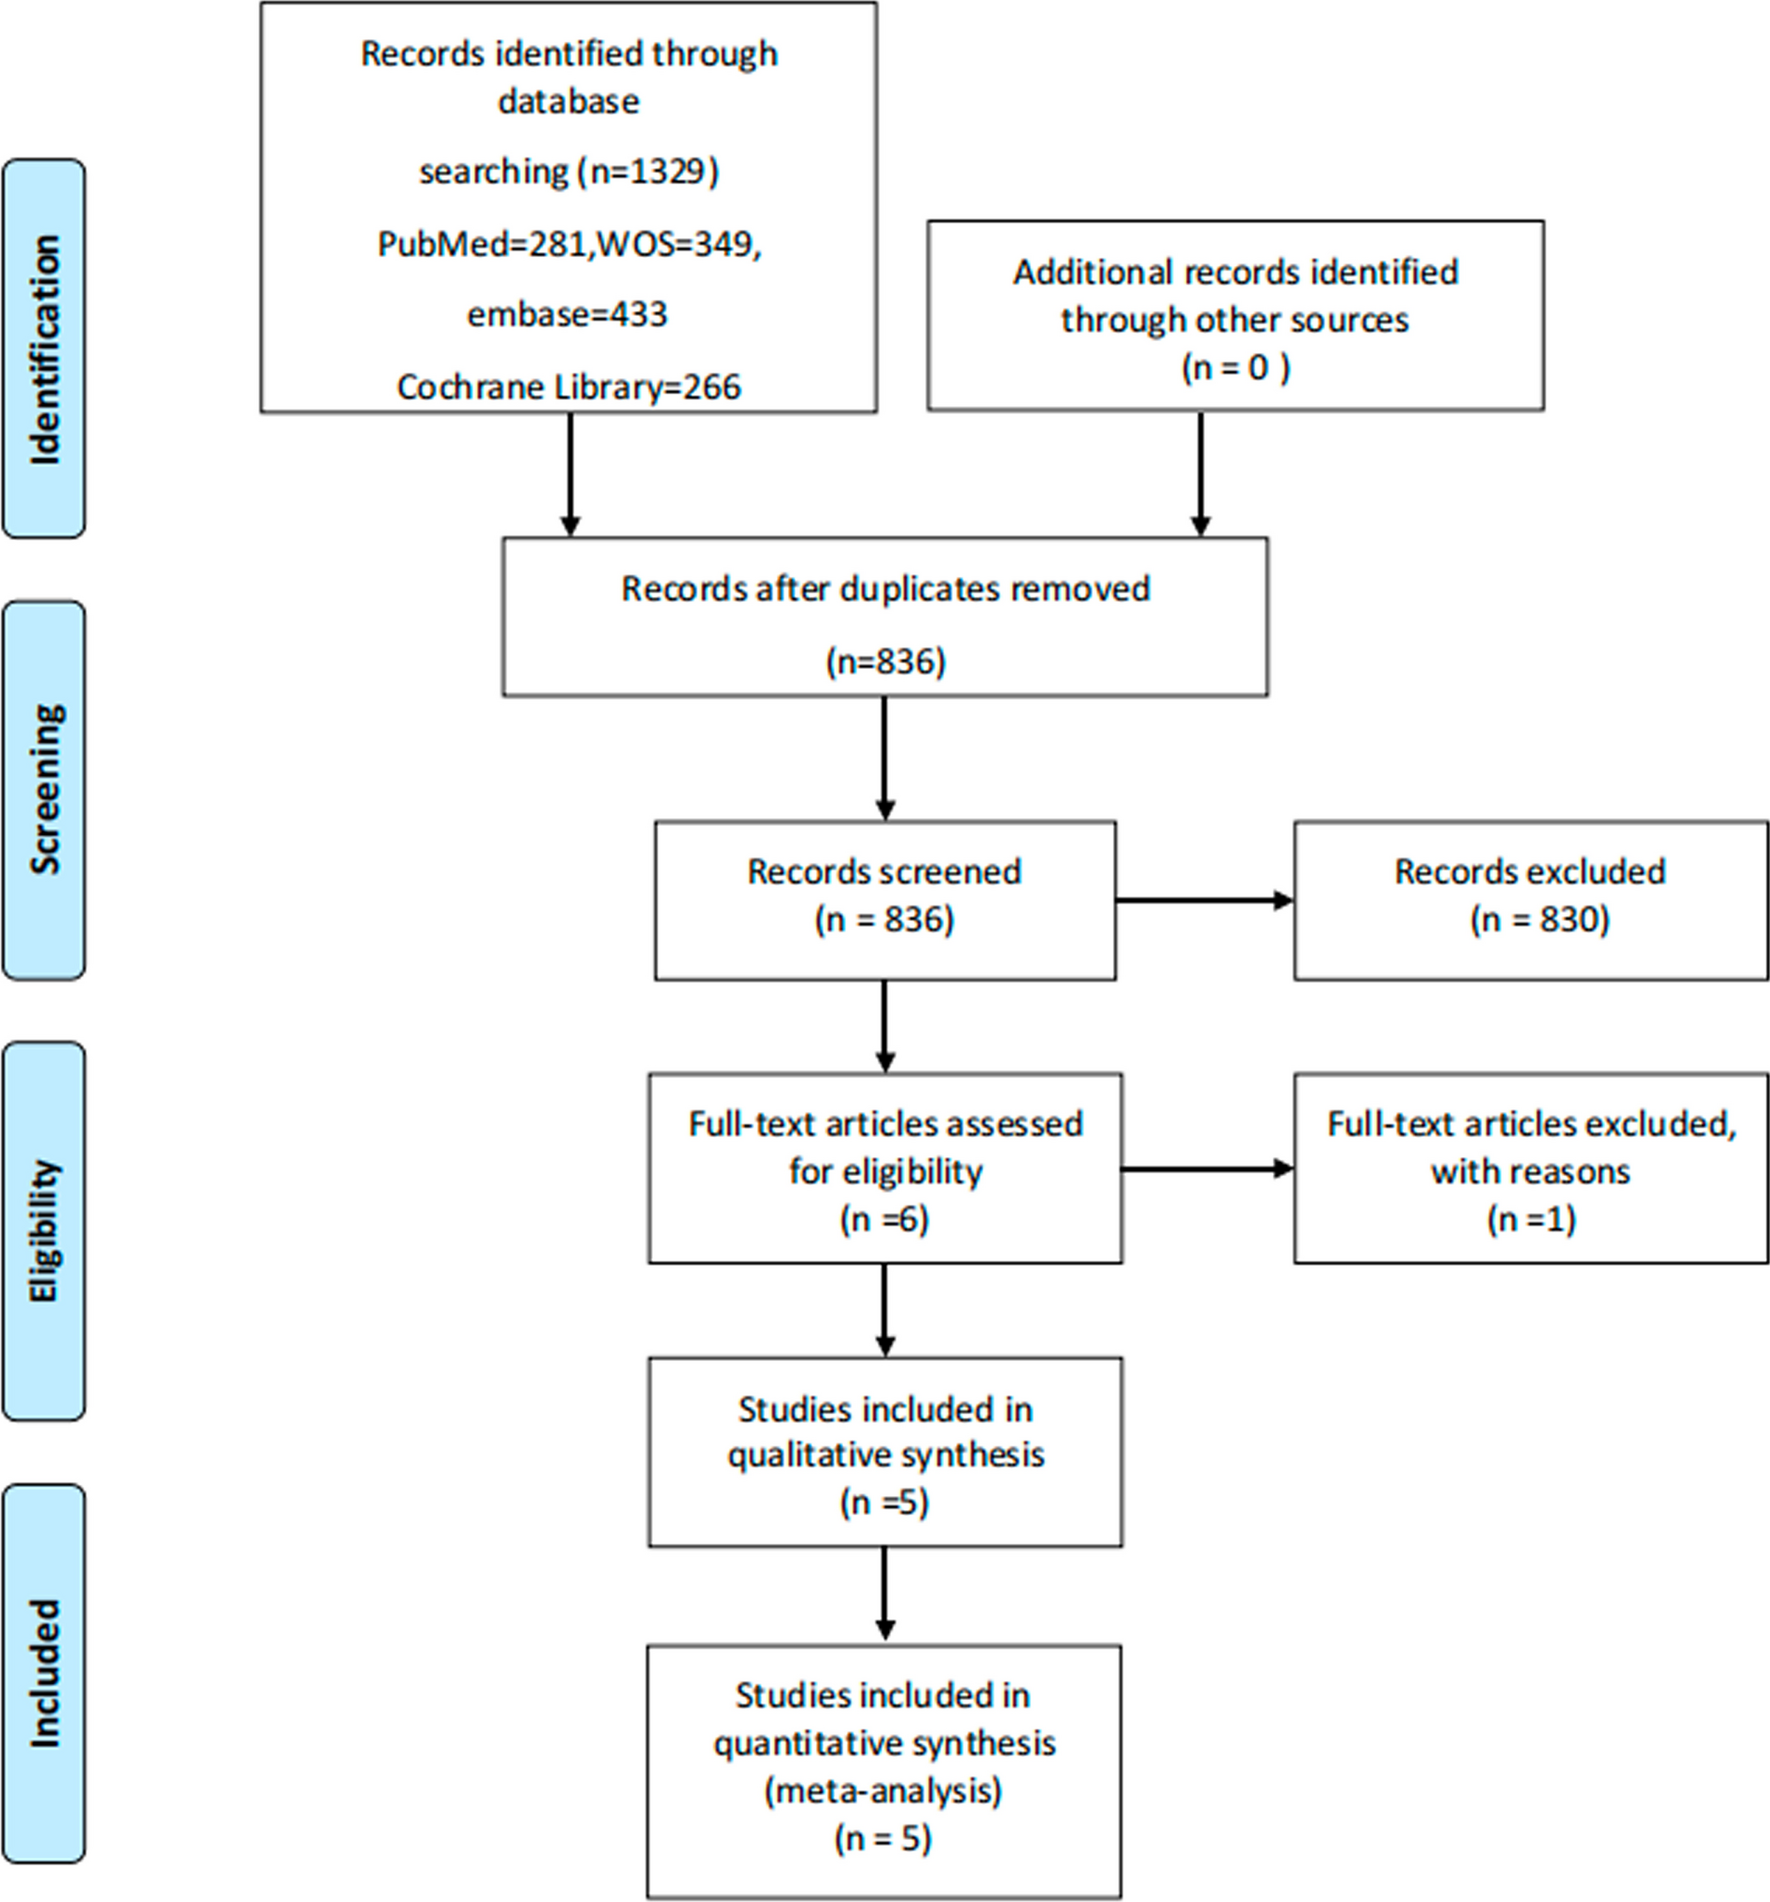
Based on the established search strategy, 22,292 articles were collected. After the duplicate check, 1756 articles were retained. We meticulously implemented the inclusion and exclusion criteria after reviewing the titles and abstracts. Finally, seven articles were collected after thoroughly reading the full articles [9, 12,13,14,15,16,17]. The screening steps are displayed in Fig. 1.
Fig. 1
Flowchart of literature screening
Basic characteristics of the included literatureThis meta-analysis included seven studies with 222,490 patients. Of all the included studies, four articles provided age [12, 14, 16, 17], two articles provided ASA [9, 12], six articles provided diabetes [9, 12,13,14,15, 17], four articles provided hypertension [9, 13, 15, 17], three articles provided chronic heart diseases [9, 13, 15], five articles provided chronic lung diseases [9, 12, 13, 15, 17], three articles provided income [13, 15, 16], and four articles provided payments for hospitalization [13, 15,16,17]. The characteristics of the included literature are presented in Table 1.
Table 1 Basic characteristics of included studiesEvaluation of the quality of the studiesSeven RCSs were included into our analysis [9, 12,13,14,15,16,17]. The evaluation method turns to the NOS scores. The results of the evaluation are exhibited in Table 2.
Meta-analysisFour articles provided age data [12, 14, 16, 17]. Meta-analysis presented that the heterogeneity between included studies was high (I2 = 64%). Sensitivity analysis was conducted, and after one article was removed, the heterogeneity from the included studies was significantly diminished (I2 = 48%). FEM was used, and significant difference was found in the age between the readmission and no readmission groups (MD = − 4.60, 95%CI − 4.89–4.31, p < 0.00001), and the details are presented in Fig. 2.
Fig. 2
Two articles submitted ASA data [9, 12]. Subgroup analysis demonstrated that the heterogeneity between included studies was obvious (I2 = 77%). We used a random effects model (REM), and no difference was found in the ASA between the readmission and no readmission groups (OR = 0.92, 95%CI 0.51–1.67, p = 0.78), and the details are exhibited in Fig. 3.
Fig. 3
Six articles offered diabetes data [9, 12,13,14,15, 17]. Meta-analysis presented that the heterogeneity between included studies was evident (I2 = 83%). We performed a sensitivity analysis. After one article was deleted, the heterogeneity was significantly lowered (I2 = 39%). FEM was used, and the results presented significant difference in the diabetes between the readmission and no readmission groups (OR = 0.60, 95%CI 0.56–0.64, p < 0.00001), see Fig. 4 for details.
Fig. 4
The forest plot of diabetes
Four articles provided hypertension data [9, 13, 15, 17]. Meta-analysis demonstrated that the heterogeneity between studies was obvious (I2 = 99%). Sensitivity analysis was performed, and after two articles were removed, the heterogeneity from the included studies was diminished (I2 = 0%). FEM was used, and significant difference was found in the hypertension between the no readmission and readmission groups (OR = 0.40, 95%CI 0.30–0.54, p < 0.00001), and the details are presented in Fig. 5.
Fig. 5
The forest plot of hypertension
Three articles provided chronic heart diseases data [9, 13, 15]. Meta-analysis indicated that the heterogeneity between studies was evident (I2 = 99%). We performed a sensitivity analysis. The heterogeneity between the two groups cannot be reduced or eliminated. We used a REM, and the results presented significant difference in the chronic heart diseases between the two groups (OR = 0.05, 95%CI 0.01–0.19, p < 0.00001), and the details are exhibited in Fig. 6.
Fig. 6
The forest plot of chronic heart diseases
Five articles submitted chronic lung diseases data [9, 12, 13, 15, 17]. Meta-analysis demonstrated that the heterogeneity between studies was high (I2 = 92%). Sensitivity analysis was performed, and after three articles were deleted, the heterogeneity between the groups can be significantly eliminated. We used a REM, and the results displayed significant difference in the chronic lung diseases between the groups (OR = 0.46, 95%CI 0.43–0.49, p < 0.00001), and the details are exhibited in Fig. 7.
Fig. 7
The forest plot of chronic lung diseases
Three articles offered income data [13, 15, 16]. Subgroup analysis displayed that the heterogeneity between the studies was high (I2 = 100%). REM was used, and significant difference was found in the income between the two groups (OR = 2.85, 95%CI 1.82–4.46, p < 0.00001), and the details are shown in Fig. 8.
Fig. 8
The forest plot of income
Four articles provided payments for hospitalization data [13, 15,16,17]. Subgroup analysis displayed that the heterogeneity between included studies was obvious (I2 = 100%). We used a REM, and significant difference was found in the payments for hospitalization between the groups (OR = 2.29, 95%CI 1.14–4.59, p = 0.02), and the details are exhibited in Fig. 9.
Fig. 9
The forest plot of payments for hospitalization
留言 (0)