
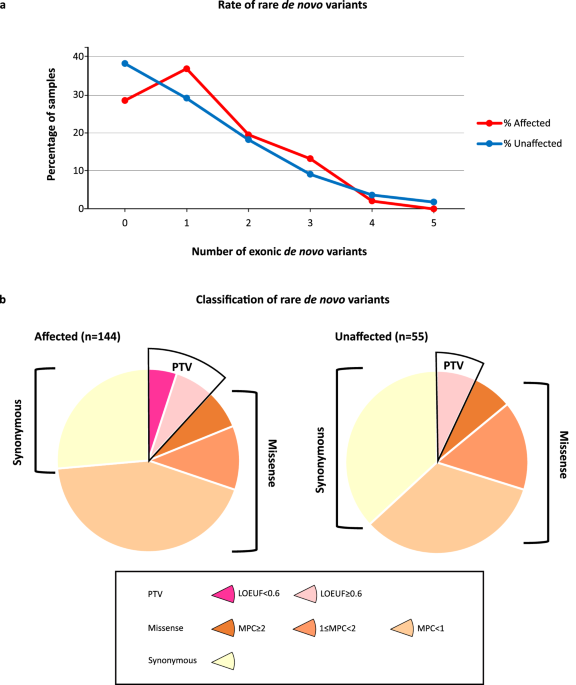
記住我
Fifty-nine targeted loci were successfully captured with a mean coverage depth of 24.7 for all 22 patients. Figure 1a shows an example of successful capture at the RFC1 locus. Median depth of coverage across all 59 targeted loci was generally homogenous except for NOTCH2NLC, which might be due to its location in a segmentally duplicated region or its paralogous genes, such as NOTCH2NLA, NOTCH2NLB, and NOTCH2NLR (Supplementary Fig. 1). For detailed evaluation, we plotted the coverage depth of a single run on respective chromosomes for two patients: Patient 8 who had relatively high depth and Patient 5 who had less depth. Relatively homogenous coverage was replicated for on-target reads in these samples. Off-target reads were generally scarce across all chromosomes, although several off-target loci were commonly observed in two patients with relatively high coverage depth (Fig. 1b). Manual inspection revealed that most of these off-target regions did not encompass coding genes, but were located within repetitive regions or at the centromere (data not shown). Even with several highly covered off-targets, targeted regions seemed very accurately enriched overall because the average per-locus coverage depth for on-targets (46.86× for Patient 8 and 12.97× for Patient 5) was roughly 1000 times larger than that for off-targets (0.041× for Patient 8 and 0.0087× for Patient 5) among all selected reads (Fig. 1c).
Fig. 1: Successful capture of targeted regions with relatively homogeneous coverage.
a The integrative genomics viewer (IGV) depicting the entire RFC1 region successfully captured by adaptive sampling, as an example of successful target enrichment in Patient 9. b Coverage plots for Patient 8 (left) and Patient 5 (right). Upper, middle, and lower panels show coverage plots across whole chromosomes of all reads, on-target reads, and off-target reads, respectively. c All per-locus coverage of “on-target” and coverage per every 5000 bp of “off-target” reads by adaptive sampling were plotted for Patients 8 and 5. The average coverage depths for on- and off-targets are presented in the graph.
Repeat expansions precisely identified in the validation studyAll pathogenic repeat expansions irrespective of repeat unit sequence and length were detected in 12 positive controls (Patients 1–12, Table 1, and Fig. 2) and were ranked first in 10 and second in 2 patients by our prioritization workflow (Fig. 3). For validation and discovery studies, loci ranked for possible pathogenicity in each patient are presented in Supplementary Tables 1 and 2, respectively. For patients whose pathogenic locus was ranked second, polymorphic TNRC6A repeat expansion in Patient 3 and heterozygous RFC1 repeat expansion in Patient 4 were ranked as #1. For Patient 3, a TNRC6A repeat expansion was judged as a polymorphism by examining the consensus sequence constructed from our workflow (Supplementary Fig. 2). For Patient 4, an RFC1 repeat expansion was heterozygous; therefore, this patient was considered a carrier by calculating the number of repeat units in the two respective alleles using tandem-genotypes (Supplementary Table 1).
Table 1 Comparison of conventional methods with targeted nanopore sequencing and adaptive sampling.Fig. 2: Pathogenic repeat expansions identified in all positive control samples.
Histograms of tandem-genotypes output and waterfall plots for all positive controls in the validation study are shown. For the histograms, the X-axis indicates copy number change compared with the number of repeat units in the reference human genome: 21 for HTT, 10 for ATXN3, 13 for CACNA1A, 20 for DMPK, 15 for ATXN8OS, 13 for NOTCH2NLC, 20 for PHOX2B, 20 for SAMD12, 11 for RFC1, 13 for BEAN1, 4 for NOP56, and 3 for CSTB. The waterfall plot was generated using either hac mode (Patients 1, 2, 3, 7, 8, 9) or sup mode (Patients 4, 5, 6, 10, 11, 12).
Fig. 3: Diagnostic flowchart for human repeat expansion diseases using the GridION sequencer.
The flowchart for library preparation, sequencing, data analysis, data evaluation, and additional analysis (in an ad hoc manner) is shown along with the estimated time required for each step.
Single targeted long-read sequencing (T-LRS) analysis provided comprehensive results, including whole repeat sequence and expanded repeat length/number of repeat units with its distribution, while conventional methods only provided some of this information for one repeat locus, such as specific repeat unit sequence (RP-PCR), expanded repeat length (southern blotting) or the number of repeat units (fragment length analysis), or only implied that the locus was disease-causing without any detailed data (flanking PCR). Furthermore, the nucleotide-level resolution of T-LRS provided precise information on any interrupting sequences near disease-causing repeats, which can act as disease modifiers or markers. In Patient 1, expanded CAG repeats ended with (CAACAG)1, indicating that this patient will follow the average disease course and severity. Gain or loss of CAACAG sequence influences the age of onset and severity22, which can be a prognostic marker. In Patient 2, CGG, which is associated with intergenerational instability, was confirmed in the mutant allele. In Patient 4, CTA-ATG sequence was inserted at the 5′ end of an expanded repeat. This sequence remained after sequences were basecalled again with super accuracy (sup) mode. Various interrupting sequences, such as CCG, CGG, CAG, and CTC, in the DMPK repeat expansion at the 3′ end and more rarely at the 5′ end have been reported with an estimated frequency of 3–5%, and were associated with a milder phenotype23. The CTA-ATG sequence found in this patient is a previously unreported interrupting sequence with undetermined clinical significance, although we could not exclude the possibility of sequencing error. In Patient 5, pathogenic CTG expansions were observed in both alleles, indicating that this patient had biallelic expansion. The waterfall plot of this patient showed the sequence content of the entire repeat, including a benign CTA repeat, and a disease-causing CTG repeat. The entire repeat sequence content is difficult to clarify using conventional methods, and its pathogenicity was determined based on the total repeat length, which did not exclude the large benign CTA repeat expansion from the pathogenic one. Our T-LRS overcomes this difficulty. In Patient 6, the normal allele had a GGA interruption, which may reduce GGC repeat instability24. In Patient 7, the waterfall plot clearly showed not only repeat length abnormality, but also the detailed sequence content of GCX, where X is A/T/G/C. In Patient 9, homozygous AAGGG repeat expansion was detected. In Patient 10, pathogenic TGGAA, polymorphic TAAAA (common to all ethnic groups), and TAGAA (common in Japanese) repeat unit sequences were all confirmed (Fig. 2).
For Patients 4 and 6 and Individual 1, methylation analysis was performed. Patient 4 was diagnosed with an adult-onset, mild form of myotonic dystrophy having relatively short repeat expansion (approximately 100 repeats). Based on the recent paper reporting that abnormal methylation is mostly observed in the congenital form of myotonic dystrophy, and that patients with larger expanded alleles are more likely to show abnormal methylation25, expanded repeat in this patient may not be hypermethylated. Patient 6 is diagnosed with neuronal intranuclear inclusion disease (NIID); therefore the expanded repeat is expected to be unmethylated. Individual 1 is an unaffected father with an extremely long and hypermethylated repeat expansion in NOTCH2NLC24. As expected, the pathogenic repeat expansions in Patients 4 and 6 were not methylated, while an extremely long repeat expansion in asymptomatic Individual 1 was hypermethylated (Supplementary Fig. 3).
Repeat expansions identified in previously undiagnosed patientsWe tested whether we could detect disease-causing repeat expansions in molecularly undiagnosed patients using our method. We examined 10 such patients who had been clinically diagnosed with spinocerebellar ataxia (SCA) (n = 8) or cerebellar ataxia, neuropathy, vestibular areflexia syndrome (CANVAS) (n = 2). Two groups of researchers, who were blind to the results of the respective methods, were assigned to analyze all 10 patients by conventional methods or T-LRS. Both the conventional methods and T-LRS diagnosed 6 out of the 10 patients. Results were different between the conventional methods and T-LRS in two patients (Patients 13 and 17 as described below). For both, the conventional method diagnosis was revised and the T-LRS results were found to be correct (Table 1 and Fig. 4). The results were matched in the remaining patients.
Fig. 4: Examples of four samples for three loci in the discovery study.
For a–c, the conventional study results are shown on the left and the results of our diagnostic method using GridION are shown on the right. Posi positive control, Nega negative control, NTC no template control, RP-PCR repeat-primed PCR. a Upper left panel shows the flanking PCR result for the CACNA1A locus. Patient 13 and six other patients (1–6) were tested using a 2% agarose gel and only the patient labeled “2” was judged as positive. Upper right panel shows T-LRS results detecting CACNA1A as the rank #1 locus. Lower right panel shows the confirmatory flanking PCR and fragment analysis of the CACNA1A locus. Flanking PCR was evaluated on a 2.5% agarose gel. b Left panel shows flanking PCRs result for the ATXN8OS/ATXN8 locus. Right panel shows the T-LRS result detecting ATXN8OS/ATXN8 as the rank #1 locus but with ambiguous pathogenicity. The rank #2 locus was also rejected for pathogenicity. c Left panel shows an abnormally expanded PCR amplicon in BEAN1, RP-PCR detecting a pathogenic TGGAA repeat, and Sanger sequencing for an SCA31-linked SNP in which one of the patients (Patient 14) did not have this SNP. Right panel shows the T-LRS result detecting the rank #1 locus as BEAN1 and SCA31-linked SNP genotyping shown in the integrative genomics viewer. The result was matched between the two methods, but multiple experiments were needed with the conventional method.
Case studiesPatient 13CAG expansion in CACNA1A, ranging from 20 to 32 repeats, causes SCA626. The normal repeat unit limit of 18 is close to the abnormal threshold of 20 repeat units; therefore, it may be difficult to diagnose a patient with SCA6 by a conventional method, such as flanking PCR.
For the conventional approach, flanking PCRs targeting 11 different cerebellar ataxia-associated loci were performed (Fig. 5). The first screen was judged negative; therefore, this patient was diagnosed as having no pathogenic repeat expansion. T-LRS was called the rank #1 locus as CACNA1A linked to SCA6, which was compatible with the patient’s phenotype. According to the data evaluation flow, this locus was judged as disease-causing because 1) an abnormal number of repeat units was detected (21 repeat units), 2) it is known to follow autosomal-dominant inheritance, and 3) it is known to have no benign sequence expansion. To confirm this, we performed flanking PCR of the CACNA1A locus again, and carefully checked the size of the PCR amplicon by gel electrophoresis, separating the slightly larger allele from the normal allele of the upper limit size. Fragment analysis confirmed 21 CAG repeat units (Fig. 4a). Retrospectively, this case could be diagnosed with flanking PCR with careful examination, or with fragment analysis without prior screening by flanking PCR. However, this could only be achieved with stringent care or special expertise for repeat expansion diseases and this case showed the clear advantage of T-LRS when detecting small changes in repeat numbers that can be otherwise missed by conventional methods with low resolution.
Fig. 5: Our conventional screening workflow for known repeat expansion diseases manifesting cerebellar ataxia.
Square brackets indicate procedures that can be omitted for diagnosis. From this screening workflow, we excluded SCA10, SCA37, and Friedreich ataxia because of their rarity, and SCA36 because of their regional distribution in Japan. DRPLA dentatorubral-pallidoluysian atrophy, CANVAS cerebellar ataxia, neuropathy, vestibular areflexia syndrome.
Patient 17The bidirectionally transcribed CTG·CAG repeat expansion in ATXN8OS/ATXN8, which leads to mRNA with an expanded CUG repeat and a polyglutamine protein27,28, causes SCA8. Reduced penetrance occurs in SCA8, and a possible modifier of its penetrance is repeat interruption by CCG·CGG29. Normal alleles usually have 15–50 repeats consisting of CTA-CTG·TAG-CAG (preceding polymorphic CTA and subsequent pathogenic CTG) while pathogenic alleles have 71–1300 repeats30.
A large amplicon was detected by SCA8-linked flanking PCR, indicating this patient to be SCA8. T-LRS called the rank #1 locus as ATXN8OS/ATXN8, although it was ambiguous for apparent pathogenicity because its expanded repeat unit number was intermediate (66 repeat units), with a relatively large portion of benign CTA repeat (19 repeat units) compared with previous data showing the number of CTA repeats to be 8–1527, and without CCG interruption. Altogether, this locus was excluded as disease-causing. The rank #2 locus, AXTN7 linked to SCA7, was also rejected for pathogenicity because the repeat expansion did not exceed the manifesting threshold; therefore, this patient had no pathogenic repeat expansion. After comparing the results from the two methods, our final diagnosis was “unlikely pathogenic with intermediate SCA8 repeat expansion”. We cannot completely exclude the possibility of SCA8 with intermediate expansion although repeat length and expanded repeat unit indicated a small chance of disease manifestation. This case showed the advantage of T-LRS when both the number of repeat units and the repeat sequence are important for judging pathogenicity (Fig. 4b).
Patients 14 and 16SCA31 is relatively common in Japan. A 2.5–3.8-kb-long pentanucleotide repeat expansion consisting of (TGGAA)exp, (TAGAA)exp, (TAAAA)exp, or (TAAAATAGAA)exp in the intronic region of BEAN1 and TK2 is found in patients; however, only TGGAA is linked to disease31,32. There is also a very strongly disease-associated single-nucleotide polymorphism (SNP) in the 5′-untranslated region of PLEKHG432,33, and positive flanking PCR and disease-associated SNPs may confirm SCA31 diagnosis.
SCA31-linked flanking PCR detected a large amplicon, and RP-PCR detected a TGGAA repeat in Patients 14 and 16. Sanger sequencing confirmed that Patient 14 was negative and Patient 16 was positive for the SCA31-linked SNP. T-LRS called BEAN1, linked to SCA31 as the rank #1 locus for both patients, which was judged as pathogenic because abnormal numbers of repeat units were detected (repeat length was 2756 and 2915 bp corresponding to approximately 551 and 583 repeats for Patients 14 and 16, respectively), and the TGGAA sequence (249 and 269 repeats for Patients 14 and 16, respectively) was confirmed in the consensus repeat sequence in both. The SCA31-linked SNP was also targeted; therefore, genotyping information was obtained for both patients by checking the SNP in the integrative genomics viewer without additional experimentation. T-LRS may be advantageous when conventional methods require multiple tests for diagnosis. Additionally, Patient 14 showed that SCA31-linked SNP genotyping cannot be used to exclude a diagnosis of SCA31 (Fig. 4c).
Sequence accuracyIn nanopore sequencing, sequencing accuracy depends on the library preparation kit version used, the Guppy_basecaller version used, and its basecalling model. We used kit 109 and performed basecalling using Guppy v4.3.4, v5.0.11, or v5.1.13 with the basecalling model in high accuracy (hac) mode. According to Oxford Nanopore, raw read accuracy is approximately 95% for Guppy v4.3.4 in hac mode, and 97.8% for Guppy v.5.0.11 or later in hac mode using kit 109 (https://nanoporetech.com/accuracy). When sequences were basecalled again using Guppy v6.0.6 in sup mode, raw read accuracy increased to 98.3%. We therefore performed basecalling again with sup mode for some patients whose waterfall plots had many “other” sequences within the repeat sequence because these were possibly error sequences and might be eliminated with sup mode basecalling. When the waterfall plots of consensus sequences generated in the hac mode were compared with those from the sup mode, the sup mode improved the sequencing accuracy and decreased “other” sequences (Supplementary Fig. 4a). For the AAGGG repeat expansion in RFC1, which causes CANVAS, sequences in Patient 19 were basecalled again with sup mode. However, this resulted in even more “other” sequences in the consensus sequence in a strand-specific manner. Manual inspection detected that most of the “other” sequences were AAGG repeat units (Supplementary Fig. 4b). We previously experienced a similar phenomenon with nanopore sequencing of a CANVAS patient with AAGGG repeat expansion34, so we sequenced this patient (Patient A) using high-fidelity long-read whole-genome sequencing (HiFi LR-WGS) using the PacBio Sequel II system (Pacific Biosciences, Menlo Park, CA, USA). The AAGG repeat observed in T-LRS was mostly absent by PacBio HiFi LR-WGS. Therefore, the “other” sequences in the waterfall plot of Patient 19 are likely to be sequencing/basecalling errors (Supplementary Fig. 4c). Patient 9, another CANVAS patient with AAGGG repeat expansion in RFC1, also showed a “noisy” waterfall plot pattern, similar to that of Patient 19, which may also be because of sequencing errors.
As another way to evaluate sequence accuracy, we correlated the repeat lengths determined by conventional methods and T-LRS using the data from Patients 1, 3, 7, 9, 13, 15, 18, and 19. Significant correlations were observed between repeat lengths determined by conventional methods and T-LRS (P < 0.0001, r2: 0.9822) (Supplementary Fig. 5 and Supplementary Table 3). When validating the correlation for relatively short repeat lengths (up to 150 bp) and large repeat lengths separately, small repeats (n = 9 alleles) showed significant correlation (P < 0.0001, r2: 0.9940), while large repeats (n = 5 alleles) did not reach a statistically significant correlation. This is reasonable because the longer the read, the greater the chance of errors. Alternatively, it may partially result from the limited number of samples used for evaluation. To address this, we increased the number of samples by adding data from previously reported samples34, and reanalyzed the data (n = 16 alleles). This confirmed that large repeats also reached significant correlation (P < 0.0001, r2: 0.9436).
Sensitivity and specificity of T-LRS as a diagnostic methodOur repeat detection workflow outputs a prioritized list of repeat loci in which the loci are displayed in order of importance (i.e., large change in the patient) by comparing them to those from our 27 unaffected controls. This list does not tell the examiner which locus is pathogenic but allows them to judge whether the respective repeat locus has pathogenic repeat expansion or not. If the examiner makes this judgment following the prioritized order from the rank #1 locus, they may easily and rapidly detect pathogenic repeat expansion because pathogenic repeat expansions are all nominated as either rank #1 or #2.
As a diagnostic tool, it is important to provide sensitivity and specificity. However, because this detection flow does not call any locus disease-causing, we could not calculate specificity or sensitivity. As shown in the prioritization list of the top 20 ranked loci for all patients in the validation study (Supplementary Table 1), disease-causing repeat expansion was found in the rank #1 locus in 83.3% (10/12) of the patients, and was found within rank #1 and #2 loci in 100% (12/12) of the patients. This can be a substitute for sensitivity in this detection workflow. No patient was detected in this study with multiple expanded repeats.
As for a substitute for specificity, we checked whether SCA loci other than “true” pathogenic repeat expansions in the six SCA patients (Patients 2, 3, 5, 9, 10, and 11) in the validation study were miscalled as pathogenic repeat expansions. In these patients, other expanded repeats were denied, except for one pathogenic expansion, prior to T-LRS. As shown in Supplementary Table 4, none of the patients had miscalled SCA repeat expansion loci, and only the true pathogenic locus was detected. Thus, the substitute of specificity was 100%.
Time-lag sampling reduces the cost of sequencingIn Japan, it currently costs a minimum of 804 USD to perform one GridION run on one flow cell with two nuclease flushes and all necessary reagents. Conversely, conventional methods cost approximately 6–26 USD depending on how many experiments are needed. To reduce the sequencing cost, we tried “time-lag” sampling to sequence two different samples on one GridION flow cell using nuclease flushes (Fig. 6), which reduced the cost by approximately half (452 USD/sample). We sequenced four patients with CANVAS. Samples 2, 3, and 4 were previously sequenced by HiFi LR-WGS34. Sample 1 was identical to Patient 9. Two samples were serially loaded onto the same flow cell as described in Fig. 6. Mean depth of coverage for the four samples was 15.0× (11.41–16.46×). For all samples, time-lag sampling accurately detected the pathogenic repeat locus (RFC1). The repeat unit sequence [(AAGGG)exp/(AAGGG)exp in samples 1 and 3, (ACAGG)exp/(ACAGG)exp in sample 2, and (AAGGG)exp /(ACAGG)exp in sample 4] and the repeat length were compatible and within 10% of previous results34 (Supplementary Table 5). Regarding the risk of carrying over the previous library to the next sampling, Oxford Nanopore Technologies state that the wash procedure should remove 99.9% of the library, implying that some residual DNA might remain on the flow cell [Nanopore protocol Flow Cell Wash Kit (EXP-WSH004), Version: WFC_9120_v1_revB_08Dec2020]. Assuming 0.1% of the previous library is carried over, approximately 0.015× (15 × 0.001) depth in time-lag sampling might be derived from the previous library. Practically, this can be ignored.
Fig. 6: Time-lag sampling.
We sequenced four patients with CANVAS, three of whom (Samples 2, 3, and 4) were previously sequenced by HiFi LR-WGS using the PacBio Sequel II system (Pacific Biosciences, Menlo Park, CA, USA)34. Sample 1 was identical to Patient 9. a Time-lag sampling of Sample 1 loading 45 fmol of library on day 1 and Sample 2 loading 55 fmol on day 2 on one GridION flow cell detected pathogenic repeat expansions in both samples. b Time-lag sampling of Sample 3 loading 55 fmol of library on day 1 and Sample 4 loading 55 fmol on day 2 and 15 fmol on day 3 on one GridION flow cell detected pathogenic repeat expansions in both samples. For Sample 4, all remaining library (15 fmol) was loaded again on day 3 because the sequencing output did not reach the satisfactory level at the end of day 2. c Time-lag sampling with Cas9-mediated PCR-free enrichment libraries of Samples 1 and 2. We sequenced Samples 1 and 2 for 7.5 and 24 h, respectively. For Sample 2, there was no AAGGG repeat expansion in its sequencing output, indicating no carryover DNA from Sample 1.
Theoretically, the more depth the sequence output has, the greater the likelihood that the output has carried-over reads from the previous sequencing. To experimentally determine the risk of carryover in our diagnostic system, we performed time-lag sampling with Cas9-mediated PCR-free enrichment of the RFC1 repeat locus to maximize the coverage depth using Samples 1 (repeat unit: AAGGG/AAGGG) and 2 (ACAGG/ACAGG) (Fig. 6). To maximize the depth of Sample 2, Samples 1 and 2 were sequenced for 7.5 and 24 h, respectively. The depths for Samples 1 and 2 were 163.76× and 403.02×, and there were 94 and 375 reads, respectively, which include the entire expanded repeat sequences. For Sample 2, there was no AAGGG repeat expansion in its sequencing output (Fig. 6c). Considering that our method with adaptive sampling would not have such depth, we conclude that we can use time-lag sampling with no practical concern for carrying over the previous sample.
留言 (0)