
記住我


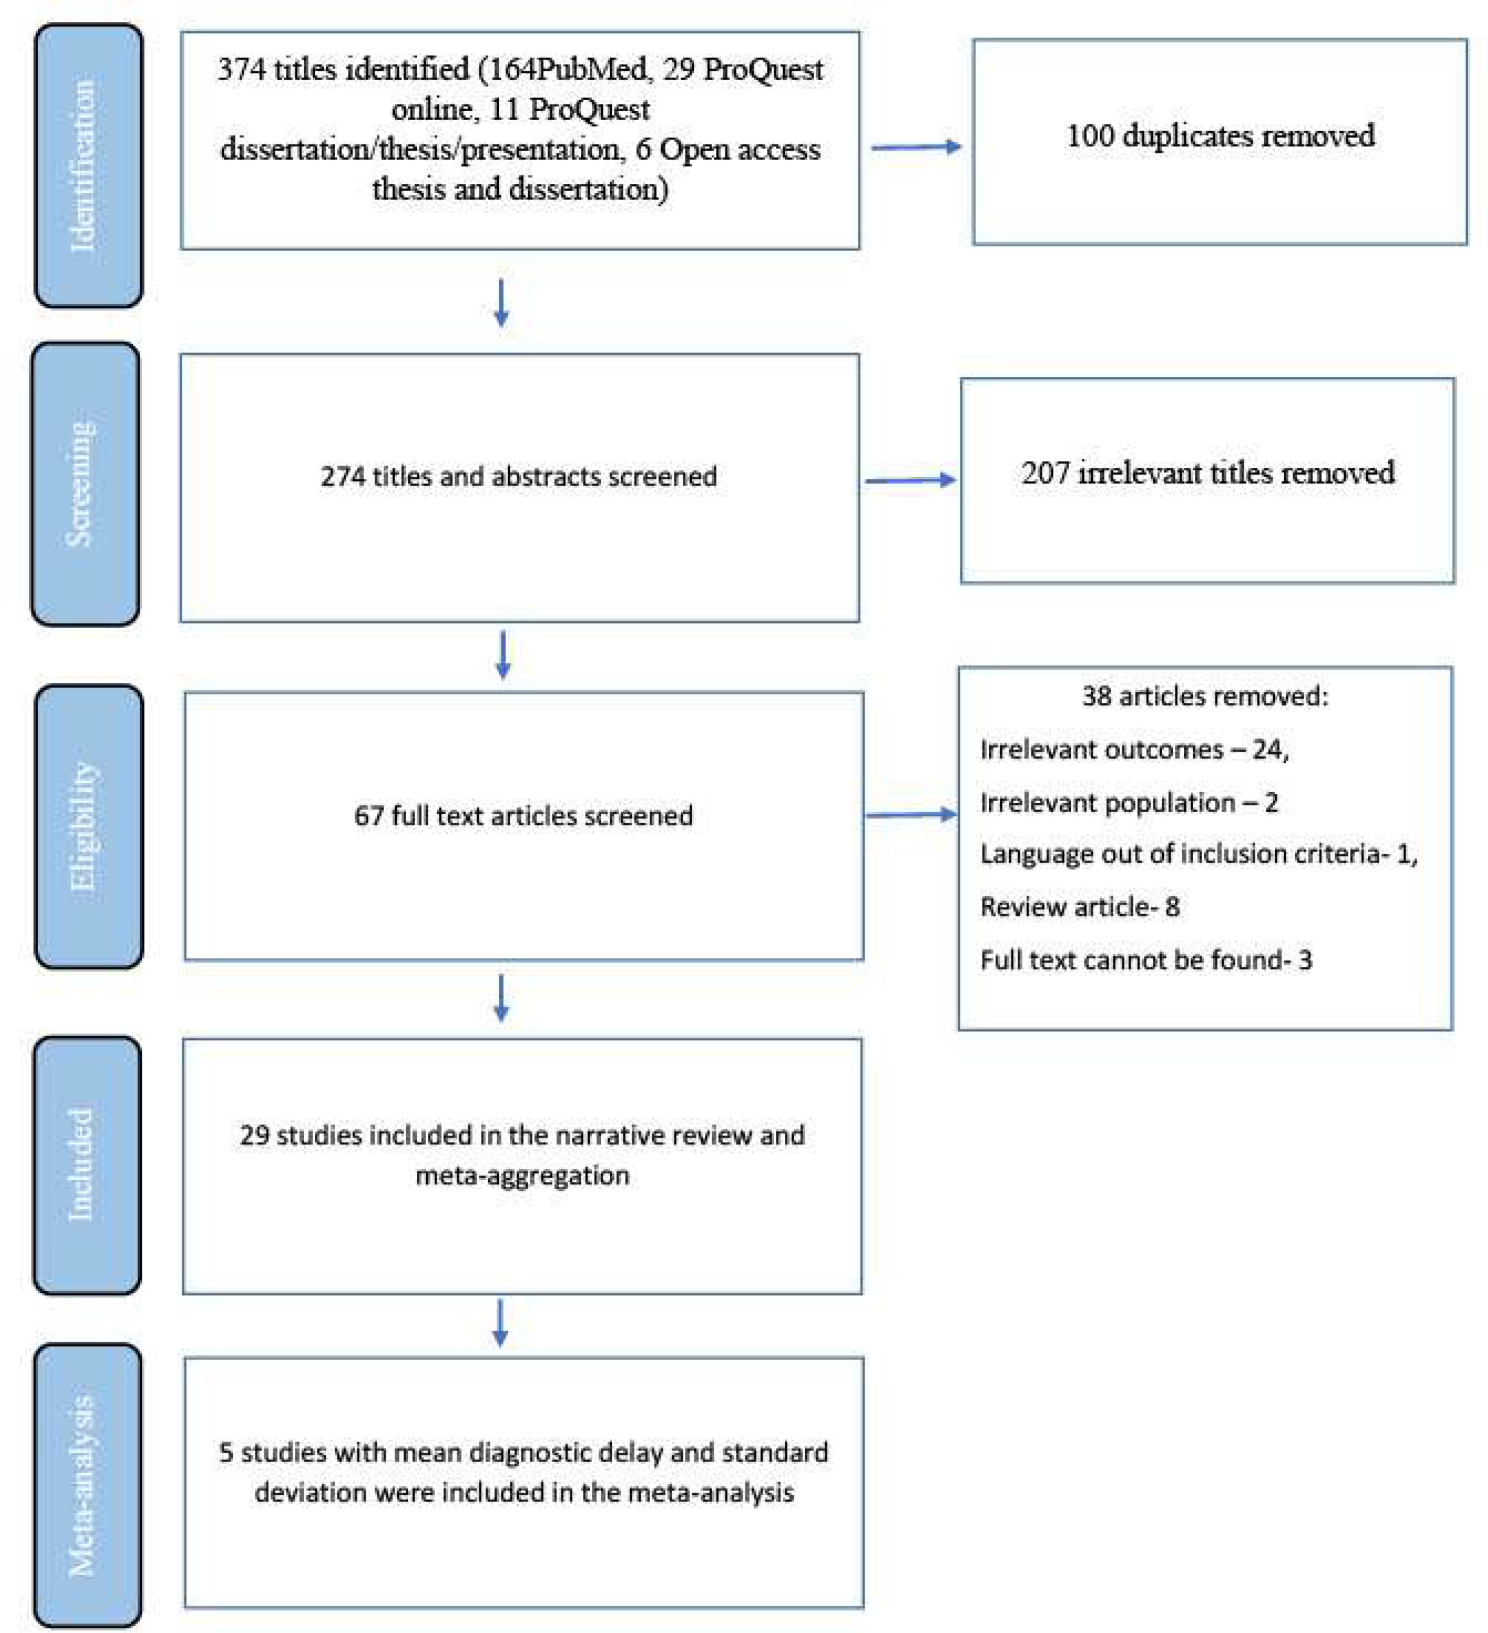

A total of 312 probands of congenital EL received panel-based NGS and medical evaluation in the Eye & ENT Hospital of Fudan University from January 2016 to Dec 2021 (Fig. 1 A). A novel missense variant c.205G > C (p.A69P) and a recurrent nonsense variant c.1200 C > G (p.Y400*) of the SUOX gene were identified in one proband (0.76%) (Fig. 1B). The mutations manifested autosomal recessive inheritance and co-segregated in a trans pattern (Fig. 1 C). The affected amino acids are conserved across vertebrates (Fig. 1 C). Both variants had rare allele frequency in different populations. The missense mutation c.205G > C (p.A69P) was predicted to be “deleterious” by SIFT and “possibly damaging” by PolyPhen-2. Therefore, according to ACMG guidelines, the SUOX mutation c.205G > C (p.A69P) was classified as “Likely pathogenic”, and c.1200 C > G (p.Y400*) was defined as “Pathogenic”. The biallelic mutations identified in our study were mapped to the protein diagram, together with all SUOX mutations reported so far (Fig. 1D). In brief, this patient harbored potentially pathogenic SUOX mutations and was suspected of having ISOD.
Fig. 1
Biallelic SUOX mutations identified in this study
(A) Brief overview of the enrollment process. One patient with congenital EL and biallelic SUOX mutations was identified
(B) Proportion of probands harboring biallelic SUOX mutations (marked by asterisks). Biallelic SUOX contributed to 0.76% of patients in the cohort and accounted for 3.45% of non-FBN1 mutations
(C) Genotype–phenotype co-segregation and protein conservation analysis. The pedigree diagram demonstrates that the identified SUOX mutations came from different alleles. The affected member is marked in black, and the proband is indicated by arrows. Sanger sequencing confirmed the compound heterozygosity. The affected amino acid, A69, is conserved in humans, chimpanzees, pigs, leopards, rats, and zebrafish, but not mice, while Y400 is shared by all of the above vertebrates
(D) SUOX protein diagram indicating the localization and effects of the existing mutations. The mutations identified in this study are marked in red
EL, ectopia lentis; NGS, next-generation sequencing
Clinical featuresThe medical history and clinical examination results were carefully reviewed. The patient was a boy aged 4 years and 2 months born to non-consanguineous Chinese parents. He was born with a normal weight (3700 g), and there were no remarkable events during the pregnancy. The family history was also unremarkable. The BCVA was 0.5 LogMAR with − 3.00 DS/−6.00 DC × 150° (OD) and 0.7 LogMAR with − 2.50 DS/−6.75 DC × 145° (OS). EL was diagnosed during regular ophthalmic examinations, and he was then referred to the Eye & ENT Hospital of Fudan University. The lens in the right eye was subluxated upward and that in the left eye was subluxated superior-temporally (Fig. 2 A). Anterior segment optical coherence tomography images showed sparsely scattered zonules at the margin of the dislocated lens in both eyes (Fig. 2B). Fundus photography revealed no evident anomalies (Fig. 2 C), and the macula structure was normal on fundus OCT examination (Fig. 2D). The patient had a short axial length and flattened cornea (Supplementary Figure S1A). Topography showed high and irregular corneal astigmatism on both sides (Supplementary Figures S1B and S1C). He was suspected of having potential Marfan syndrome until genetic tests revealed the presence of biallelic SUOX mutations.
Fig. 2
Ophthalmic and neurological examinations of the patient with biallelic SUOX mutations
(A) Slit-lamp microscope revealed superior dislocation of the lens in the right eye and superior-temporal dislocation in the left eye
(B) SS-ASOCT slides manifested dislocated lens and sparse zonules in the right (upper panel) and left eyes (lower panel)
(C) Fundus images showed grossly normal macula and optic nerves
(D) Fundus OCT images showed no anomalies in macula structure
(E) T1-weighted (left) and T2-weighted (right) brain MR images of the basal ganglia plane showed intact brain structures
(F) T1-weighted (left) and T2-weighted (right) brain MR images of the cerebellar plane showed no abnormalities
OCT, optical coherence tomography; SS-ASOCT, swept-source anterior segment optical coherence tomography; MR, magnetic resonance
The patient was suspected of having ISOD and was referred to the Department of Neurology of Huashan Hospital, Fudan University, for further assessment. On questioning the guardian into the patient’s medical history, it was declared that the patient had had a fever and had vomited milk 3 days after birth, and these symptoms were relieved after symptomatic treatment. During the first year of his life, he went through several more episodes of fever and vomiting. The post-natal yearly physical examinations revealed no evident delay in his motor or mental development, and no other neurological symptoms were noticed, except for an occasionally unsteady gait. On physical examination, he was of normal height, weight, and head circumference compared to children of the same age. He had no facial dysmorphism but had mild pectus carinatum. His neurological examination revealed no significant abnormalities, except for a slightly unsteady gait and brisk tendon reflex on both upper extremities. His MRI findings were normal at the initial visit (Fig. 2E F). His brain was symmetric, with an intact structure and no atrophy. No obvious increase in signal intensity was found in the bilateral cerebral cortex, globus pallidi, or substantia nigra on T1WI (Fig. 2E, left panel) or T2WI (Fig. 2E, right panel) images. The bilateral third ventricles and lateral ventricles were symmetrically distributed on both sides of the midline and were of normal size and morphology (Fig. 2E). In addition, although the patient presented with an occasionally unsteady gait, his cerebellum was devoid of structural impairment (Fig. 2 F).
ISOD is generally characterized by neonatal onset of therapy-resistant seizures, severe psychomotor retardation, and early death. In this case, the neurological symptoms were mild and atypical, hence targeted biochemical tests were applied to aid in the diagnosis. The related metabolic pathways are summarized in Supplementary Figure S2. A deficiency in sulfite oxidase leads to the accumulation of sulfites and their metabolites, such as taurine, thiosulfate, and S-sulfocysteine, in bypass pathways. An excessive formation of S-sulfocysteine decreases the level of cysteine and homocysteine. The patient showed increased urinary secretion of sulfite and S-sulfocysteine, accompanied with low levels of cysteine and homocysteine in the blood. The normal excretion of xanthine and hypoxanthine in the urine excluded MoCoD, as the lack of molybdenum cofactor would have resulted in a combined deficiency of SUOX and xanthine dehydrogenase (Supplementary Figure S2). Therefore, a diagnosis of ISOD was made according to the findings of the above biochemical tests, despite the patient’s minimal neurological anomalies.
Structural and functional relevanceA mild phenotype and relatively late-onset age are rarely seen in ISOD. Thus, our supposition was that the mutations identified in this study probably exerted fewer deleterious effects on the structure and function of the SUOX protein. To test this hypothesis, we built an in silico model of SUOX proteins and investigated the mutational effects of p.A69P and p.Y400*. The missense mutation c.205G > C resulted in an amino acid substitution from alanine to proline in the N-terminal of the SUOX protein. The c.1200 C > G nonsense mutation resulted in the substitution of tyrosine with a stop codon in the catalytic domain of the SUOX protein. Root mean square deviation (RMSD) simulation showed delayed equilibration at a higher RMSD for the two mutants, indicating more unstable fluctuations in the mutants than in the wild-type protein (Fig. 3A). From the residue-based root mean square deviation (RMSF) simulation shown in Fig. 3A’, the p.A69P mutant was observed to display a significantly higher RMSF around the mutated residue, indicating it had higher levels of flexibility than the wild-type. The plot of p.Y400* terminated at residue 400, consistent with its truncation effects. Both N-terminals of the mutants were less stable than that of the wild-type (Fig. 3 A’). The radius of gyration (RoG) plot indicated less compact conformation in p.A69P, while that of p.Y400* was tighter, probably as a result of the reduced size (Fig. 3 A’’). After the simulation, the optimized structures were aligned and compared (Fig. 3B-B’’’). More coil and fewer helix structures (arrows) were found in the p.A69P mutant, which explained the increased flexibility and decreased compaction observed in the molecular dynamics simulations. Sulfite (SO32−) was then docked with the established models (Fig. 3 C-C’’), and the p.Y400* mutant showed decreased affinity (− 2.7 kcal/mol) compared with the wild-type (− 3.6 kcal/mol). The binding energy was unaltered in the p.A69P mutant (− 3.6 kcal/mol), even though the binding residues were changed (Fig. 3 C’). Overall, in silico modeling revealed the unstable structure of the p.A69P mutant and the decreased binding capability of the p.Y400* mutant.
Fig. 3
Structure–function prediction of SUOX protein and its mutants
(A) RMSD plot for the backbone of SUOX wild-type (in violet), p.A69P (in pink), and p.Y400* (in grey) for 30 ns of simulation. Conformation of wild-type protein equilibrated at a level of 6.0 Å after 5 ns and the two mutants equilibrated after 10 ns at higher RMSD. The larger RMSD and later equilibration of the mutants indicate a more unstable structure than that of the wild-type proteins
(A’) RMSF graphs for the backbone of SUOX wild-type (in violet), p.A69P (in pink), and p.Y400* (in grey) during the simulation. Both mutants manifested higher levels of flexibility, especially at the N-terminal, than the wild-type. The p.A69P mutant displayed significantly higher RMSF around the mutated residue, indicating more movement than in the wild-type (arrowhead). Plot of p.Y400* terminated at residue 400, consistent with its truncation effects
(A’’) RoG plot for the backbone of SUOX wild-type (in violet), p.A69P (in pink), and p.Y400* (in grey) over 30 ns of simulation. The higher RoG indicated more loose conformation in p.A69P, while the p.Y400* is more compact, probably as a result of the reduced size
(B-B’’’) Conformation alignment (B) of the wild-type (B’, in violet), p.A69P (B’’, in pink), and p.Y400* (B’’’, in grey) after molecular dynamics simulation. More coil and fewer helix structures (arrows) were found in the two mutants
(C-C’’) Molecular docking of the wild-type (C, in violet), p.A69P (C’, in pink), and p.Y400* (C’’, in grey) with sulfite (SO32− ) after molecular dynamics simulation. Wild-type SUOX binds sulfite with Arg366 and Arg217 through a hydrogen bond and salt bridge. p.A69P interacts with additional Phe215. The interaction sites changed to Arg 192, Ser190, Val142, and Phe215 in p.Y400*
RMSD, root mean square deviation; RMSF, residue-based root mean square deviation; RoG, radius of gyration
Mutation spectrum and genotype–phenotype correlationsIt is likely that the missense mutation p.A69P can explain the atypical phenotypes observed in the patient; thus, we wondered if missense mutations of SUOX generally contribute to less severe ISOD. To test this hypothesis, we reviewed the genotypic and phenotypic features of SUOX mutation carriers described in the existing literature. A total of 32 different mutations were identified from 35 pedigrees in this study and previous reports (Supplementary Table S3), and the phenotypic spectrum and biochemical tests are summarized in Supplementary Tables S4 and S5. Homozygotes accounted for 62.86% of mutations. The most common mutation effect was missense (43/70, 61.43%), followed by nonsense (14/70, 20.00%) and frameshift (13/70, 18.57%), and the most frequent SUOX mutation was c.1200 C > G (p.Y400*) (9/70, 12.86%). About 60% of the pedigrees had at least one unique mutation that had no analogs in the literature. Thus, studying the genotype–phenotype correlations of SUOX mutations should be helpful in prognostication.
In the genotype–phenotype analysis, patients were categorized into three groups for further analysis: nonsense/frameshift and nonsense/frameshift (NF + NF) (10, 28.57%), nonsense/frameshift and missense (M + NF) (7, 20.00%), and missense and missense (M + M) (18, 51.43%). The mix of genders (Fisher’s exact test, P = 0.338) of the patients was similar among the groups. In total, nearly three-quarters of patients showed a typical clinical ISOD course (26/35, 74.29%), while the others had milder manifestations. Patients with mild ISOD had a higher proportion of M + M mutations (8/9, 88.89%) than M + NF (1/9, 11.11%) or NF + NF mutations (0/9, 0.00%) (Fisher’s exact test, P = 0.023) (Fig. 4 A). All patients with NF + NF mutations were typical ISOD cases. The median age at onset was 0.50 months (95%Cl 0.00-1.22). Patients in the M + M group manifested the syndrome at an older age, and the age differences were significant among groups (LogRank test, P < 0.001) (Fig. 4B). EL was identified in 7 out of 18 patients (38.89%), the diagnostic age of which varied from 2 months to 8 years old. However, the genotype–phenotype correlation regarding EL was insignificant (Fisher’s exact test, P = 0.334). Seizures were the most commonly reported neurological symptoms among ISOD patients (28/35, 80.00%). Patients with M + M mutations seem to be less susceptible to seizures (12/18, 66.67%), though the difference did not reach significance (Fisher’s exact test, P = 0.094). Other accompanying symptoms included microcephaly (10/21, 47.62%), developmental delay (8/25, 32.0%), extrapyramidal symptoms (11/25, 44.0%), and regression (6/25, 24.0%). The only significant genotype–phenotype correlation was regression, which was only found in the M + M group (Fisher’s exact test, P = 0.017). Ten out of 25 of the patients (40.00%) died from ISOD at ages ranging from 9 days after birth to 9 years old; however, none of the patients with mild or late-onset symptoms died of the disease. Patients with M + M mutations seemed to have a lower rate of mortality (3/12, 25.00%), but it was not significant (Fisher’s exact test, P = 0.339) (Fig. 4 C).
Fig. 4
Genotype-phenotype correlation of ISOD
(A) Proportions of SUOX mutations in patients with typical and mild ISOD.
(B) Kaplan–Meier-estimated probabilities of SUOX mutations on disease onset risk according to age
(C) Correlations between SUOX mutations and comorbidities, including ectopia lentis, microcephaly, seizure, developmental delay, extrapyramidal symptoms, regression, and death. Asterisks indicate statistically significant changes
(D) Heatmap of SUOX mRNA expression normalized to ACTB in ocular tissues, brain tissues, and other organs. The housekeeping gene ACTB was used as the internal reference
ISOD, isolated sulfite oxidase deficiency; M, missense mutations; NF, nonsense /frameshift mutations
mRNA expression of SUOXConsidering the ophthalmic and neurological involvements in ISOD, we wondered if the expression of SUOX was more abundant in the ocular and nervous systems. The expression of SUOX was analyzed using human RNA expression databases, and SUOX exhibited a broad expression spectrum, with expression being most evident in the eyes and liver. In the ocular tissues, SUOX expression was prominent in the sclera and trabecular meshwork and lower in the brain and spinal cord (Fig. 4D).
留言 (0)