
記住我

The study was designed to identify the immune phenotype of HPS1 deficiency and to pinpoint cellular dysregulations that may contribute to disease pathology. All sample collection was approved by the institutional review boards (Oxford IBD cohort study and a sub-project to investigate rare diseases; 11/YH/0020, 16/YH/0247, IRB 11-01669 study protocol was used for collection of samples at Mt Sinai, NY; IRB study protocol 1250116 from the University of Puerto Rico was used for the collection of tissue). Written informed consent was provided by all patients or guardians. Only anonymous patient information was processed and since this is a rare disease, we used all HPS-1 samples that were available, as outlined in Table 1. Patients had clinical phenotypes consistent with HPS-1 and previously confirmed through genetic testing at a commercial lab or the NIH. Control PBMCs were obtained from healthy volunteers via the Oxford GI biobank.
HAP1 cell cultureHAP1 cells (Horizon Discoveries) were maintained in DMEM (Sigma) with 10% fetal bovine serum (Sigma) at 37 °C and 5% CO2. Cells were detached with 0.05% Trypsin-EDTA (Gibco). Cells were regularly checked for mycoplasma.
PBMC isolation and macrophage differentiationHealthy donor blood samples were obtained as part of the IBD cohort (09/H1204/30) and GI biobank (16/YH/0247) and HPS patient blood from Mount Sinai, NY. Lymphoprep (Axis-Shield) was used to perform density gradient centrifugation. Monocytes were enriched from PBMCs using the adherence method55,61 and treated with 100 ng/mL M-CSF (R&D systems) in RPMI-1640 (Sigma), 10% FCS (Sigma) and 1% Penicillin/Streptomycin (Sigma) for 5 days to differentiate into macrophages.
CRISPR/Cas9 gene editing and siRNA transfectionsgRNA sequences were obtained from previously reported guides62. RNP complexes were generated according to the manufacturer’s protocol using HiFi Cas9 (IDT) and transfections were performed using lipofectamine 2000 (ThermoFisher).
For siRNA transfections, we used the Rab32 siGENOME (Horizon Discovery, SMARTPool, M-009920-02-0005) and the non-targeting siRNA pool #1 (Horizon Discovery, D-001206-13-05). Cells were transfected with 40 nM siRNA and INTERFERin (Polyplus transfection, 409-10) according to the manufacturer’s protocol. Experiments were performed 72 h following transfection.
Lentiviral production and transductionPlasmids used for lentiviral transduction were pLJC5-Tmem192-3xHA (a gift from David Sabatini, Addgene plasmid 102930), psPAX2 (a gift from Didier Trono, Addgene plasmid 12260) and pMD2.G (a gift from Didier Trono, Addgene plasmid 12259). We transfected HEK293T cells (ATCC) at 60–80% confluence using lipofectamine (ThermoFisher) and Opti-MEM (Gibco). Viral supernatant was collected after 48 and 72 h, filtered through a 0.45 μm filter, and used to transduce HAP1 cells with 6 μg/mL polybrene (TR-1003-G, Sigma). After 48 h, cells were positively selected with 0.5 μg/mL puromycin (P8833, Sigma).
RNA extraction, cDNA synthesis, and qPCRRNA extraction was performed using RNeasy mini kit (Qiagen), cDNA synthesis was performed using 1 μg RNA and High Capacity cDNA Reverse Transcription Kit (Applied Biosystems). The Taqman probes (Life Technologies) used in this study include: Rab32 (Hs00199149_m1), RPLPO (Hs00420895_gH), HPS1 (Hs00945781_g1), HPS4 (Hs01031019_m1), LDLR (Hs01092524_m1), FASN (Hs01005622_m1), HMGCR (Hs00168352_m1). Expression was determined by the ΔCt method and normalized to RPLPO expression levels.
Oxygen consumption rateOxygen consumption rate (OCR) of the HAP1 cells was quantified on a XF96 extracellular flux analyzer (Seahorse Bioscience) using the Seahorse XF Cell Mito Stress kit (Agilent, catalog number 103015-100) and according to the manufacturer’s protocol. The Seahorse XFe96 FluxPak (Agilent, catalog number 102601-100) and 50,000 HAP1 cells were plated in Seahorse base media (Seahorse XF base medium (Agilent, catalog number 102353-100) in 12 replicates per condition with 1% FCS, 1 mM glutamine (Sigma, catalog number 59202C-100ML) and 2 mM sodium pyruvate (Sigma, catalog number S8636-100ML). Plates were incubated in a CO2-free incubator at 37 °C for 1 h prior to acquisition on the Seahorse machine. Basal respiration (prior to oligomycin addition) and maximal respiration (following FCCP treatment) were calculated by subtracting non-mitochondrial oxygen consumption (values after rotenone & antimycin A addition).
Western blottingCells were lysed in pH 7.5 buffer containing 50 mM Tris, 150 mM NaCl, 2 mM EDTA, 50 mM NaF, 1% Nonidet-P40 and 2 mM Na4P2O7 plus protease inhibitors (Roche). Cell lysates were loaded on NuPAGE® Novex® 4–12% Bis-Tris Protein Gels, 1.0 mm, 10 well (NP0321BOX) and running buffer (Life Technologies) using standard protocols. Blotting was done on a PVDF membrane (Invitrolon, LC2005 Thermo Fisher) using transfer buffer (Life Technologies). The following antibodies were used: anti-LAMP2 (clone H4B4, Santa Cruz Biotechnology), anti-HA (clone C29F4, Cell Signaling), anti-CTSC (clone D-6, Santa Cruz Biotechnology), anti-mTOR (2972, polyclonal, Cell Signaling), anti-pS6 Ser235/236 (polyclonal, Cell Signaling, 2211S), anti- GAPDH (clone 14C10, HRP conjugate, Cell Signaling, 3683S) and anti-β-actin (8H10D10, HRP conjugate, Cell Signaling). Signals were detected using HRP conjugated secondary antibodies (Cell Signaling) followed by enhanced chemiluminescence (ECL, GE Healthcare Life Science) and were recorded on a Biorad Chemidoc imaging system.
Confocal microscopy100,000 macrophages were seeded on tissue culture slides (Sarstedt) and infected with GFP-Salmonella, MOI 1:20, for 1 h followed by 100 μg/mL gentamicin treatment for 1 h. Cells were fixed for 10 min at 37 °C in 4% paraformaldehyde (ThermoFisher). Similarly, 80,000 HAP1 cells were stained with LysoTracker (ThermoFisher, L12492, 1:2000) for 1 h at 37 °C. Cells were stained with an anti-HA AF488 antibody (ThermoFisher, clone 16B12, A21287) for 1 h following fixation and permeabilization with 0.01% Triton for 10 min at room temperature. Cells were counterstained with DAPI and sealed with vecta shield (Vector labs). Images were acquired on a Zeiss LSM 880 microscope using a 63X/1.4 oil objective lens.
Lysosomal immunoprecipitationLysosomal immunoprecipitation was performed as described previously with minor modifications23. Lentivirus-transduced HAP1 cells were rinsed with PBS and scraped in KPBS. A cell sample was kept aside as a control while the rest was homogenized with 25 strokes of the dounce glass tissue homogenizer (VWR, #71000-516) on ice. Homogenate was centrifuged at 600 g 2 min 4 °C and the supernatant was transferred to a tube containing 50 μL Pierce anti-HA magnetic beads (ThermoFisher, #88836), mixed and put onto a gentle rotator for 5 min at 4 °C. Tubes were placed onto a magnet, washed in KPBS 3 times and dry pellets of beads-lysosomes were frozen in −80 °C for proteomic analysis. A small volume of sample was taken during the last KPBS wash for Western blot analysis.
Gentamicin protection assayThe gentamicin protection assay was performed as described previously55,61. Prior to infection, macrophages or HAP1 cells were treated with 50 μM rapamycin (Cayman Chemical), lipid mixture 1 as free fatty acids (Sigma, L0288), 50 μM cholesterol (Sigma, C8667) for 2.5 h or 50 μM etomoxir overnight (Sigma, E1905). HAP1 cells were infected at 1:100 MOI and macrophages at 1:10 MOI for 1 h with GFP-Salmonella Typhimurium (NCTC 12023), Adherent Invasive E. coli strain LF82 or Staphylococcus aureus (NCTC 657) was performed. Cells were then treated with 100 μg/mL gentamicin (Sigma) for 2 h and subsequently lysed with 1% Triton X-100 (Sigma). Lysates were then plated using the track method on LB agar plates. CFU were counted on the following day.
Flow cytometryProbes and dyesFor LDL internalization, cells were serum-starved overnight and stimulated with 2.5 μg/mL or 25 μg/mL LDL-BODIPY (L3483, ThermoFisher) or unlabeled LDL (L3486, ThermoFisher) for indicated time points. For phagocytosis measurements, we treated cells with pHrodo Red E. coli Bioparticles (P35361, ThermoFisher) for indicated time points according to the manufacturer’s protocol. For cholesterol stimulation and BODIPY staining, macrophages were treated with 5 X cholesterol or 50 μM cholesterol (Cholesterol, C8667, Sigma; Cholesterol lipid concentrate 250 X, 12531018, ThermoFisher) for 2 h and stained with 1 μg/mL BODIPY 493/503 (D3922, ThermoFisher) for 20 min at 37 °C. Lysosomal function was monitored using DQ Ovalbumin (D12053, ThermoFisher) for 2 h following 25 μg/mL LDL stimulation for 1 h. In order to measure mitochondrial ROS, we used the MitoSOX Red mitochondrial superoxide indicator (Thermo Fisher, M36008) according to the manufacturer’s instructions. Specifically, cells were treated with 5 μM MitoSOX Red in HBSS for 15 min at 37 °C.
Autophagy fluxAutophagy was measured using the FlowCellect Autophagy LC3 Antibody-based Assay Kit (Millipore, FCCH100171) and according to the manufacturer’s instructions. Cells were treated with 10 nM bafilomycin A1 (Merck, catalog number SML1661) for 2 h. Cells were then washed in Hanks’ Balanced Salt Solution (HBSS), detached, and washed in 1 X assay buffer. Cells were resuspended in 1 X reagent B solution to permeabilize cells and spun down immediately. Kit-based 1 X LC3-FITC staining was performed at room temperature for 30 min. Autophagy flux was calculated as: (bafilomycin A1 – untreated) / untreated.
PhosflowCells were treated with 50 μM rapamycin (Cayman Chemical) for 3 h. For phosflow, Fixable Viability Dye eFluor 780 (65-0865-14, eBioscience) was used prior to fixing with Cytofix (554655, BD Biosciences). Cells were permeabilized with perm buffer III (558050, BD Biosciences) and stained with pS6 pS235/pS236 (AF488, clone N7-548, BD Biosciences, 1:10 dilution).
Immune cell sortingThe sorted immune cell cDNA was used from a previous study in the lab61.
Lysosomal proteomicsProteins phosphorylated in vitro were subjected to SMART Trypsin digest (Thermo Fisher) treatment according to the manufacturer’s instructions, desalted using SepPak reversed-phase columns (Waters), and injected into an LC-MS/MS platform (Dionex Ultimate 3000 nano LC and Q-Exactive). Sample separation was undertaken using a 50-cm-long EasySpray column (ES803; Thermo Fisher) with a 75-μm inner diameter and a gradient of 2 to 35% acetonitrile in 0.1% formic acid and 5% DMSO with a 250 nL/min flow rate for 60 min. MS1 spectra with a resolution of 70,000 and an ion target of 3e6 were acquired for a maximum of 100 ms. MS/MS data were acquired after isolation with a mass window of 1.6Th and fragmentation at 28% normalized collision energy (HCD, Resolution 17,500). PEAKS V.8.5 (Bioinformatics Solutions) and a Uniprot/Trembl database (UP000005640 [homo sapiens] and UP000054420 [salmonella enterica]) were used to analyze the LC-MS/MS data set to identify phosphorylation (S, T, Y), as well as oxidation (M) and deamidation (N, Q). Mass tolerance was 10 ppm for precursor and 0.05 Da for fragment mass, 3 missed cleavages with a peptide level false discovery rate set to 1%. Freestyle 1.3 (Thermo Fisher) was used to generate extracted ion chromatograms of relevant peptides that were quantified after Gaussian smoothing (five data points). Progenesis QI (Waters) based label-free quantitation results were imported into Perseus 1.5.2.463. Quantitative data was log2 transformed and normalized by median subtraction and missing values were imputed based on normal distribution. The proteomics data have been deposited to the ProteomeXchange Consortium via the PRIDE partner repository with the dataset identifier PXD024435 and 10.6019/PXD02443564.
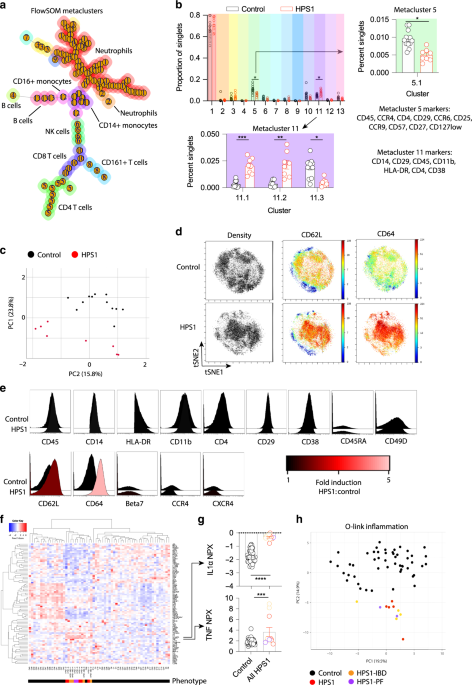
O-link proteomicsThe O-link assay was performed according to the protocol of the O-link INFLAMMATION (#11-00866) panel, which consists of 92 paired oligonucleotide antibody-labeled probes. 1 μl of patient plasma was mixed with 3 μl O-link incubation mix and incubated at 4 °C overnight. The next day the O-link extension reagent mix was added to each well, vortexed, spun down and placed into a thermal cycler for pre-amplification over 1.5 h. 2.8 μl from each well is then mixed with 7.2 μl of detection mix and placed on a 96-96 Dynamic Array Integrated Fluidic Circuit chip along with the oligonucleotide pairs. The chip is processed through the Fluidigm BioMark qPCR reader per the supplier’s protocol (https://www.olink.com). Sample data quality is normalized using O-link’s Normalized Protein eXpression Manager software. We performed a multiple unpaired t-test and proteins with a p < 0.05 were considered significant. For the downregulated proteins in HPS1 serum we used gProfiler to identify relevant pathways (https://biit.cs.ut.ee/gprofiler/gost).
CyTOF processing and analysisPrior to CyTOF assays previously optimized antibody mixtures were prepared in cell staining media (CSM, Fluidigm). Antibody lists are outlined in Supplementary Table 1. Whole blood was collected from patients into a sodium heparin vacutainer and processed within one hour. 1.2 ml of blood was mixed with 3 ml of Thaw-Lyse buffer (Smart Tube Inc.) and incubated for 10 min at room temperature. Samples were centrifuged and resuspended in 10 ml Thaw-Lyse buffer and incubated for 10 min at room temperature. Samples were again centrifuged and washed in CSM. Each sample was then resuspended in 800 μl of 1X Barcode Perm Buffer (Fluidigm Inc.). Compatible Pd-barcodes were thawed, resuspended in 100 μL of 1X Barcode Perm Buffer and added to the samples, followed by 30 min on ice and washing in CSM and pooled together. Each barcoded set of samples was resuspended in 100 μL CSM containing 100 U ml−1 heparin (Sigma) to block non-specific MaxPar Antibody binding. A titrated surface antibody panel (Supplementary Table 1) designed to allow identification of all major immune subsets was prepared in 100 μl CSM, filtered through a 0.1 μm spin filter (Amicon) and added to the sample. Samples were stained for 30 min on ice, washed with CSM and fixed with 2% formaldehyde (Electron Microscopy Sciences) in PBS. The samples were washed and permeabilized with 1 ml ice-cold 100% methanol. Samples were incubated on ice for 30 min (or transferred to −80 °C for long-term storage), washed twice with CSM, and resuspended in 100 ul CSM with heparin. Samples were washed with CSM and incubated for 30 min in 2% formaldehyde in PBS containing 0.125 nM Ir nucleic acid intercalator (Fluidigm). The samples were washed and stored as pellets in CSM until CyTOF acquisition.
Immediately prior to acquisition, samples were washed with PBS and deionized water, counted and resuspended at a concentration of 1 million cells ml−1 in water containing a 1/20 dilution of EQ. 4 Element Beads (Fluidigm). Samples were acquired on a CyTOF2 Mass Cytometer equipped with a SuperSample fluidics system (Victorian Airships) to facilitate bulk sample acquisitions. Samples were acquired at a flow rate of 0.045 mL min−1 and an event rate of <400 events per second. CyTOF FCS files were concatenated and normalized using the bead-based normalization tool in the Helios software (Fluidigm), the barcoded samples were automatically deconvoluted and cross-sample doublets were filtered using a Matlab-based debarcoding tool65 and the resulting files were uploaded to Cytobank. Cell events were identified as Ir191/193 positive events, and residual Ce140+ normalization beads were excluded.
All analyses of CyTOF samples were performed using Cytobank software. High-dimensional analysis used to map the multi-dimensional data into 2-dimensional space include a self-organizing map (SOM, FlowSOM) and t-distributed stochastic neighbor embedding (viSNE). All high-dimensional analyses were performed on singlets and the data files analyzed together to ensure cells clusters are stable across experiments. In all analyses cells were clustered using surface antibody markers. For viSNE and FlowSOM analysis all samples were set to equal sampling at 30,000 events per sample and run per default parameters for the software. For FlowSOM metacluster number was optimized to minimize metaclusters composed of a single cluster. Major immune populations were identified based on canonical marker expression patterns. Principal component analysis of FlowSOM metaclusters was performed using SPSSv26 based on eigenvalue > 1 without rotation. A heatmap of surface marker expression was generated using the heatmap.2 package in R 3.5.1. Comparison of cell populations between patient cohorts were done using GraphPad Prism and unpaired t-test with Bonferroni-Dunn correction for multiple comparisons.
RNAseq pre-processing and analysisTotal RNA quantity and integrity were assessed, using Quant-IT RiboGreen RNA Assay Kit (Invitrogen, Carlsbad, CA, USA) and Agilent Tapestation 2200 RNA Screentape. Purification of mRNA, generation of double stranded cDNA and library construction were performed using TruSeq® Stranded mRNA HT (RS-122-2103) with minor modifications to manufacturer specifications. Minor modifications- the following custom primers (25 µM each) were used for the PCR enrichment step:
Multiplex PCR primer 1.0
5′-AATGATACGGCGACCACCGAGATCTACACTCTTTCCCTACACGACGCTCTTCCGATCT-3′
Index primer
5′-CAAGCAGAAGACGGCATACGAGAT[INDEX]CAGTGACTGGAGTTCAGACGTGTGCTCTTCCGATCT-3′
Indices were according to the eight bases tags developed by WTCHG (Lamble et al.).
Amplified libraries were analyzed for size distribution using the Agilent Tapestation 2200 D1000. Libraries were quantified using Picogreen and relative volumes were pooled accordingly. Sequencing was performed as 75 bp paired-end read on a HiSeq4000 according to Illumina specifications.
The pre-processing of the RNA-seq data was performed through a python 3.6 pipeline using ruffus and cgatcore (https://github.com/cgat-developers/cgat-core/tree/master/cgatcore). For the initial quality control of samples, fastqc was performed on all fastq files and the files were aligned to hg38 using hisat2. We counted the reads using featureCounts and perfomed multiqc on all the results.
DESeq2 apeglm method was used to find differentially expressed genes66,67. For PCA plots, we used the variance stabilizing transformation method.
For pathway analysis, we performed fgsea using Hallmark pathways from the MSigDb (Broad Institute). For go-seq analysis, we used the TxDb hg38 database and used significantly differentially expressed genes (p < 0.05 and log2FC > 1)68.
For Weighted Gene Correlation Analysis69, the parameters were softpower = 10, minmodsize = 30, merge tree dissimilarity = 0.25. We exported our results to Cytoscape and used the ClueGO plugin for pathway analysis and visualization.
Nanostring GeoMx DSP analysisSections of 5 μm were cut from FFPE tissue blocks under RNase free conditions, placed onto Leica+ adhesive microscopic slides and subsequently baked over night at 60 °C. Manual slide preparation was conducted according to the NanoString protocol. Briefly, the slide was deparaffinized and rehydrated. Target retrieval was performed using IHC Antigen Retrieval Solution (eBioscience; 10 mM Tris, 1 mM EDTA at pH 9) for 20 min at 100 °C, and then 15 min at 37 °C in 1 μg/ml Ambion Proteinase K (ThermoFisher Scientific). Post-retrieval, the slides were fixed in minutes in 10% neutral buffered formalin and washed. Samples were then treated with UV light (405 nm) for 24 h to quench background autofluorescence. Next, the slide was incubated with human Whole Transcriptome Atlas probes (Nanostring) overnight.
The slide was washed in formamide-SCC buffer before tissue blocking and immunofluorescent staining in Buffer W (Nanostring) with 1% Fc-Receptor block (Miltenyi) and 5% donkey serum (blocking buffer). The sections were then incubated with 1:200 anti-CD68 (SantaCruz, mouse, [KP1]) and 1:200 anti-CD3 (Abcam, rabbit, [SP162]) for 1 h; followed by 1:1000 anti-mouse-AF647, 1:1000 anti-rabbit-Cy3, 1:40 CD45-AF594 (Nanostring) and 1:20,000 Sytox Green for 1 h. All antibody incubations were done in blocking buffer at RT.
The slide was transferred into the Nanosting GeoMx Digital Spatial Profiler for imaging and the manual selection of areas of interest (AOI), from which oligonucleotide probes were collected. For the generation of the library, the samples were subjected to a PCR using i5 and i7 dual indexing primers (Nanostring) before pooling and purification was performed using AMPure XP beads (Beckman Coulter). Quality control of the generated library was done using a Qbit (ThermoFisher Scientific) and TapeStation (Agilent). The resulting library was sequenced on the Illumina NovaSeq platform using 150 bp paired-end sequencing.
The resulting Fastq files were converted into DCC files using the GeoMxNGSPipeline (version 2.0.0.16) on the University of Oxford Advanced Research Computing (ARC) facility70 and initial quality control was conducted on the GeoMx DSP analysis suite (version 2.3.0.268). The number of reads during the sequencing steps (>1000 reads), the sequencing saturation (>50%) and the negative probe count geomean (>10) were evaluated against manufacturer recommended thresholds (Supplementary Fig. 8a). Genes which did not rise above the geomean of negative probes+(3*geometric standard deviation) in more than 3 segments or areas of interest (AOI) were excluded, resulting in 15,689 out of 18,677 genes. The filtered transcript dataset was then quantile normalized (preprocessCore 1.58.0) and a principal component analysis was carried out on log2 transformed data (R version 4.2.1, factoextra 1.0.7) (Supplementary Fig. 8b). For cell deconvolution, the package spatialDecon (version 1.6.0) was applied to the normalized data and mapped against cell profiles provided by human adult gut scRNAseq atlas from the Human Cell Atlas project.
STRING analysis of differentially expressed genes from spatial transcriptomicsThe top differentially expressed genes with a p < 0.001 between the granuloma region and lamina propria were used as input for STRING database analysis. The top 5 pathways ranked by the false discovery rate for KEGG, Reactome, and Diseases are shown with parameters of a physical subnetwork and a confidence of 0.400.
Single-cell RNA-sequencing data generation from peripheral blood leukocytes200 µL fresh whole blood from a single healthy donor were incubated in 2 mL Ammonium-Chloride-Potassium (ACK) lysis buffer in a 50 mL falcon tube for 5 min, washed two times in 1x PBS (Sigma) by centrifugation (800 rpm, 10 min) at room temperature followed by a second round of ACK treatment, washing and spinning. Cells were resuspended in cooled PBS supplemented with 0.5% FCS (Sigma) at 1000 cells/µL. A total of eight samples were processed in parallel. For loading onto the Chromium 10x Genomics platform cells were washed in 1x PBS with 0.04% BSA and resuspended. 10,000 single cells/channel were captured in droplets (less than two hours following phlebotomy).
Library generation for 10x Genomics v2 chemistry was performed following the Chromium Single Cell 3ʹ Reagents Kits User Guide (CG00052). Quantification of libraries was performed using an Agilent Bioanalyzer and Bioanalyzer High Sensitivity DNA Reagents (Cat.# 5067-4627). Single-cell RNA-sequencing libraries were generated using the 10x Genomics Single Cell 3′ Solution (version 2) kit and sequenced to a mean depth of 9981 reads/cell (Illumina HiSeq 4000). An average of 2617 cells/per sample and 913 genes/cell were recovered. Read mapping, quantitation, aggregation of sample count matrices and basic cell filtering (soloCellFilter) was performed using the STARsolo pipeline (star (Version 2.7.5b), samtools (Version 1.9))71, version 1.20 (GRCh38) reference sequences, and the Galaxy platform72 (Settings: Length of the genomic sequence around annotated junctions = 100, Strandedness of Library = Forward, Collect UMI counts for these genomic features = Gene, UMI deduplication (collapsing) algorithm = All).
A Seurat object was created and counts were filtered to include features detected in at least 3 cells and cells filtered to include at least 200 features using the Seurat R package (v4.0.0)73. In addition, data were filtered to exclude droplets for which a high percentage of mitochondrial RNAs (>15%) and for which more than 2500 features (<2500) were detected. Doublet detection and filtering was performed using DoubletFinder (v2.0.3)74. Cell cycle stage scoring and annotation was performed by applying the cyclone function implemented in the scran R package (v1.16.0)75. The ScTransform function76 implemented in the Seurat R package was used to normalize expression values, to scale the data, to identify variable features (variable.features.n = 3000), and to regress out mitochondrial features as a source of unwanted variation. Jackstraw permutation tests run on data normalized applying the NormalizeData function to determine significant principal components (P < 0.0001). Elbow plots were used to determine the dimensionality of the ScTransfrom-normalized dataset (n = 37). The clustree R package (v0.4.3)77 was used to produce a visualisation for interrogating clustering over increasing resolutions. The FindClusters function was used to generate a shared nearest neighbour (SNN) graph and to identify cell clusters (resolution parameter = 1.0). Cell clusters were visualized with the RunTSNE or RunUMAP functions and cluster-specific genes expression profiles were determined using the FindAllMarkers function (Settings: only.pos = TRUE, min.pct = 0.25, logfc.threshold = 0.25). Clusters of cells were assigned identifiers based on manual inspection of differential gene expression profiles and comparison with known cellular gene expression signatures. Dotplots were generated using the DotPlot function in Seurat.
Publicly available datasetsPublicly available datasets (SCP259, GSE135893, GSE130973) were used for gut, lung, and skin, respectively, to extract the expression of RAB38, RAB9A, RAB32, HPS1 and HPS4 expression across different cell types. For the analysis, we used the codes made available by the authors33,78. For the gut cells (immune, fibroblast and epithelial) expression levels were scaled to 60%. All the dotplots show average expression and percentage expression across different cell types. HPS1 knockout lung organoid EPCAM + epithelial cells (GSE121999) were FACS sorted to perform RNA-seq and identify changes compared to wild type cells, which we analyzed using the above RNA-seq pipeline79.
Statistical analysisData analyses apart from RNA-seq analysis and CyTOF analysis (described above) were performed using GraphPad software (GraphPad software, Inc., San Diego, CA). Statistical tests and significance are mentioned in each figure legend.
Data accessibilityThe bulk RNAseq dataset of HPS1 and control macrophages has been deposited under EGAD00001006978. The single cell data has been deposited at the EGA under EGAS00001005098. The proteomics data have been deposited to the ProteomeXchange Consortium via PRIDE with the identifier PXD024435 and 10.6019/PXD024435.
留言 (0)